
2020 ANNUAL REPORT

A Mission of Enabling
Growth and Progress
What You Can Expect From Us and
What We Expect From Ourselves
Citi’s mission is to serve as a trusted partner to our clients by
responsibly providing financial services that enable growth
and economic progress. Our core activities are safeguarding
assets, lending money, making payments and accessing the
capital markets on behalf of our clients. We have 200 years
of experience helping our clients meet the world’s toughest
challenges and embrace its greatest opportunities. We are Citi,
the global bank — an institution connecting millions of people
across hundreds of countries and cities.
We protect people’s savings and help them make the purchases —
from everyday transactions to buying a home — that improve the
quality of their lives. We advise people on how to invest for future
needs, such as their children’s education and their own retirement,
and help them buy securities such as stocks and bonds.
We work with companies to optimize their daily operations,
whether they need working capital, to make payroll or export
their goods overseas. By lending to companies large and
small, we help them grow, creating jobs and real economic
value at home and in communities around the world. We
provide financing and support to governments at all levels,
so they can build sustainable infrastructure, such as housing,
transportation, schools and other vital public works.
These capabilities create an obligation to act responsibly,
do everything possible to create the best outcomes, and
prudently manage risk. If we fall short, we will take decisive
action and learn from our experience.
We strive to earn and maintain the public’s trust by constantly
adhering to the highest ethical standards. We ask our
colleagues to ensure that their decisions pass three tests:
they are in our clients’ interests, create economic value, and
are always systemically responsible. When we do these things
well, we make a positive financial and social impact in the
communities we serve and show what a global bank can do.
Citi’s Value Proposition

Financial Summary
In billions of dollars, except per-share amounts, ratios and direct staff
2020 2019 2018
Global Consumer Banking Net Revenues $ 30.0 $ 33.0 $ 32.3
Institutional Clients Group Net Revenues 44.3 39.3 38.3
Corporate/Other Net Revenues 0.1 2.0 2.2
Total Net Revenues $ 74. 3 $ 74. 3 $ 72.9
Net Income $ 11.0 $ 19.4 $ 18.0
Diluted EPS — Net Income 4.72 8.04 6.68
Diluted EPS — Income from Continuing Operations 4.73 8.04 6.69
Assets $ 2,260 $ 1,951 $ 1,917
Deposits 1,281 1,071 1,013
Citigroup Stockholders’ Equity 199 193 196
Basel III Ratios — Full Implementation
1
Common Equity Tier 1 Capital 11.7% 11.8% 11.9%
Tier 1 Capital 13.3% 13.3% 13.4%
Total Capital 15.6% 15.9% 16.1%
Supplementary Leverage 7. 0% 6.2% 6.4%
Return on Assets 0.50% 0.98% 0.94%
Return on Common Equity 5.7% 10.3% 9.4%
Return on Tangible Common Equity 6.6% 12.1% 11.0%
Book Value per Share $ 86.43 $ 82.90 $ 75.05
Tangible Book Value per Share 73.67 70.39 63.79
Common Shares Outstanding (millions) 2,082 2,114 2,368
Total Payout Ratio 73% 122% 109%
Market Capitalization $ 128 $ 169 $ 123
Direct Staff (thousands) 210 200 204
Totals may not sum due to rounding.
1
Please see Key Capital Metrics on page 4.
1

We were one of the first banks in the U.S. to
announce consumer assistance programs
for our credit card and mortgage customers.
Though Citi historically has not been a large
lender to small businesses, by year end we
funded loans totaling $3.8 billion as part of the
U.S. Small Business Administration’s Paycheck
Protection Program and donated $50 million
in proceeds from the program to support
community economic recovery efforts.
For our globally minded clients who include
multinational companies, emerging market
leaders, governments, investors and ultra-
high net worth households, we have been
helping them contend with volatile markets,
reconfigure supply chains, and access short-
and long-term liquidity.
Dear Shareholders:
Never could I have imagined
that my final year as CEO of
Citi would be consumed by
a once-in-a-century health
crisis that would upend the
global economy and the
lives of everyone on our
planet. It was a year filled
with immense pain and
uncertainty but also courage
and purpose — and we can
take heart that even as it
did its worst, the global
pandemic has brought out
the best in us.
2020 was a year that tested Citi like never before. From the beginning, I was
determined to see that Citi not merely manage through but emerge stronger
from the pandemic — and that, in addition to serving as a source of strength
for our clients, we seize the opportunity to help lead the relief and recovery
and remind the world of the invaluable role that Citi plays as a global bank.
I’m proud to say we have done that, by every measure. Entering the
pandemic on a solid footing from a capital and liquidity perspective gave
us the resources we needed to support our colleagues, customers, clients
and communities during the sharpest economic downturn since the Great
Depression. That financial stability enabled us to do many things to catalyze
the recovery without jeopardizing our own safety and soundness.
From the onset of the pandemic, we acted swiftly. When shelter-at-home
orders were issued last March by governments around the globe, we
undertook a massive effort to keep our employees safe while serving our
clients seamlessly. Within days, we had nearly 200,000 of our colleagues up
and running at their kitchen tables and home offices. We offered childcare
and in-home care options and enhanced health and education resources
and provided special compensation to help ease the financial burden for
75,000 colleagues.
Letter to Shareholders
Michael L. Corbat
Chief Executive Officer
October 2012 – February 2021
2

And because we take seriously our
responsibility to the communities we
serve, we have supported front-line health
workers and deployed other resources to
those who desperately need help. Combined
with donations from Citi colleagues,
contributions to pandemic-related causes
from our company and the Citi Foundation
topped $100 million in 2020.
Providing Strength in a Year
of Upheaval
Despite the tumultuous impacts of the
pandemic, we turned in solid financial results
during 2020. In an operating environment
more uncertain and challenging than any
in recent memory, we kept revenues flat to
the banner year of 2019. In 2020, we earned
$11 billion of net income on revenues of
$74 billion despite the roughly $10 billion
increase we took in credit reserves as a
result of the pandemic and the impact of
current expected credit losses.
Even after meeting the capital and liquidity
needs of our clients, we closed out the
year exceptionally well-capitalized, with
a Common Equity Tier 1 ratio of 11.7%,
exceeding our 10% regulatory minimum.
We also increased our Tangible Book Value
per Share to $73.67, up 5% from 2019.
Our Institutional Clients Group performed
well, delivering 13% revenue growth,
positive operating leverage and 22%
operating margin growth for the year.
Our Treasury and Trade Solutions
business, although negatively affected
by lower rates, experienced strong client
engagement and digital adoption, including
a 9% year-over-year increase in users of
our CitiDirect BE
®
banking platform.
Our global expertise means that we
continue to be the first call for many of
the most significant financial transactions
and activities. In September, our team led
the initial public offering for the enterprise
software company Snowflake, which
returned 100% to investors while creating
a new $65 billion market cap company.
In November, we were selected to serve as
the financial advisor to the international
public health organization Gavi in its effort
to equitably distribute 2 billion vaccine
doses for COVID-19 by the end of 2021.
Our Global Consumer Bank bore the impact of sharply decreased credit
card spending, although we did see deposit growth in every region. In
the U.S., our retail business benefited from exceptionally high mortgage
refinancing as homeowners saw opportunities in this ultra-low-rate
environment, and we experienced continued momentum in digital deposits.
In Mexico, an ongoing slowdown in overall economic growth and industry
volumes resulted in lower revenues. In Asia, card spending was down,
but we saw strong performance in wealth management, with investment
revenues at their highest level in a decade.
“ Citi is an incredible institution with a
proud history and a bright future. I am
excited to join with my colleagues in
writing the next chapter.”
Jane Fraser
Chief Executive Officer
March 2021 –
3
1
Results exclude Corporate/Other revenues
(of $0.1 billion) and are non-GAAP financial measures.
2
Asia GCB includes the results of operations of GCB
activities in certain EMEA countries.
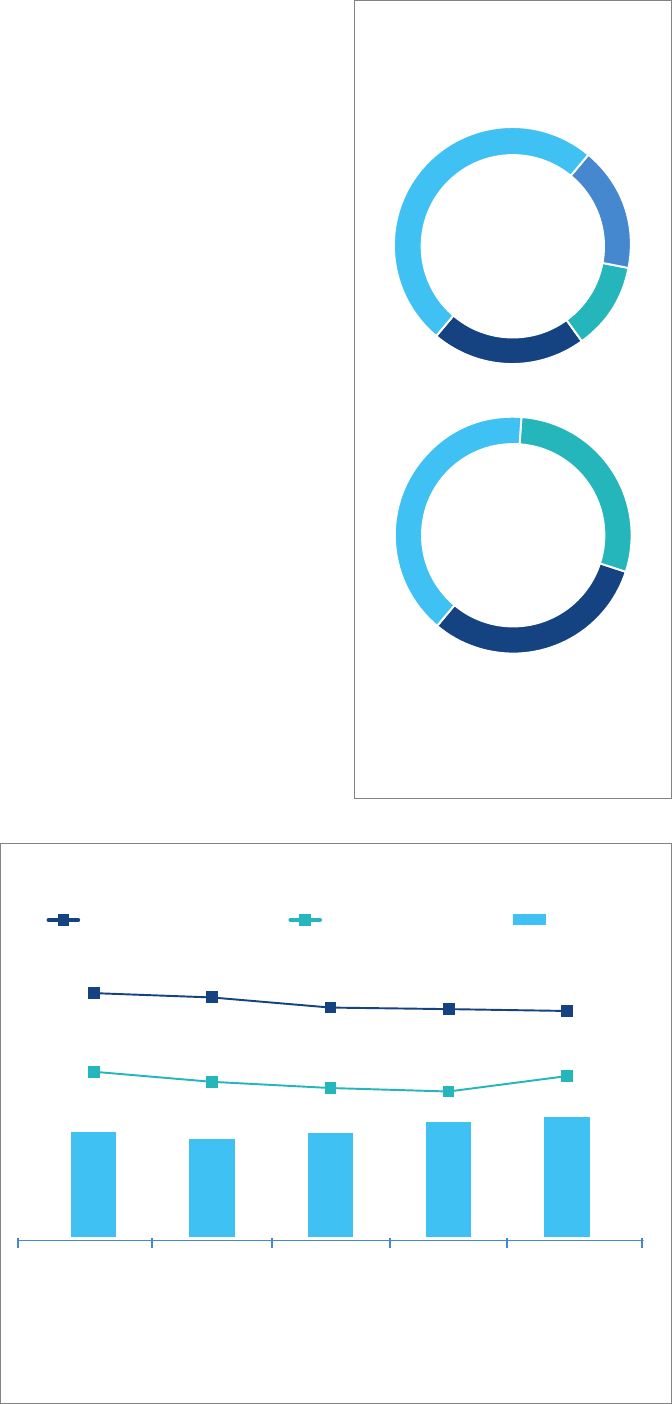
ICG — Institutional Clients Group
2020 NET REVENUES
1
$74.2 Billion
BY REGION
BY BUSINESS
North America
50%
Europe,
Middle East
and Africa
(EMEA)
17%
Asia
2
21%
Latin America
12%
ICG Markets and
Securities Services
31%
Global
Consumer
Banking (GCB)
40%
ICG Banking
29%
TBV/Share
2
Common Equity Tier 1 Capital Ratio
1
Supplementary Leverage Ratio
1
CITIGROUP — KEY CAPITAL METRICS
4Q’164Q’174Q’18
11.8%
12.4%
6.7%
12.6%
7.2%
11.9%
6.4%
1
Citigroup’s Common Equity Tier 1 Capital Ratio and Supplementary Leverage Ratio for 2017 and 2016
are non-GAAP financial measures. For additional information, please see “Capital Resources” in Citi’s
2017 Annual Report on Form 10-K.
2
Tangible Book Value (TBV) per share is a non-GAAP financial measure. For a reconciliation to reported
results, please see “Tangible Common Equity, Book Value Per Share, Tangible Book Value Per Share and
Returns on Equity” in Citi’s 2020 Annual Report on Form 10-K.
6.2%
11.7%
7.0%
$70.39
$64.57
$60.16
$63.79
4Q’19
$73.67
4Q’20
We continued to combine our scale,
digital capabilities and ecosystem to be
where our customers need us to be. In
the U.S., our largest consumer market,
we expanded our lending partnership
with American Airlines, announced
private label and co-brand credit card
agreements with two new partners,
Meijer and Wayfair, and drove robust
digital deposit sales. In Mexico, we
worked with PepsiCo Alimentos Mexico
and Amigo PAQ to enable mobile
access to credit to more than 800,000
shopkeepers through our Citibanamex
digital apps. And in Asia, we expanded
our partnership with Grab to offer
personal loans through the ride-hailing
company’s app.
Putting Citi on a
Strong Footing
More than anything, 2020
demonstrated the value of our
diversified and durable business model.
But for Citi, the story of 2020 actually
began many years earlier.
When I was appointed CEO in 2012, the
firm was still in a tenuous position from
the financial crisis several years before.
At the time, I decided to accelerate a
strategy that returned the firm back to
basics. We streamlined our consumer
business and embraced the shift to
digital. We re-established Citi as a
go-to bank for our institutional clients
through our global network.
Working through our legacy assets,
we optimized our capital base and
reduced our net deferred tax assets by
more than half, generating $7 billion
of regulatory capital in the process.
Our financial performance improved
steadily as we became a simpler,
smaller, safer and stronger institution.
We transitioned from restructuring the
firm to investing in it and significantly
improved our returns.
Before the pandemic’s impact on the
economy and our businesses took hold,
we had made tremendous progress in
closing the gap with our peers. From
2012 to 2019:
• Citi’s Net Income increased from
$7.5 billion to $19.4 billion.
• Citi’s Return on Assets increased
from 39 bps to 98 bps.
• Citi’s Efficiency Ratio improved
from 72.0% to 56.5%.
• Citi’s Return on Tangible Common
Equity increased from 5.0% to 12.1%,
closing the gap with our peers.
We dramatically increased the return
of capital to common shareholders.
From 2015 through 2019, we returned
nearly $75 billion to our common
shareholders while also reducing our
share count by 30%.
Showing how far Citi has come since
the financial crisis, in 2020 — the year
of a pandemic — we had $3.5 billion
more in Net Income, an 11 bps higher
Return on Assets and 160 bps higher
Return on Tangible Common Equity
than we had in 2012. That’s great
progress but make no mistake: It was
rooted in the hard work we put in
during the years leading up to 2020.
Prudent decisions we made in the wake
of the last crisis have proved their full
value in this one.
4

Leading with Purpose
Amid a global health crisis that has
created so much economic and social
upheaval, Citi’s efforts to tackle long-
standing societal challenges have
become even more important.
We kicked off the year with the launch
of the Citi Impact Fund in January.
With $200 million to invest, it is the
largest fund of its kind established
by a bank with its own capital. In just
its first year, the Citi Impact Fund has
invested in 11 companies, the majority
of which are founded by women,
minorities — and in some cases both
— that have the potential to make our
cities and communities more equitable
and sustainable.
The pandemic focused the spotlight
on another intensifying global crisis
— climate change. For more than two
decades, Citi has led the industry’s
drive toward sustainability. In 2020,
we announced a new five-year goal to
finance and facilitate $250 billion in
environmental projects and activities,
following on the heels of completing
$100 billion in environmental
transactions four years faster than
the goal we had set.
2020 also brought a long overdue
reckoning with systemic inequity
and social injustice. In the aftermath
of the murder of George Floyd, we
launched Action for Racial Equity, which
encompasses $1 billion in strategic
actions to help close the racial wealth
gap and increase economic mobility in
the U.S. The initiative underscores our
determination to mobilize the full power
of our business activities to attack
the barriers that keep racially diverse
communities from building wealth.
Each of these efforts helps advance
our ambition to be a leader on a broad
range of societal issues and challenges.
In each case, these efforts enjoy the full
support of our franchise because this
is about more than just “doing good.”
It is a business imperative. By building
a fairer, more inclusive and more
sustainable economy, we all benefit —
our company, our clients and customers,
and the communities we serve.
Building on Our Success
Looking back at my time as CEO, I
could not be more proud of what our
firm has achieved. But I know there
is always more to do. The pandemic
will irrevocably change many things
about banking, and we must embrace
this opportunity to achieve a state of
excellence in our risk and controls, our
infrastructure and our ability to serve
our clients.
Consent orders issued in October
by the Federal Reserve Board and
the Office of the Comptroller of the
Currency have created additional
urgency and a framework for the
firm’s transformation. Central to
addressing regulators’ concerns
is improving Citi’s risk and control
environment, which will be essential
to the new digital landscape.
Now, after 38 years at Citi, I leave
this institution with Jane Fraser’s
hands at the helm, confident in the
quality and comprehensiveness
of the transformation she will be
leading so Citi can continue its
journey back to being the world’s
leading bank. I leave Citi perhaps
proudest of the fact that it is again
an indisputably strong and stable
institution — and an institution our
colleagues are proud of which to be
a part. And I know that Jane will take
our great firm to new heights while
maximizing returns and delivering
the full benefits of our franchise to
all our stakeholders.
I will always be rooting for Citi.
Sincerely,
Michael L. Corbat
Chief Executive Officer, Citigroup Inc.
1
Tangible Book Value (TBV) is a non-GAAP financial measure. For the components of the TBV calculation, see “Capital Resources — Tangible Common
Equity, Book Value per Share, Tangible Book Value per Share and Returns on Equity” in Citi’s 2020 Annual Report on Form 10-K included with this letter.
2
Return on Tangible Common Equity (ROTCE) is a non-GAAP financial measure. For the components of the ROTCE calculations, see “Capital Resources —
Tangible Common Equity, Book Value per Share, Tangible Book Value per Share and Returns on Equity” in Citi’s 2020 Annual Report on Form 10-K included
with this letter.
5

2020
Global Consumer Banking
Citi’s Global Consumer Bank (GCB) is a global
leader in banking and wealth management, the
world’s largest credit card issuer and a partner
of choice globally to the world’s most iconic
brands and digital leaders. The Global Consumer
Bank serves more than 110 million clients in the
U.S., Mexico and Asia, spanning 19 markets.
In 2020, the Global Consumer Bank continued to execute a digital-first,
client-led growth strategy while pivoting swiftly to provide value, service and
support to clients and communities impacted by the COVID-19 pandemic.
The GCB’s model is distinct: digital-first capabilities complemented by a light
physical footprint in leading urban markets. Our relationship banking model
serves clients across the full spectrum of their needs as they borrow, pay,
save, invest and protect and is supported by global assets and capabilities that
are deployed locally. With a high-quality, highly digitally engaged customer
base and one of the most dynamic partner ecosystems in the industry, the
franchise is well positioned for where the world is headed.
In a rapidly changing landscape, the GCB intensified its focus on three
strategic priorities to position the franchise for long-term growth: winning in
wealth management; leading in consumer payments and lending; and driving
scale through digitization and partnerships. With digital at the core of our
strategy, GCB delivered double-digit growth in deposits, enhanced value
propositions and provided an array of digital capabilities, garnering industry
accolades for client experience. Citi was named Best Digital Bank in Asia
(Euromoney), Best Digital Bank in Mexico (Global Finance) and Bank with the
Most Desirable Mobile Banking Digital Money Management Features in the
U.S. (Insider Intelligence).
At the onset of the COVID-19 pandemic, Citi responded quickly, enabling
thousands of colleagues to work from home in a matter of weeks, with requisite
training, technology and onboarding, while retaining servicing for customers.
We launched assistance programs in
markets worldwide, the first large bank
to do so in the U.S., while also facilitating
free cashing of U.S. government
stimulus checks for non-customers.
We continued to serve clients safely
in branches, introducing new safety
measures and cleaning protocols, as
well as innovative ways to serve clients
remotely, such as video banking in
Asia and the U.S. As COVID-19 made
mobile capabilities, high-touch digital
services and the human touch critical,
Citi introduced new and enhanced digital
and mobile capabilities and evolved
product benefits across our credit card
portfolios to ensure value, utility and
relevance to customers.
As of December 31, 2020, Citi
had assisted more than 5 million
customers and small businesses
worldwide with a range of assistance
measures, including fee waivers and
deferral of credit card minimum
payments. In the U.S., as part of
the Small Business Administration’s
Paycheck Protection Program (PPP),
Citi funded more than $3 billion to
U.S. small businesses, many in the
areas hardest hit by COVID-19. Net
profit earned through participation
in the PPP was donated to the Citi
Foundation to support community
economic recovery efforts.
The GCB operates approximately 2,300
branches and generated $1.1 billion
in pretax earnings in 2020. At year
end, the business had $345 billion in
deposits, $282 billion in loans and $222
billion in assets under management.
10
CitiDirect BE
®
ranked
#1 globally in Greenwich
Associates’ Digital Banking
Benchmarking Study
15
Citi releases update on its
global pay equity review,
including progress on its
raw pay gap analysis
17
Citi launches $150 million
Impact Fund to make
investments in double
bottom-line startups
with an emphasis on
women and minority
entrepreneurs
28
Citi Retail Services
announces multi-year
strategic agreement
with Meijer
JANUARY
6

relevant accelerators to the Citi Premier
Card, including increased rewards for
supermarket and restaurant purchases,
including takeout and curbside pickup.
In addition, we introduced a temporary
point-redemption option for U.S.
cardholders by providing them with
the choice to redeem cash rewards and
ThankYou Points to pay the minimum
due on their credit card.
We teamed up with World Central
Kitchen, a nonprofit organization
that uses the power of food to heal
communities and strengthen economies
in times of crisis and beyond, on a
program to support hunger relief
efforts during COVID-19 while further
encouraging digital banking adoption
among clients. In addition, we joined
with Mastercard and a nonprofit
organization called Start Small Think
Big to help small businesses. As a
long-time partner of Global Citizen,
we supported its global broadcast and
digital special, One World: Together at
Home, in support of the World Health
Organization and regional charities
working to meet immediate COVID-19
needs locally.
With physical cards rapidly digitizing,
we continued to expand digital lending
capabilities and point-of-sale solutions
to give customers ease, convenience
and choice in payments.
In the U.S., we introduced our
proprietary Citi Flex Pay capabilities to
American Airlines co-brand cardholders
and on Amazon. Citi Flex Pay enables
customers to finance purchases by
converting eligible purchases into a
fixed payment plan. Citi Flex Loan, a
digital lending solution introduced in
2019 that enables customers to convert
FEBRUARY
29
Stonewall Top 100:
Citi ranked #1 LGBT-
inclusive financial
services employer
30
Citi introduces Citi
Wealth Builder, an
easy-to-use, low-cost
digital investing platform
with professionally
managed portfolios
3
Citi Commercial Cards
boosts digital servicing
experience for clients with
launch of an intelligent
virtual agent capability
4
Citi named Best Global
Bank for Liquidity
Management by
Global Finance
Credit Cards
Citi is a global leader in payments, with
132 million accounts and $505 billion
in annual purchase sales, and has
unrivaled partnerships with premier
brands across Citi Branded Cards and
Citi Retail Services. At year-end 2020,
card receivables were $153 billion.
Citi Branded Cards
Citi Branded Cards provides payment,
credit and lending solutions to
consumers and small businesses, with
54 million accounts globally. In 2020,
Citi Branded Cards generated annual
purchase sales of $427 billion and
ended the year with a loan portfolio
of $107 billion.
In 2020, we continued to evolve our
value propositions, expand co-brand
partnerships and provide new digital
capabilities to make purchases faster,
convenient and more rewarding.
In the U.S., as part of a more
integrated, multi-product relationship
model, we expanded our lending
partnership with American Airlines, our
partner of more than three decades, to
include the Citi Miles Ahead
TM
Savings
Account, a new deposit product
exclusively for American Airlines co-
brand cardholders who reside within
the U.S. but outside locations where
Citi has a retail branch presence. The
account provides the ability to earn
more miles on everyday purchases, as
well as relationship-based offers.
During an unprecedented year marked
by the pandemic, we actively engaged
with cardholders to ensure we met their
evolving needs. In the U.S., for example,
we introduced relevant points offers on
the Citi Prestige
®
Card and expanded
the $250 travel credit to include
supermarket and restaurant purchases
through 2021. Similarly, we introduced
Throughout the pandemic, Citibanamex colleagues continued to provide warm and professional
service to clients in branches while following guidelines to ensure their well-being.
7
2020
a portion of their credit line into a
fixed rate personal loan, continued to
perform well, with the average balance
more than doubling.
In Asia, more than 60% of personal
loans were made digitally through its Citi
Quick Cash, Citi PayLite and Citi Flexibill
solutions. A seamless, self-service
mobile application journey, coupled
with data-enabled real-time triggers,
helped meet customers’ borrowing
needs, with lending volumes in the
mobile app up 67% despite a challenging
environment. Innovation remains at the
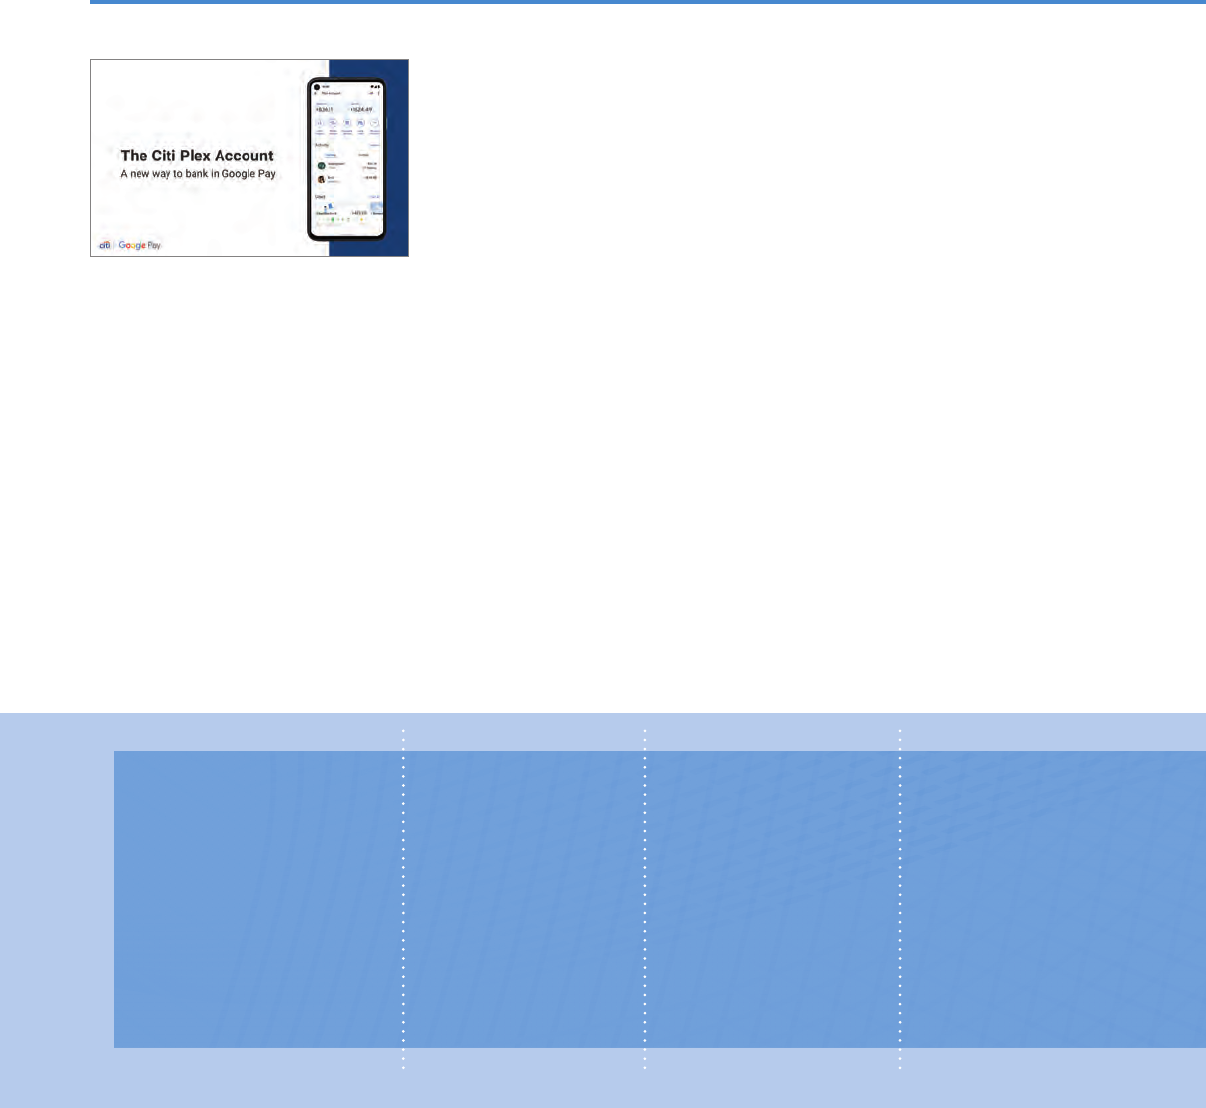
A NEW WAY TO BANK NATIONWIDE ON GOOGLE PAY
Alongside the launch of the
redesigned Google Pay in
the U.S., then-Citi President
and current CEO Jane Fraser
shared a sneak preview of
the Citi
®
Plex
TM
Account by
Google Pay in 2021.
Today, customers want an integrated experience where their relationship
with money operates at the same speed as the rest of their life. At Citi,
we want to empower them with an account that provides smart — very smart —
financial services built from the ground up with financial wellness and mobile
functionality at its core.
The Citi Plex Account is a new digital checking and savings account built
to make managing money simpler, smarter, safer and more rewarding,
with financial wellness and mobile functionality at the core of the design.
Consumers will open and manage these accounts through the Google Pay
app on both Android and iOS.
“Just over a year ago, we set out on a journey with Google to create an
experience that is 100% digital, and different, in banking,” said Anand Selva,
CEO of the U.S. Consumer Bank and incoming CEO of the Global Consumer
Bank. “The Citi Plex Account is designed to give customers an always-on,
friction-free, personalized experience at their fingertips.”
forefront of our business, with the recent
expansion of our Grab partnership that
allows customers to obtain personal
loans on the Grab app via application
programming interfaces (API).
In Mexico, Citibanamex is a leader
in credit cards, with strong market
share, compelling value propositions,
including our reward programs
(ThankYou
®
Rewards and Premia),
and market-leading promotions such
as Buen Fin, which included more than
40,000 exclusive agreements with
retailers and businesses.
Retail Services
Citi Retail Services is one of North
America’s largest and most experienced
retail credit solution providers of
private label and co-brand credit cards
for retailers. The business serves 78
million customer accounts for iconic
brands, including Best Buy, Exxon, Mobil,
L.L.Bean, Macy’s, Sears, Shell, The Home
Depot and Tractor Supply Company.
In 2020, Citi Retail Services announced
private label and co-brand credit
card agreements with two exciting
The collaboration is the first of its kind
in the U.S., bringing together Citi’s
banking know-how with Google’s best-
in-class user experience and technology
to drive a stream of new services and
capabilities. It aligns seamlessly with our
U.S. Consumer Bank strategy, giving us
a platform to drive significant scale in
our Retail Bank by unlocking the power
of our respective ecosystems to deepen
our existing relationships and serve a
larger and new generation of customers.
The Citi Plex Account is Citi’s first-ever
bundled checking and savings account
solution. With extensive user experience
and account management features
powered by Google, the Citi Plex Account
is designed to integrate seamlessly
within Google Pay to deliver a richness
of insights and capabilities to empower
consumers with a simple, convenient and
personal banking experience.
We are excited about the possibilities
this collaboration creates for our clients
and feel a tremendous sense of pride in
helping to create a truly new and unique
way to bank nationwide.
10
In J.D. Power study,
Citibank ranked highest
among 17 major U.S. banks
for customer satisfaction
with retail banking advice
19
Citi retains top spot in
Greenwich Associates’
Global Fixed Income
Dealer rankings for fifth
consecutive year
27
Citi Asia Pacific wins
Digital Bank of the Year
from The Asset magazine
2
U.S.: Citi tops Affordable
Housing Lender Survey
MARCH
FEBRUARY
8

new partners — Meijer and Wayfair.
Meijer is a privately owned and family-
operated Midwestern retailer with
more than 250 supercenters and
grocery stores throughout the Midwest.
Wayfair is one of the world’s largest
online destinations for the home,
offering millions of items across home
furnishings, décor, home improvement,
housewares and more. Today, Citi is the
consumer credit card provider to half of
the top 10 U.S. ecommerce companies.
In 2020, Citi Retail Services generated
purchase sales of $78 billion and
ended the year with a loan portfolio
of $46 billion.
Retail Banking
With our high-tech, high-touch
relationship model, Citibank serves as
a trusted advisor to our retail, wealth
management and small business clients
at every stage of their financial journey.
Through Citi’s Access Account, Basic
Banking, Citi Priority, Citigold
®
and
Citigold Private Client, we offer an
array of products, services and digital
capabilities to clients across the full
spectrum of consumer banking
needs worldwide.
In the U.S., Citi continued to digitize our
retail bank model to drive national scale.
Citi Accelerate Savings and Citi Elevate
®
Checking, digital high-yield savings
and checking accounts for customers
outside Citi’s branch footprint, helped
drive robust digital deposit sales, while
Citi’s Access Account, a checkless
bank account with no or low monthly
fees, no overdraft fees and access to
Citi’s digital, retail and ATM channels,
continued to be one of our fastest-
growing products.
ENABLING PROGRESS: CITI LAUNCHES CHOSEN NAME FEATURE
ON BRANDED CREDIT CARDS
In October, Citi was
proud to announce
a new initiative
offering transgender
and non-binary
people the ability
to use their chosen
name on eligible credit cards. The launch, in conjunction
with Mastercard, provides eligible U.S. branded credit card
customers with the option to use their self-identified chosen
first name on credit cards.
With a recent survey by the National Center for Transgender Equality showing that
one-third of transgender people reported suffering harassment or denial of service
after showing ID with a name or gender marker that didn’t match their appearance,
the initiative is a step toward helping customers feel recognized, accepted and
empowered to be their true selves.
Today, eligible existing credit cardmembers are able to request new credit cards
that display their chosen name. Further, customers are able to be serviced by their
chosen name when they call into customer service and also across online and
mobile access points.
The response has been tremendous to date, with thousands of customers updating
their cards with their chosen first name and feedback from customers such as
the following: “I wish that there had been something like this when I began my
transition. This will remove one of the many worries that we all have had when we
were introducing our true selves to the world.”
And this initiative really is an extension of the bank’s ongoing commitment to the
LGBTQ+ community. Not only is Citi an active advocate for LGBTQ+ equality — most
recently signing an amicus brief urging the Supreme Court to prohibit workplace
discrimination on the basis of sexual orientation and gender identity in the U.S.
and a letter to the Prime Minister advocating for trans equality in the U.K. — but
we are committed to helping create an equitable and inclusive culture where we
all recognize and respect how our identity affects our experiences. Also, for 16
consecutive years, Citi has received a perfect score on the Human Rights Campaign
Foundation’s Corporate Equality Index, a national survey that benchmarks
corporate policies and practices for LGBTQ+ workplace equality.
6
Citi introduces fee
waivers, hardship
programs and small
business support for
U.S. customers impacted
by COVID-19
19
Citi Foundation
announces it will provide
$15 million to support
COVID-19-related relief
efforts globally
30
Citi hires women-owned
firms to lead distribution
of $4 billion Citi bond
issuance to commemorate
Women’s History Month
7
Citi expands assistance to
U.S. customers impacted
by COVID-19, broadening
assistance measures
to include credit card
payment deferrals and
additional fee waivers
APRIL
9

2020
Citi also gave consumers a sneak
preview of the Citi Plex Account by
Google Pay, a new digital checking
and savings account launching on
Google Pay in 2021, and announced
Mastercard as our network partner for
the account (see sidebar on page 8).
In the U.S., small business lending again
exceeded $10 billion in addition to more
than $3 billion administered through
the Small Business Administration’s
Paycheck Protection Program (see
sidebar on page 11), while in Mortgage,
the low rate environment drove strong
origination and refinancing activity. In
the U.S., Citibank, N.A. originated $24
billion in new loans in 2020.
Throughout the pandemic, Citi worked
tirelessly to ensure that customers and
small businesses felt confident that as
an essential service, we were available
to help them navigate this challenging
time. To educate customers on the ease
and convenience of digital banking,
Citi introduced education campaigns,
highlighting tools and capabilities
available for customers to self-service
as they complied with stay-at-home
orders. By providing customers with
quick links to set up online access,
shortcuts to key digital tools and how-
to videos on key features, we issued
a steady stream of communications
reinforcing the quick, easy nature of
digital banking. These communications
were incredibly well received by our
customers, and we saw significant
digital adoption and engagement
among clients. Since the onset of
COVID-19, the percentage of Retail Bank
accounts opened digitally has risen to
nearly 60% globally as has the use of
mobile check deposits in the U.S.
14
Citi announces virtual
summer internship
program and a full-time
offer for most interns
upon graduation
29
Citi releases first
Environmental, Social
and Governance report,
building upon its Global
Citizenship Report, which
has been published
annually since 2001
6
Global Finance names
Citi as one of the Best
Financial Innovation
Labs in 2020
8
Citi launches Global
Community Day
Reimagined campaign to
celebrate the 15th year
of its annual flagship
volunteer initiative
M AY
APRIL
In December, Citi opened its largest global wealth hub in Singapore. Designed to enhance a visitor’s
connectivity to nature, the Citi Wealth Hub embodies biophilic design and is LEED certified.
In Wealth Management, we continued to enhance our capabilities and invest in our
offerings and digital tools to meet a wider spectrum of customer needs.
In the U.S., we launched Citi Wealth Builder, an easy-to-use, low-cost digital
investment platform targeted to Citi Priority (emerging affluent) and Citigold
®
(affluent) clients, and introduced Citigold Private Client, a value proposition for
clients with a minimum of $1 million in assets under management. Together,
Citigold and Citigold Private Client clients enjoy personalized wealth management
services, including dedicated wealth teams, digital planning tools, fund access, and
a range of exclusive privileges, preferred pricing and benefits to affluent clients
around the globe.
In Asia, investment revenues were the highest in a decade, with record net new money
driven by steadfast client engagement, remote advisory services and accelerated
client adoption of digital platforms throughout the pandemic. We continued to
enhance the client experience, opening our largest wealth hub globally in Singapore
dedicated to Citigold and Citigold Private Client clients. With more than 30,000
square feet across four floors, the Citi Wealth Hub has over 30 client advisory rooms
for clients to engage with Relationship Managers, access a team of specialists, and
enjoy facilities for customized lifestyle events and investment seminars.
In Mexico, Citibanamex is one of the leading and historically significant financial
institutions in the country, with top brand recognition, leading market share and an
extensive retail branch network complemented by rapid digital and mobile user growth.
In 2020, in a first-of-its-kind partnership, Citibanamex teamed with PepsiCo
Alimentos Mexico and Amigo PAQ to advance financial inclusion by enabling
access to digital financial tools and lines of credit for shopkeepers to use the
CoDi
®
electronic payment platform, offered by Banco de México, in the Transfer
Citibanamex app. The partnership is poised to redefine the way in which collections
and payments are made in Mexico for small and medium-sized companies, which
represent about 50% of Mexico’s gross domestic product.
10

CITI SUPPORTS U.S. SMALL BUSINESSES THROUGH THE PANDEMIC
Through our participation
in the Small Business
Administration’s Paycheck
Protection Program, one of
the largest federal lending
programs in history, we are
proud to have served so
many of our small business customers where and when
they needed it most.
As a smaller lender to small businesses due to our light branch footprint, our
service model has been built on individual relationships, pairing our clients with
dedicated support from a tight-knit team of experts. Yet as the pandemic drove
small businesses across the country to close their doors almost overnight, we
wanted to do our part. That meant dramatically scaling up our capabilities to
ensure we were ready to support a government-led response. The effort involved
thousands of colleagues, from every area of the business, working around the clock
to design, build, test, launch, scale and serve to help small businesses that were
struggling to stay afloat. And as the data shows, we helped make a difference.
In 2020, Citi funded more than $3 billion in PPP loans to more than 30,000
businesses across the country that collectively employ more than 300,000 people.
These loans, along with more than 4.5 million loans disbursed by thousands of our
fellow lenders, have helped small businesses — the backbone of our economy —
retain or rehire employees who may have lost their job in this crisis as economic
activity slowed to contain the health crisis.
The makeup of Citi’s PPP loan portfolio demonstrates the great need that our small
business services customers had for this critical lifeline. Roughly 86% of Citi loans
in this Small Business Administration program went to small businesses in the
services sector, such as healthcare and professional services. With eight out of 10
U.S. jobs in services, the services sector is the lifeblood of the U.S. economy.
Services enable all economic sectors — from healthcare to manufacturing to
agriculture — to be more productive, reach more consumers, and, ultimately,
contribute to a better livelihood for Americans through job creation, higher
wages and greater opportunities.
Similarly, Citi’s PPP loans were
concentrated in the markets where
we have a branch footprint, including
a high volume of loans in California,
Florida, Illinois and New York, which
were some of the states suffering
most from the economic fallout. In
fact, Citi’s top sectors served — again
based on total number of employees
at the businesses that received loans
— mirrored the hardest-hit sectors in
the states where we funded the most
loans. The correlation between where
we made loans and the hardest-hit
sectors occurred across each state
where we had a significant number
of PPP loans.
At its core, banking is about people
and our dedication to enabling them
to grow. Behind the numbers and
statistics, there are stories — many of
them moving — about the small business
owners struggling to navigate a health
and economic crisis unlike any we have
seen before. To tell them, we created a
video series with stories that span the
country, found on the Citi Blog under
“A Moving Year in Moving Pictures:
A Small Business Video Series.”
“When I reflect on the year,” said
David Chubak, Head of U.S. Retail
Banking, “our all-out effort to support
the Small Business Administration’s
PPP across the firm was one of the
most meaningful highlights.”
11
Citi announces inaugural
U.S. dollar-denominated
benchmark green bond
issuance
13
Digital Onboarding for
Citi’s Institutional Clients
expanded to 37 countries
in all regions
20
Citi announces
partnership with minority-
owned depository
institutions to purchase
Paycheck Protection
Program loans
2
Citi and leading
international companies
launch Restarting
Together, an initiative
to boost recovery after
COVID-19
JUNE
11

2020
The Institutional Clients Group strives to be
the best banking partner for our clients by
offering a broad spectrum of wholesale banking
products and services, driven by our unique
global footprint. Working together, we provide
innovative solutions to corporations, financial
institutions, public sector entities, investment
managers and ultra-high net worth clients.
Our network-driven strategy allows us to service those clients who value our
unmatched country presence and who require a financial services partner
that can help them grow in any country where they do business. This includes
multinationals that are expanding globally, particularly in the emerging
markets, and emerging markets companies that are growing beyond their
home market or region.
With a physical presence in 96 countries, local trading desks in 77 markets
and a custody network in 63 markets, we facilitate approximately $4 trillion
in financial flows daily. We support 90% of Global Fortune 500 companies in
their daily operations, helping them to hire, grow and succeed.
Citi’s Institutional Clients Group is uniquely positioned to take advantage of
important, evolving global trends, including environmental, social and corporate
governance (ESG), fintech, wellness and mobility. Our unmatched global
footprint and innovative product set allow us to deliver responsible, objective
advice and provide stellar execution to lead transformation for our clients.
Banking, Capital Markets and Advisory
Banking, Capital Markets and Advisory listens, collaborates and problem
solves, working tirelessly on behalf of our corporate, financial institution,
public sector and sponsor clients to deliver a range of strategic corporate
finance and advisory solutions that meet their needs, no matter how complex.
Dedicating ourselves to these
relationships and ensuring our
client experience stands above all
else, we leverage the breadth of our
unmatched global network to provide
debt capital raising, equity-related
strategic financing, and merger and
acquisition solutions, as well as issuer
services. By serving these companies,
we help them grow, creating jobs
and economic value at home and in
communities worldwide.
Following the market dislocation last
spring, Citi was integral in reopening
both the debt and equity markets,
leading on several large transactions.
In 2020, Citi led, as a bookrunning
manager, over half of the record
$1.7 trillion investment grade and
$435 billion high-yield issuance
volume. The issuance environment
was very dynamic, with a rush to
source liquidity during the first three
months of the pandemic, turning to
a more opportunistic and acquisition
financing environment as the year
progressed with markets steadily
improving and ultimately rallying by
year end. Citi was an early leader,
providing significant balance sheet
support for clients and guiding
issuers that raised record amounts of
liquidity from fixed income investors
at the peak of the pandemic. As
markets improved, Citi helped
countless clients achieve record-low
coupons. Citi served as a bookrunner
on a number of landmark investment
grade financings, including raising
$25 billion in April for Boeing, $8.5
billion in March and $9.5 billion in
April for ExxonMobil, $4.1 billion
Institutional Clients Group
4
Citi launches Strategic
Advisory Solutions Group,
harnessing and scaling
data insights across the
Investment Bank
16
Citi ranked #2 on 3BL
Media’s annual list of 100
Best Corporate Citizens
25
Citi named Best
Bank for High-Net-
Worth Families by
Kiplinger for fourth
consecutive year
29
Citi and the Citi
Foundation reach more
than $100 million in
commitments for
COVID-19 community
relief and economic
recovery efforts
JUNE
12

and €2.6 billion in September for
Coca-Cola, and $8.9 billion secured
financing in June for PG&E. Citi
advised and executed on behalf of
COVID-19-affected and opportunistic
high-yield clients, including $8 billion
in April for Ford, $4.7 billion in June
for American Airlines, $2.0 billion
in June for Occidental Petroleum
and $2.8 billion in December for
Community Health.
In equity capital markets, historic
volatility drove waves of equity
issuance. Citi served as underwriter on
a number of successful initial public
offerings (IPO) in 2020, including
Snowflake’s $3.4 billion offering in
September and Royalty Pharma’s
$2.2 billion IPO in June. We saw record
issuance particularly in the special
purpose acquisition company (SPAC)
space, with nearly $100 billion issued
in 2020. Most notably among 2020
SPACs was the $4.0 billion blank check
company sponsored by Pershing Square
Capital Management whereby Citi
served as left lead on the transaction.
In addition to being the largest SPAC
raised globally, the transaction garnered
significant praise for the use of minority
broker-dealers as co-leads on the
deal. Citi was left lead underwriter for
both Dragoneer SPAC offerings for a
combined total of $966 million and sole
underwriter for the first ESG-linked
SPAC in May. Citi was also selected as
left lead for Shopify’s two secondary
equity offerings, including its $1.5 billion
follow-on offering in May, representing
the largest internet overnight follow-on
to date.
Citi’s Global Mergers & Acquisitions
Group advised on landmark
transactions signed and negotiated
during the peak of the COVID-19
crisis, demonstrating how our clients
turn to us to provide trusted advice
and to offer innovative strategic
solutions. Citi advised Unilever on
its transformational restructuring
to create a simpler company with
greater strategic flexibility and better
positioning for future success. This
transaction removes complexity and
strengthens corporate governance by
uniting its dual UK PLC and Dutch N.V.
legal and listing structure resulting in
a single parent company: Unilever PLC,
Citi acted as sole global coordinator and bookrunner on UEP Penonomé II’s inaugural
$262.7 million 144A/Reg S Green Notes offering in December, which refinanced initial
construction financing for InterEnergy Group’s 215-megawatt UEP Penonomé II wind project
and its 40-megawatt Tecnisol solar project in Panama. The financing represents the first
international green bond by a renewables portfolio under a project finance structure in
Latin America, as well as the first private sector green bond in Central America and the
Caribbean. The Notes’ unique structure successfully monetized a five-year merchant
tail post expiry of the power purchase agreements, thereby optimizing the projects’
capital structure and operational flexibility, supported by their priority of dispatch as
non-conventional renewables. Combined, UEP Penonomé II and Tecnisol are the largest
non-conventional renewable energy producers in Panama and one of the largest diversified
clean power companies in Central America.
which will have a market capitalization
of approximately £110 billion. Citi was
sole financial advisor to Telefónica on
its joint venture with Liberty Global
for its U.K. businesses (O2 and Virgin
Media), valued at $38 billion. Citi
served as a financial advisor to S&P
Global on its announced merger with
IHS Markit, an all-stock transaction
implying an enterprise value for IHS
Markit of $44 billion. This was one
of the largest transactions of 2020,
bringing together two world-class
organizations with unique and highly
complementary products and cutting-
edge innovation and technology.
JULY
1
IFC, Citi create
$800 million facility
to boost trade finance
in emerging markets
13
Citi announces alliance
with BlackRock to
enhance securities
services for mutual clients;
Citibanamex and BlackRock
soon launch sustainable
investment strategy
15
Citi named Euromoney’s
Best Bank for Corporate
Responsibility in
North America
20
Citi earns the regional
Euromoney Awards for
Excellence in Africa,
Asia Pacific, Latin America
and North America
13

2020
Citi closed a unique financing for 833 Bryant, a project designed to help confront the growing
problem of homelessness. 833 Bryant Avenue will comprise 145 new permanent supportive
affordable housing units in San Francisco to be built at a lower cost and on a faster delivery
schedule than similar projects in the past. Citi played multiple roles in the effort: Low Income
Housing Tax Credit investor; construction loan administrator; and Letter of Credit provider
guaranteeing construction completion. In a departure from a typical 4% affordable housing
project financing, we also structured and secured a rating for the tax-exempt private activity
bonds that were publicly sold in the municipal bond market. The project is using modular
construction, with units being built at Factory_OS in Vallejo, California, a new company
in which Citi is an investor. Supportive services for the residents include intensive case
management with ongoing, consistent tenant engagement that includes individualized health
and wellness plans, eviction prevention, crisis intervention and on-site mental health services.
(Photo credit: David Baker Architects)
Citi Public Sector Group worked
closely with governments and
the public sector to find liquidity
alternatives and advised on
the issuance of social bonds to
support countries in the emerging
markets throughout the pandemic.
In November, we announced our
selection as financial advisor to
Gavi, the Vaccine Alliance, for its
COVAX Facility. In this capacity, a
team consisting of more than two
dozen senior bankers across multiple
business units, spearheaded by the
Public Sector Group, is providing
Gavi with expert advice on structures
to mitigate sovereign, credit and
operational risk as the COVAX Facility
seeks to facilitate pooled procurement
and equitable distribution of safe and
effective COVID-19 vaccines globally.
In addition, drawing on Citi’s global
reach with physical presence in nearly
100 countries and territories and the
capability to serve nearly 60 additional
countries, Citi’s Corporate Bank
served as a critical partner to large
multinationals in COVID-19-affected
industries throughout 2020, providing
new lines of credit and shoring up
balance sheets for many blue chip
corporations. In 2020, Citi syndicated
500+ loans with volumes in excess of
$895 billion.
Commercial Bank
Citi Commercial Bank puts 200
years of experience to work for mid-
sized, globally oriented companies
by delivering actionable insights
and ideas, comprehensive banking
solutions and a truly global network.
We provide high-quality financial advice, helping businesses prosper and grow in
domestic markets, as well as internationally. Our distinctive approach puts the
client at the center of everything we do. By understanding their industries and
learning their business priorities, our Relationship Managers bring our clients
insights designed to help them succeed. Whether providing capital to fund growth
or refinancing debt, Citi Commercial Bank offers solutions that support the right
capital structure to meet companies’ short- and long-term financing needs. With
the full spectrum of Citi’s capabilities and access to our global network, we are able
to deliver tailored solutions to meet our clients’ unique goals and objectives.
29
Citi announces new 2025
Sustainable Progress
Strategy, including a
$250 Billion Environmental
Finance Goal, to accelerate
the low-carbon transition
and reduce climate risk
29
Citi named as one of
Fast Company’s Best
Workplaces for Innovators
20
Citi Asia Pacific leads in
Global Finance’s 2020
World’s Best Digital Bank
Awards; Citibanamex
named Mexico’s Best
Digital Bank
1
Global Finance names
Citi Best Corporate/
Institutional Digital Bank
in 14 Latin American
countries
JULY AUGUST SEPTEMBER
14

In the past year, Citi Commercial Bank
enhanced our core client and internal
applications and significantly improved
our processes, reducing client friction
and digitizing more of the client
experience. We continue our digital
transformation with the redesign and
expansion of CitiBusiness
®
Online
features and a new Gateway portal in
the U.S. for account onboarding, Know
Your Customer and product setup
activities and continued to build a
world-class experience by facilitating
a fully digital onboarding journey
through Gateway and CitiDirect BE
®
Digital Onboarding.
Citi Commercial Bank worked together
with the Global Consumer Bank in
the U.S. to support clients adversely
affected by the COVID-19 pandemic by
providing loans and participating in
the PPP programs administered by the
U.S. government. We also participated
in a number of other government-
supported programs outside the U.S.
and developed solutions to assist
clients in need throughout the crisis.
Markets and Securities
Services
Markets and Securities Services relies
on global breadth and product depth to
provide an enhanced client experience.
Our sales and trading, distribution
and research capabilities span a broad
range of asset classes, providing
customized solutions that support the
diverse investment and transaction
strategies of investors.
In 2020, Citi retained our ranking as the
World’s Largest Fixed Income Dealer
for the fifth straight year, according
to Greenwich Associates’ Annual
Benchmark Survey, which polled more
than 3,500 fixed income investors
around the world. Citi’s leading market
position is driven by our strength in
both Rates and Emerging Markets,
ranked #1, respectively, along with the
top spot in Municipal Bonds. In addition
to the distinction of being overall
share leader, Citi ranked #1 in Overall
Quality, Sales Quality, Trading Quality
and e-Trading market penetration. Citi
was also named Largest Affordable
Housing Lender in the country for the
11th year in a row in Affordable Housing
Finance magazine’s annual survey of
affordable housing lenders. Partnering
with developers, nonprofits and local
governments, Citi has helped create or
preserve nearly 488,000 affordable
housing units over the past decade.
In 2020, Citi Community Capital, the
bank unit through which Citi works to
finance all types of affordable housing
and community development projects,
reported more than $7 billion of
lending to finance affordable rental
housing projects.
Citi Velocity
®
, Citi’s #1 ranked digital
content platform for Institutional
Clients, delivers electronic access
to Citi’s capital markets services
across equities, futures, FX, emerging
markets, rates, credit, commodities,
securitized products, municipals,
securities services and research
spanning thousands of content
creators and apps. Nearly 100,000
Institutional Clients spread over
almost 150 countries use Citi Velocity
on a regular basis across all asset
classes. 2020 was the Citi Velocity
platform’s strongest year since its
2011 launch. In addition to pricing
millions of derivative instruments
and supporting half a billion data
interactions, Citi Velocity made a big
push into the audiovisual content
and mobile space. We hosted 1,850
webcasts that were attended by more
than 100,000 clients, an increase of
200% year-over-year. We produced
over 3,100 videos and podcasts, 28%
more than in prior years. The platform
saw mobile growth soar 57%, while
the number of unique client users
grew 9%. While Citi Velocity was laser
focused on being the best digital
product for our clients, it was also used
to offer clients and colleagues some
respite from the year’s events. Citi
Velocity streamed two concert series in
2020, in partnership with the London
Philharmonia, which became the most
popular video content of the year.
In May 2020, Proxymity, a digital
investor communications platform
developed within Citi’s Institutional
Clients Group, was spun off into
a standalone entity that raised
$20.5 million in a strategic round
of investment led by Citi Ventures,
with participation from a global
industry consortium. Proxymity’s
services include a digital, real-time
and fully transparent proxy voting
platform, providing post-meeting vote
confirmation and giving investors up
to nine additional days per meeting
to research and vote. Proxymity
also offers a shareholder disclosure
platform that automates shareholder
ID requests and eliminates the need
for any manual handling. The idea for
2
Citi becomes first
American bank and first
among world’s top five
custodians to be awarded
domestic fund custody
license in China
10
CEO Michael Corbat
announces plans to retire
in February; Board of
Directors selects Jane
Fraser to succeed him
as CEO
11
Citi Retail Services and
Wayfair announce new
strategic partnership with
launch of private label and
co-brand credit cards
17
Citi and Citi Foundation
expand global job
skills-building initiative
Pathways to Progress to
improve employability and
economic opportunity for
underserved communities
15

2020
Proxymity was formulated in 2017 by
two Markets and Securities Services
colleagues as a way for issuers to
better communicate with investors.
As the idea for the platform evolved,
D10X, an internal strategic growth
model that enables employees to take
new business ideas from concept to
launch, helped Proxymity iterate and
evaluate its vision to improve the proxy
voting system. From there, the Citi
Innovation Lab in Tel Aviv developed
Proxymity into a market-ready
offering in less than two years using
a Lean team model and rapid, agile
development. Citi is incredibly proud
of what Proxymity has been able to
achieve thus far and looks forward to
continuing to support the platform as a
member of the consortium.
In 2020, Citi entered into an alliance
with BlackRock, through its Aladdin
®
business, to enhance the delivery of
securities services to Citi’s clients
who use the Aladdin end-to-end
investment management platform.
Connecting to Aladdin Provider,
Citi will provide outsourced middle-
office services directly on a client’s
instance of Aladdin for seamless
integration with the front office,
from trade confirmation to post-
settlement reconciliation. This
agreement expands Citi’s relationship
with BlackRock, to whom we provide
custody, accounting and/or fiduciary
services for certain BlackRock funds
domiciled in Hong Kong, Mexico
and Colombia. In addition to funds
managed by BlackRock, Citi provides
custody services to many asset
managers on the Aladdin platform.
Joining the Aladdin Provider network
will allow Citi to optimize our operating model to support not only BlackRock’s
asset management business but to provide an enhanced level of service to
members of the broader Aladdin community.
Private Bank
The Private Bank is dedicated to helping the world’s wealthiest individuals, families
and law firms protect and responsibly grow their wealth.
From 50 locations worldwide, we serve more than 13,000 ultra-high net worth
clients hailing from over 100 countries, including 25% of the world’s billionaires
and more than 1,400 family offices. In 2020, total client business amounted to
around $550 billion.
Our unique business model enables us to focus on fewer, larger and more
sophisticated clients with an average net worth above $100 million. Clients enjoy a
highly customized experience, with access to a comprehensive range of products
and services spanning investments, banking, lending, custody, wealth planning, real
estate, art, aircraft finance and lending, and more.
In everything we do, we emphasize personalized advice, competitive pricing and
efficient execution. Citi Private Bank’s close partnership with Citi’s Institutional
Clients Group means we can connect clients’ businesses to banking, capital markets
and advisory services, as well as to Citi’s other institutional resources.
A growing number of our clients seek to align their investments with their personal
values. Investing with Purpose is what we call our approach to sustainable and
impactful investing. We help clients articulate their sustainability goals and
objectives, provide them with comprehensive advice and offer in-house investment
management that incorporates environmental, social and corporate governance
principles. We also partner with third-party asset managers to deliver relevant
themes and strategies.
In 2020, we transformed our flagship annual Family Office Leadership Program —
often described by participants as “the Davos for family offices” — into a virtual
summit. Sessions this year covered vital topics that include sustainable investing,
advances in family healthcare practices, future of energy and the building of
resilient families. Nearly 6,000 participants from 100+ countries took part in
the program.
We also launched the Direct Private Investments business to identify opportunities
for family offices and private investment company clients to actively invest in
direct private deals.
Treasury and Trade Solutions
Treasury and Trade Solutions (TTS) provides integrated cash management, working
capital and trade finance solutions to multinational corporations, financial institutions
and public sector organizations around the globe. With the industry’s most
comprehensive suite of digitally enabled platforms, tools and analytics, TTS leads the
18
New Citi Impact Fund
announces first four
investments in double
bottom-line companies
23
Citi launches Action for
Racial Equity with more
than $1 billion in strategic
initiatives to help close
racial wealth gap
23
At the 2020 GlobalCapital
Derivatives Awards, Citi
awarded House of the
Year for Global Derivatives,
Global FX Derivatives
and Global Research &
Strategy
29
With plans to double
market share in
Singapore’s wealth
segment, Citi announces
the opening of its largest
wealth hub globally
in Singapore
SEPTEMBER
16

way in delivering innovative and tailored
solutions to clients. Based on the belief
that client experience is the driver of
sustainable differentiation, TTS has
focused its efforts on transforming its
business to deliver a seamless, end-to-
end client experience through digital
capabilities, client advocacy, network
management and service delivery
across the entire organization.
Our digital transformation accelerated
in 2020 with increased momentum in
client engagement and digital adoption
as evidenced by strong growth in
CitiDirect BE
®
users, API volumes
and digital account openings. Digital
Onboarding is now live in 50 countries,
and CitiDirect BE users were up 9%
versus the prior year. Additionally, we
delivered to the market 83 live APIs
that collectively reached 1 billion API
calls since inception.
Citi’s digital channels remain pivotal
in helping clients with operational
resiliency while continuing to operate
in remote or continuity-of-business
modes. Digital Onboarding enabled
clients around the world to set up
accounts using eSignatures and
overcome major obstacles due to
the pandemic.
With Instant Payments becoming a
new norm, enabling our clients to
disrupt their business model and shift
toward a 24/7, always-on environment,
we continue to invest in building a
globally consistent Instant Payments
proposition, having launched the
capability in six additional markets in
2020, taking our global presence to 26
markets. Our global volumes have seen
a growth of more than 70% year-over-
29
Citi’s partnership with
United Nations Development
Programme strengthens
across Asia, aiding the most
vulnerable and marginalized
communities across
the region
1
Citi hosts second
symposium for students
attending Historically
Black Colleges and
Universities
6
Citi recognized as Best
Corporate Bank by Global
Finance magazine
14
Citi becomes the only
U.S. bank named to The
Wall Street Journal’s
inaugural list of the 100
Most Sustainably Managed
Companies in the World
year and are rapidly approaching the
million daily transaction mark. With
an ambitious road map to continue to
expand our footprint and capabilities,
we are very well positioned for another
exciting and successful year in 2021.
In October 2020, in support of U.S.-
based suppliers affected by COVID-19,
we worked with the U.S. EXIM Bank
to create facilities, including the
guarantee of a $500 million facility
by EXIM that allows Citi to finance
accounts receivable from The Boeing
Company to its U.S.-based suppliers.
The agreement also includes the
preliminary approval of a $327 million
facility for the purchase of Boeing
aircraft by Copa Airlines, exported
from Renton, Washington.
In 2020, as part of an effort to help to accelerate the global economic recovery, Citi joined
CEMEX, Telefónica and 11 other companies and academic institutions to launch Restarting
Together, a challenge that invited startups and small and medium-sized enterprises from across
the world to find innovative projects to revamp our economies, enhance our cities and move
society forward in response to the COVID-19 pandemic. The initiative was designed to contribute
to a fast economic recovery and to create a more resilient society, as well as to reduce
structural societal inequalities exacerbated by such crises.
More than 500 startups from 59 countries entered the challenge, and three winners were
provided the opportunity to access mentoring and events, technology tools and acceleration
services from the companies, including Citi, which supported the challenge. Restarting Together
is an excellent representation of Citi’s ongoing commitment to our mission of enabling growth
and economic progress, as we seek to find new ways to solve problems.
OCTOBER
17

2020
Environmental, Social
and Governance
Through our business, we address some of
society’s greatest challenges — an imperative
stated in our mission and an idea that shapes
our decisions every day. The need for action
grew in urgency and scope in 2020 with
the onset of the COVID-19 pandemic and a
movement toward racial equity and systemic
change in the U.S.
This section highlights our continued efforts as a bank, an employer and a
philanthropist to address these societal issues and many others. Citi has the
scale and capability to finance and support the institutions — governments,
corporations, nonprofits and aid organizations — that can contribute to the
future that we want and the future that our communities deserve.
In the midst of the global pandemic, we launched our new 2025 Sustainable
Progress Strategy to address another global crisis: climate change. Our
new strategy, which had been in the works well before COVID-19 began its
catastrophic spread, is aimed at driving the transition to a sustainable, low-
carbon future in an environmentally responsible way that serves society’s
economic needs. COVID-19 became an accelerant for our work, illustrating
the deep interconnections of systemic racism and societal, physical and
environmental health.
Once a niche topic for investors, Environmental, Social and Governance (ESG)
performance today is an essential part of our firm-wide strategy — deeply
integrated into our business — and we continue to evolve our approach to
managing ESG issues and opportunities.
Sustainable Growth and
Climate Change
The climate crisis is one of the most
critical challenges facing our global
society and economy. The science is
irrefutable, and the world’s climate
scientists agree that urgent action must
be taken to address the current and
potential impacts of climate change.
Since the onset of COVID-19, we
have been continually reminded of
the inextricable links between our
health, economic success and the
environment. Amid the pandemic,
we launched our 2025 Sustainable
Progress Strategy to accelerate
our work in addressing the climate
crisis, with the ambition to play a
leading role in driving the transition
to a low-carbon economy. As a global
financial institution, we recognize the
opportunity and obligation to drive
capital to where it can have the most
positive impact.
The core of our new five-year
strategy consists of a commitment to
finance and facilitate $250 billion in
environmental projects and activities.
This is an ambitious target that
represents a commitment two-and-a-
half times larger than our prior goal,
and which we aim to achieve in half
the time. To support our $250 billion
goal, we are financing activities in
renewable energy, clean technology,
water quality and conservation,
sustainable transportation, green
buildings and energy efficiency and
have added circular economy and
sustainable agriculture and land use as
two additional areas under this goal.
14
Citi ranked #31 on Just
Capital and Forbes’ annual
list of America’s JUST
100 companies
19
Citi launches True Name
feature with Mastercard
across the U.S., offering
transgender and non-
binary people the ability to
use their chosen first name
on eligible credit cards
26
Citibanamex, PepsiCo
and Amigo PAQ expand
digital financial inclusion
for underbanked retailers
through CoDi
®
30
Citi announces
inaugural $2.5 billion
affordable housing bond
issuance, the largest-ever
social bond
OCTOBER
18

We will continue to focus on helping
our clients across all sectors in their
transition, no matter where they are in
their sustainability journey, to shift to
more sustainable business models and
practices that will advance our progress
toward a low-carbon economy.
Another key aspect of enabling this
transition is measuring, managing
and reducing the climate risk and
impact of our client portfolio, which
is a key pillar of our 2025 Sustainable
Progress Strategy. Citi has been a
leader in climate assessment and
disclosure in alignment with the Task
Force on Climate-related Financial
Disclosures recommendations and
released our second comprehensive
report in December 2020 detailing our
progress. In addition to embedding
this work across Citi, we’re continuing
to focus on industry collaboration
to adopt new methodologies and
analyze the climate risk associated
with our client portfolio, such as the
Paris Agreement Capital Transition
Assessment and the Partnership for
Carbon Accounting Financials.
Our new strategy also builds on our
20 years of experience measuring and
reducing the environmental footprint
of our own facilities and operations.
As of the end of 2020, we achieved
our goal of sourcing 100% renewable
electricity to power our facilities
globally, along with our third set of
operational footprint goals. Looking
ahead, we’ve launched our next set
of goals focused on greenhouse gas
emissions, energy, water and waste
reduction targets and sustainable
building solutions.
For more information on our
sustainability efforts, please visit
citi.com/citi/sustainability.
Financial Inclusion and
Access to Capital
The past year has brought to the
forefront the long-standing social,
economic and racial inequities that
have faced our communities. As a
financial institution with a long history
of commitments to support resilient
and inclusive communities, we
challenged ourselves to look at how
we can do things differently.
Since the onset of COVID-19, we have
been adjusting our approach to meet
the immediate needs and challenges
posed by the health crisis while
staying focused on our longer-term
strategic initiatives of increasing
affordable housing, boosting minority-
and women-owned businesses, and
expanding financial inclusion globally.
By the end of 2020, Citi and Citi
Foundation had committed more than
$100 million in support of COVID-19-
related community relief and economic
recovery efforts globally. Funding was
provided to support our most affected
communities around the world, from
food donations and housing stability
loans to personal protective equipment
and COVID-19 screening efforts. Our
efforts were complemented by more
than $2 million in contributions from
our colleagues, which was matched
by Citi for an additional $2 million
2
Citi selected as financial
advisor to Gavi, the
Vaccine Alliance’s
multibillion dollar
COVAX Facility
6
At the PWM/The Banker
Awards, Citi named Best
Private Bank for Customer
Service, for Global Families
and Family Offices, and for
Business Continuity Plans
(COVID-19)
9
Citi virtually hosts 10th
annual Veterans on Wall
Street Symposium
18
Citi unveils sneak
preview of Citi
®
Plex
TM
Account by Google Pay;
selects Mastercard as
network partner
Citi continues to be a leader in project finance, financing a number of infrastructure and
renewable energy transactions. Citi acted as a mandated lead arranger for a $704 million
financing package to develop the Highlander Solar Facility
*
in Spotsylvania County, Virginia.
The Highlander Solar Facility was developed by sPower, which merged with AES’ clean energy
business in early 2021. When completed, it will be the largest solar project in the eastern U.S.,
totaling 485 megawatts of power with alternating current of renewable power. Highlander
Solar is strategically located approximately 50 miles from northern Virginia’s Data Center
Alley in the Dulles Technology Corridor, home to the world’s largest concentration of data
centers. Renewable energy generated by the facility will help blue chip technology companies,
including Microsoft and Apple, with the significant electric load requirements of their data
centers while advancing their corporate sustainability and climate change goals.
*
The Highlander Solar Facility is also known as Spotsylvania Solar Energy Center.
NOVEMBER
19

2020
through an employee donation program. Recognizing the disproportionate impact
that COVID-19 has had on low-income communities and communities of color, Citi
announced it would donate net profits from our participation in the U.S. Small
Business Administration’s Paycheck Protection Program to the Citi Foundation.
The Foundation deployed $25 million of these proceeds to Community
Development Financial Institutions across the U.S. to support small businesses
and economically vulnerable households impacted by the pandemic. In 2021, the
Foundation announced an additional $25 million investment to support small
businesses owned by people of color.
As calls for racial justice intensified across the U.S., Citi launched Action for Racial
Equity — a firm-wide commitment that includes more than $1 billion in strategic
initiatives to help close the racial wealth gap and increase economic mobility. This
initiative was launched in tandem with the release of a new Citi Global Perspectives
& Solutions report, which showed that if the U.S. had closed critical racial gaps
for Black Americans in wages, housing, education and investment 20 years ago,
$16 trillion could have been added to the U.S. economy. To help close these
gaps, we are focusing on providing greater access to banking and credit in
communities of color, increasing investment in Black-owned businesses, expanding
homeownership among Black Americans and advancing anti-racist practices in the
financial services industry. Action for Racial Equity represents an unprecedented
effort to leverage Citi’s core business capabilities and the Citi Foundation’s
philanthropic efforts to change the way we operate and drive systemic change.
As part of our racial equity efforts,
we allocated an additional $50 million
to the Citi Impact Fund to exclusively
support Black entrepreneurs. Since
launching in early 2020, the Impact
Fund has made investments in 11
companies — the majority of which
were founded by women and/or people
of color — that are addressing some of
society’s biggest challenges.
Since 2007, Citi provided more than
$1 billion in financial inclusion lending
and supported nearly 4 million
unbanked and underbanked small
businesses in emerging markets,
3.5 million of which are owned by
female entrepreneurs. Last year, we
completed two transactions under
Scaling Enterprise, a partnership
launched with the U.S. International
Development Finance Corporation and
the Ford Foundation in 2019, through
which we provide early-stage financing
to companies that expand access to
products and services for low-income
individuals in emerging markets. For
example, Citi disbursed a working
capital facility to support Gradian
Health Systems, a medical technology
company that provides critical
equipment to underserved hospitals
and clinics across Africa.
Furthering the Citi Foundation’s
commitment to address youth
unemployment, a persistent global
issue exacerbated by the economic
impacts of COVID-19, the Foundation
expanded its Pathways to Progress
job skills-building initiative in 2020.
19
Global Finance names
Citi World’s Best Foreign
Exchange Bank and
recognizes Citi Latin
America among inaugural
Crisis Leadership program
for its pandemic response
19
Citi Foundation provides
$15 million in support
to 30 Community
Development Financial
Institutions across
the U.S.
2
Citi named World’s Best
Digital Bank 2020 by
Global Finance magazine
3
Citi ranked ninth overall
and first in the financial
sector among Newsweek’s
list of America’s Most
Responsible Companies
NOVEMBER DECEMBER
20

Talent and Diversity
Four years ago, Citi was the first bank to disclose our adjusted pay results, and the
following year we became one of the first companies to disclose our unadjusted
or “raw” pay gap for both women and U.S. minorities. Our commitment to that
transparency continues today.
These disclosures hold us accountable for the progress we want to make in being
a diverse and inclusive company. They also send an important signal to our
colleagues, clients and partners about how we are continuously working to get this
right. We looked at both numbers again this year and found that, on an adjusted
basis, women globally are paid on average more than 99% of what men are paid at
Citi and that there is no statistically significant difference in adjusted compensation
for U.S. minorities and non-minorities. Following our review, we made appropriate
pay adjustments as part of this year’s compensation cycle.
This year’s raw gap analysis showed that the median pay for women globally is
better than 74% of the median for men, up from 73% last year and 71% in 2018
and that the median pay for U.S. minorities is just under 94% of the median for
non-minorities, which is similar to last year and up from 93% in 2018. Continuing
to reduce our raw pay gap requires that we make progress on our representation
goals — to increase representation at the Assistant Vice President (AVP) through
Managing Director levels to at least 40% for women globally and 8% for Black
employees in the U.S. by the end of 2021 — which we are committed to doing.
For our part, we’re continuing to
innovate how we recruit and develop
talent and use data more effectively
to help us increase diversity at more
senior levels at Citi. We recently
launched a firm-wide exercise where
our 200+ leaders with representation
goals on their scorecards are using
data to understand where they have
representation gaps in their hiring,
promotions and retention. Diverse
slates have been a critical component
of our work. In 2021, we expanded
our slate practice from at least one
to at least two women or minorities
in our interviews for U.S. hires and at
least two women in our interviews for
global hires.
We are expanding our group coaching
program, Owning My Success, for top
and emerging Black talent this year,
extending the program from three to
six months and offering it to all levels,
including the Officer and AVP levels
for the first time. In the first two years
of the program, 150 Black colleagues
have been a part of the program,
participating in coaching and discussion
on topics such as developing one’s
personal brand, networking and taking
career risks. As part of the program,
participants’ managers engage in
group coaching to help them support
their Black direct reports and better
understand their experiences.
Our philosophy is that every member
of Citi’s team is responsible for this
progress in making Citi an even more
inclusive and equitable workplace.
We have made it a priority to foster a culture of
inclusion where the best people want to work,
where people are promoted on their merits, where
we value and demand respect for others, and where
opportunities to develop are widely available to all.
3
Citi Markets and
Securities Services
donates $9.4 million
to education-focused
nonprofit organizations,
part of annual e for
education campaign
16
Citi Asia Pacific sets
record for net new
money in its Wealth
Management business
17
Citi releases climate
disclosure report showing
progress in implementing
the recommendations
of the Task Force on
Climate-related Financial
Disclosures
21
Citi launches first lending
API partnership with Grab,
Southeast Asia’s leading
super app
Pathways to Progress aims to equip young people, particularly those from
underserved communities, with the skills and resources they need to succeed in a
rapidly changing economy. In addition, the expanded initiative includes a company-
wide commitment to provide 10,000 young adults with the opportunity to gain
work experience at Citi and engage 10,000 Citi colleagues to volunteer their time
and talent to serve as mentors, coaches and role models.
21

© 2021 Citigroup Inc. Citi and Citi with Arc Design
are registered service marks of Citigroup Inc.
OUR ACTIONS SPEAK LOUDER
THAN THESE WORDS.
Citi has a long-standing commitment to closing the racial wealth gap,
and now with Action for Racial Equity, we have launched more than
$1 billion in strategic initiatives to accelerate those efforts across our lines
of business. These efforts will provide greater access to banking and credit
in communities of color, increase investment in Black-owned businesses, expand
homeownership among Black Americans and advance anti-racist practices in the
financial services industry. That way communities of color can build a stronger
economic presence and progress toward a future that we can all believe in.
Learn more about Citi’s Action for Racial Equity at
Citi.com/racialequity
Proofed @
None
ROUND
#:
Proof
Stock:
Date
OK
Camilla Ciappina
WC
PDFx1a
4CP
CLIENT:
CITIBANK
VENDOR:
PRODIGIOUS in NY
B1111-019595-00
COR 019595 RACIAL EQUITY
ANNUAL REPORT.indd
4700353135
Magazine
2021
9-10-2020 2:55 PM
2-19-2021 11:10 AM
Annual Report
RACIAL EQUITY
macOS HD:Users:francione:Desktop:COR 019595:COR 019595 RACIAL
EQUITY ANNUAL REPORT.indd
None
Rich Look
Rich Look
Jorge Rivadeneyra
None
Camilo Francione
300 DPI
300 DPI
COR 019595 RACIAL EQUITY ANNUAL REPORT.indd
Epson 133 SWOP
2.0
Name
STUDIO#:
8.625" x 11.125"
8.375" x 10.875"
7" x 10"
1" : 1"
Agency Job #:
PO #:
File Name:
Media Type:
Issue Date:
Creation Date:
Last Modified:
Publications:
Job Desc:
File Location:
S-0002751.1
Bleed: Art Director:
Copy Writer:
Traffic:
Production:
Account
Manager:
Project
Manager:
Proofread-
er:
Studio:
AE OK Rel:
Notes:
Trim:
Live:
Scale Ratio:
Layout DPI:
Effective DPI:
Deliverable:
Colors:
APP: 2020
Spot Color:
FONTS: Interstate (Extra
Light Italic, Light, Bold;
OpenType)
Interstate Condensed
(Light; OpenType)
LINKS: None
None
S:7"
S:10"
T:8.375"
T:10.875"
B:8.625"
B:11.125"

UNITED STATES
SECURITIES AND EXCHANGE COMMISSION
WASHINGTON, D.C. 20549
FORM 10-K
(Mark One)
☒
ANNUAL REPORT PURSUANT TO SECTION 13 OR 15(d) OF THE SECURITIES EXCHANGE ACT
OF 1934
For the fiscal year ended December 31, 2020
OR
☐
TRANSITION REPORT PURSUANT TO SECTION 13 OR 15(d) OF THE SECURITIES EXCHANGE ACT
OF 1934
For the transition period from to
Commission file number 1-9924
Citigroup Inc.
(Exact name of registrant as specified in its charter)
Delaware 52-1568099
(State or other jurisdiction of incorporation or organization) (I.R.S. Employer Identification No.)
388 Greenwich Street, New York NY 10013
(Address of principal executive offices) (Zip code)
(212) 559-1000
(Registrant’s telephone number, including area code)
Securities registered pursuant to Section 12(b) of the Securities Exchange Act of 1934 formatted in Inline XBRL: See Exhibit 99.01
Securities registered pursuant to Section 12(g) of the Act: none
Indicate by check mark if the registrant is a well-known seasoned issuer, as defined in Rule 405 of the Securities Act. Yes oNo x
Indicate by check mark if the registrant is not required to file reports pursuant to Section 13 or Section 15(d) of the Act. Yes o No x
Indicate by check mark whether the registrant (1) has filed all reports required to be filed by Section 13 or 15(d) of the Securities Exchange Act of 1934 during
the preceding 12 months (or for such shorter period that the registrant was required to file such reports), and (2) has been subject to such filing requirements
for the past 90 days. Yes x No o
Indicate by check mark whether the registrant has submitted electronically every Interactive Data File required to be submitted pursuant to Rule 405 of
Regulation S-T (§232.405 of this chapter) during the preceding 12 months (or for such shorter period that the registrant was required to submit such files).
Yes x No o
Indicate by check mark whether the registrant is a large accelerated filer, an accelerated filer, a non-accelerated filer, smaller reporting, or an emerging
growth company. See the definitions of “large accelerated filer,” “accelerated filer,” “smaller reporting company” and “emerging growth company” in
Rule 12b-2 of the Exchange Act.
Large accelerated filer
☒
Accelerated filer
☐
Non-accelerated filer
☐
Smaller reporting company
☐
Emerging growth company
☐
If an emerging growth company, indicate by check mark if the registrant has elected not to use the extended transition period for complying with any new or
revised financial accounting standards provided pursuant to Section 13(a) of the Exchange Act. Yes o
Indicate by check mark whether the Registrant has filed a report on and attestation to its management’s assessment of the effectiveness of its internal control
over financial reporting under Section 404(b) of the Sarbanes-Oxley Act (15 U.S.C. 7262(b)) by the registered public accounting firm that prepared or issued
its audit report. ☒
Indicate by check mark whether the registrant is a shell company (as defined in Rule 12b-2 of the Exchange Act). Yes ☐ No x
The aggregate market value of Citigroup Inc. common stock held by non-affiliates of Citigroup Inc. on June 30, 2020 was approximately $106.2 billion.
Number of shares of Citigroup Inc. common stock outstanding on January 31, 2021: 2,087,317,952
Documents Incorporated by Reference: Portions of the registrant’s proxy statement for the annual meeting of stockholders scheduled to be held on April 27,
2021 are incorporated by reference in this Form 10-K in response to Items 10, 11, 12, 13 and 14 of Part III.
Available on the web at www.citigroup.com

FORM 10-K CROSS-REFERENCE INDEX
Item Number Page
Part I
1. Business 4–31, 123–128,
131, 162,
312–313
1A. Risk Factors 49–61
1B. Unresolved Staff Comments Not Applicable
2. Properties Not Applicable
3.
Legal Proceedings—See
Note 27 to the Consolidated
Financial Statements 291–298
4. Mine Safety Disclosures Not Applicable
Part II
5.
Market for Registrant’s
Common Equity, Related
Stockholder Matters and
Issuer Purchases of Equity
Securities
142–143, 168–170,
314–315
6. Selected Financial Data 14–15
7.
Management’s Discussion
and Analysis of Financial
Condition and Results of
Operations 6–31, 66–122
7A.
Quantitative and Qualitative
Disclosures About Market
Risk
66–122, 163–167,
187–223, 230–282
8.
Financial Statements and
Supplementary Data 138–311
9.
Changes in and
Disagreements with
Accountants on Accounting
and Financial Disclosure Not Applicable
9A. Controls and Procedures 129–130
9B. Other Information Not Applicable
Part III
10.
Directors, Executive Officers
and Corporate Governance 316–318*
11. Executive Compensation **
12.
Security Ownership of
Certain Beneficial Owners
and Management and
Related Stockholder Matters ***
13.
Certain Relationships and
Related Transactions and
Director Independence ****
14.
Principal Accounting Fees
and Services *****
Part IV
15.
Exhibits and Financial
Statement Schedules
* For additional information regarding Citigroup’s Directors, see
“Corporate Governance” and “Proposal 1: Election of Directors” in
the definitive Proxy Statement for Citigroup’s Annual Meeting of
Stockholders scheduled to be held on April 27, 2021, to be filed
with the SEC (the Proxy Statement), incorporated herein by
reference.
** See “Compensation Discussion and Analysis,” “The Personnel and
Compensation Committee Report,” and “2020 Summary
Compensation Table and Compensation Information” and “CEO
Pay Ratio” in the Proxy Statement, incorporated herein by
reference.
*** See “About the Annual Meeting,” “Stock Ownership,” “Equity
Compensation Plan Information,” and Delinquent Section 16(a)
Reports in the Proxy Statement, incorporated herein by reference.
**** See “Corporate Governance—Director Independence,” “—Certain
Transactions and Relationships, Compensation Committee
Interlocks and Insider Participation” and “—Indebtedness” in the
Proxy Statement, incorporated herein by reference.
***** See “Proposal 2: Ratification of Selection of Independent
Registered Public Accounting Firm” in the Proxy Statement,
incorporated herein by reference.
2
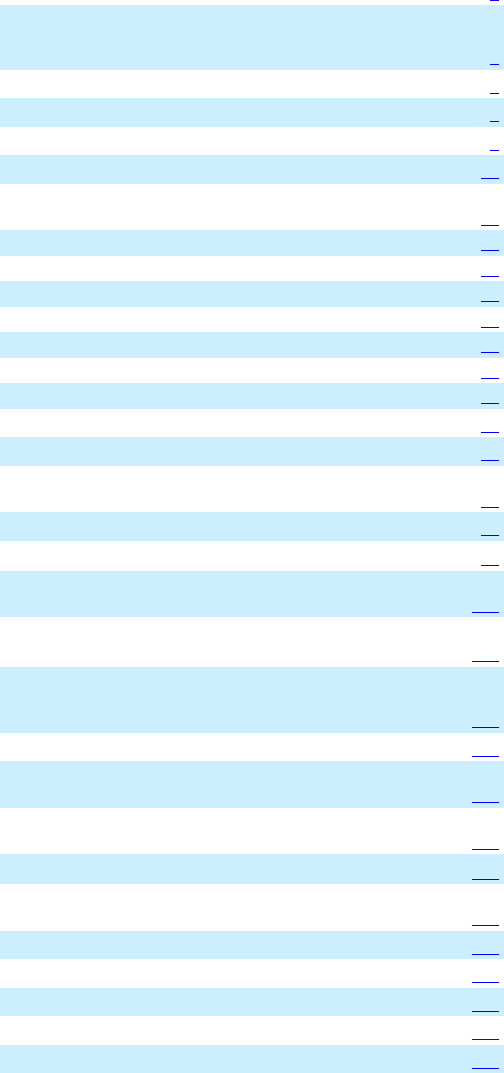
CITIGROUP’S 2020 ANNUAL REPORT ON FORM 10-K
OVERVIEW 4
MANAGEMENT’S DISCUSSION AND
ANALYSIS OF FINANCIAL CONDITION AND
RESULTS OF OPERATIONS 6
Executive Summary 6
Citi's Consent Order Compliance 8
COVID-19 Pandemic Overview 9
Summary of Selected Financial Data 14
SEGMENT AND BUSINESS—INCOME (LOSS)
AND REVENUES 16
SEGMENT BALANCE SHEET 17
Global Consumer Banking 18
North America GCB 20
Latin America GCB 22
Asia GCB 24
Institutional Clients Group 26
Corporate/Other 31
CAPITAL RESOURCES 32
RISK FACTORS 49
HUMAN CAPITAL RESOURCES AND
MANAGEMENT 62
Managing Global Risk Table of Contents 65
MANAGING GLOBAL RISK 66
SIGNIFICANT ACCOUNTING POLICIES AND
SIGNIFICANT ESTIMATES 123
DISCLOSURE CONTROLS AND
PROCEDURES 129
MANAGEMENT’S ANNUAL REPORT ON
INTERNAL CONTROL OVER FINANCIAL
REPORTING 130
FORWARD-LOOKING STATEMENTS 131
REPORT OF INDEPENDENT REGISTERED
PUBLIC ACCOUNTING FIRM 132
FINANCIAL STATEMENTS AND NOTES
TABLE OF CONTENTS 137
CONSOLIDATED FINANCIAL STATEMENTS 138
NOTES TO CONSOLIDATED FINANCIAL
STATEMENTS 146
FINANCIAL DATA SUPPLEMENT 311
SUPERVISION, REGULATION AND OTHER 312
CORPORATE INFORMATION 316
Executive Officers 316
Citigroup Board of Directors 317
3

OVERVIEW
Citigroup’s history dates back to the founding of the City
Bank of New York in 1812.
Citigroup is a global diversified financial services holding
company whose businesses provide consumers, corporations,
governments and institutions with a broad, yet focused, range
of financial products and services, including consumer
banking and credit, corporate and investment banking,
securities brokerage, trade and securities services and wealth
management. Citi has approximately 200 million customer
accounts and does business in more than 160 countries and
jurisdictions.
At December 31, 2020, Citi had approximately 210,000
full-time employees, compared to approximately 200,000 full-
time employees at December 31, 2019. For additional
information, see “Human Capital Resources and
Management” below.
Citigroup currently operates, for management reporting
purposes, via two primary business segments: Global
Consumer Banking (GCB) and Institutional Clients Group
(ICG), with the remaining operations in Corporate/Other. For
a further description of the business segments and the products
and services they provide, see “Citigroup Segments” below,
“Management’s Discussion and Analysis of Financial
Condition and Results of Operations” and Note 3 to the
Consolidated Financial Statements.
Throughout this report, “Citigroup,” “Citi” and “the
Company” refer to Citigroup Inc. and its consolidated
subsidiaries.
Additional information about Citigroup is available on
Citi’s website at www.citigroup.com. Citigroup’s recent
annual reports on Form 10-K, quarterly reports on Form 10-Q
and proxy statements, as well as other filings with the U.S.
Securities and Exchange Commission (SEC), are available
free of charge through Citi’s website by clicking on the
“Investors” tab and selecting “SEC Filings,” then “Citigroup
Inc.” The SEC’s website also contains current reports on Form
8-K and other information regarding Citi at www.sec.gov.
For a discussion of 2019 versus 2018 results of operations
of GCB in North America, Latin America and Asia, ICG and
Corporate/Other, see each respective business’s results of
operations in Citi’s 2019 Annual Report on Form 10-K.
Certain reclassifications have been made to the prior
periods’ financial statements and disclosures to conform to the
current period’s presentation.
Please see “COVID-19 Pandemic Overview” and
“Risk Factors” below for a discussion of the trends,
uncertainties and material risks that could impact
Citigroup’s businesses, financial condition and results of
operations.
4
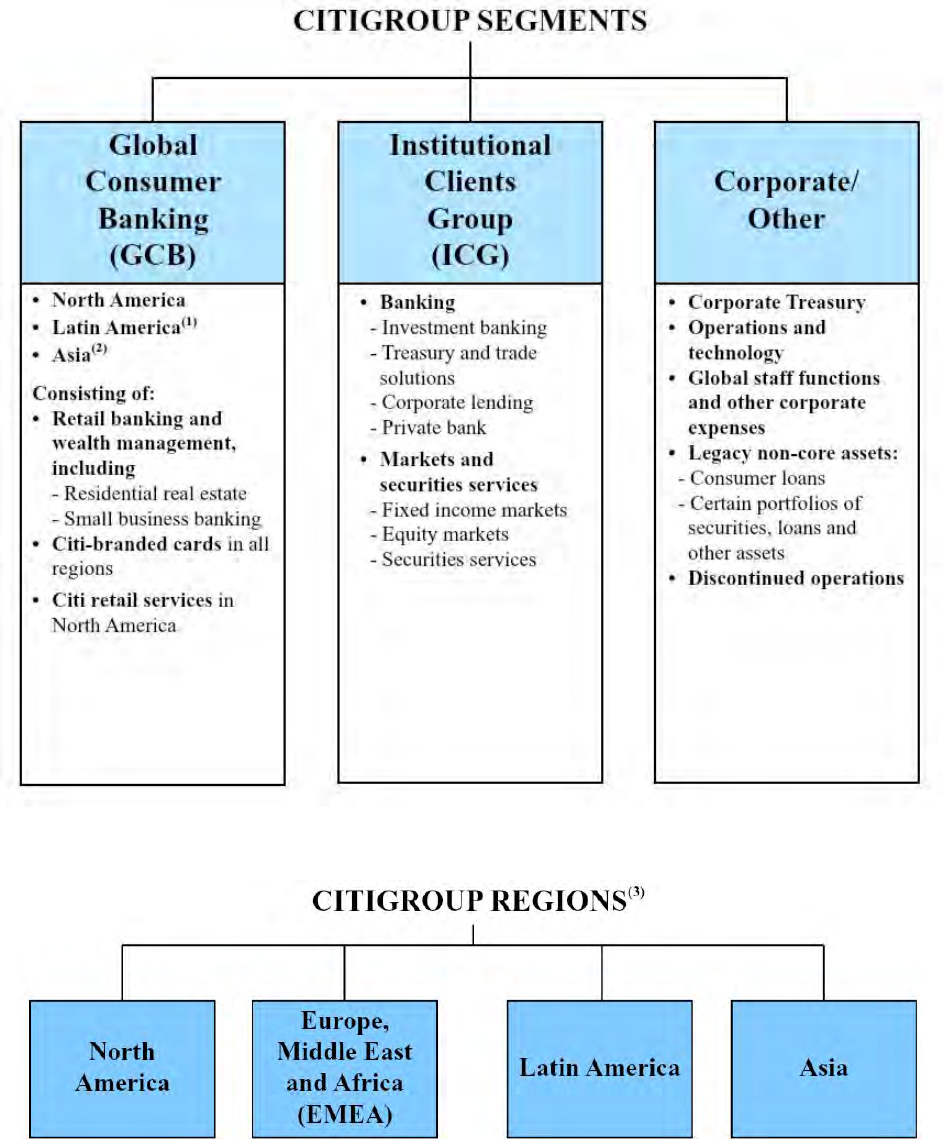
As described above, Citigroup is managed pursuant to two business segments: Global Consumer Banking and Institutional
Clients Group, with the remaining operations in Corporate/Other.
The following are the four regions in which Citigroup operates. The regional results are fully reflected in the segment results
above.
(1) Latin America GCB consists of Citi’s consumer banking business in Mexico.
(2) Asia GCB includes the results of operations of GCB activities in certain EMEA countries for all periods presented.
(3) North America includes the U.S., Canada and Puerto Rico; Latin America includes Mexico and Asia includes Japan.
5
MANAGEMENT’S DISCUSSION AND ANALYSIS OF FINANCIAL CONDITION
AND RESULTS OF OPERATIONS
EXECUTIVE SUMMARY
As described further throughout this Executive Summary,
during 2020, Citi demonstrated solid performance as well as
financial strength and operational resilience, despite a
significant deterioration in public health and economic
conditions during the year due to the COVID-19 pandemic:
• Citi’s earnings were substantially reduced by a higher
allowance for credit loss (ACL) build (approximately $9.8
billion) during the year under the CECL standard (see
“Cost of Credit” below).
• Despite the challenging environment, Citi’s revenues
were largely unchanged from the prior year, as strong
performance in fixed income markets, equity markets,
investment banking and the private bank in Institutional
Clients Group (ICG) offset the impact of lower interest
rates across the Company, as well as the impact of lower
customer activity in Global Consumer Banking (GCB),
reflecting declines across all regions, and lower revenues
in Corporate/Other.
• Citi’s expenses reflected continued investments in its
transformation, including infrastructure supporting its risk
and control environment, as well as a $400 million civil
money penalty in the third quarter of 2020 in connection
with a consent order Citibank entered into with the Office
of the Comptroller of the Currency (OCC) (for additional
information on this consent order and the Citigroup
consent order with the Federal Reserve Board, see “Citi’s
Consent Order Compliance” below).
• Citi had broad-based deposit growth across ICG and
GCB, reflecting strong client engagement, as well as an
elevated level of liquidity in the financial system, while
loans declined reflecting lower levels of consumer and
corporate activity.
• Citi returned $7.2 billion of capital to its common
shareholders in the form of dividends and common share
repurchases.
• The Federal Reserve Board authorized Citi to take certain
capital actions during the first quarter of 2021, which
allows Citi to return capital to common shareholders of up
to $2.8 billion, including the previously announced
common dividends of $0.51 per share in the quarter. Citi
commenced share repurchases in February 2021.
• Citi continued to support its colleagues, customers, clients
and communities as well as the broader economy during
this challenging time (see “COVID-19 Pandemic
Overview” below), while maintaining a strong balance
sheet.
The economic outlook for 2021 reflects continued
challenges and uncertainties related to the pandemic,
including, among others, the duration and severity of the
public health crisis and associated economic impacts, which
have created a more volatile operating environment that will
continue to negatively impact Citi’s businesses and results.
As a result of new information Citi received subsequent to
December 31, 2020, Citi adjusted downward its fourth quarter
of 2020 financial results from those previously reported on
January 15, 2021 (and filed on a Form 8-K with the SEC on
such date), due to a $390 million increase in operating
expenses ($323 million after-tax) recorded within ICG,
resulting from operational losses related to certain legal
matters. For additional information on the impact to fourth
quarter of 2020 financial results, see Note 30 to the
Consolidated Financial Statements. Citi’s results of operations
and financial condition for the full year 2020, as reported in
this Annual Report on Form 10-K for the year ended
December 31, 2020, reflect the impact of this adjustment.
For a discussion of risks and uncertainties that will or
could impact Citi’s businesses, results of operations and
financial condition during 2021, see “COVID-19 Pandemic
Overview,” “Risk Factors,” each respective business’s results
of operations and “Managing Global Risk” below.
2020 Results Summary
Citigroup
Citigroup reported net income of $11.0 billion, or $4.72 per
share, compared to net income of $19.4 billion, or $8.04 per
share, in the prior year. Net income declined 43%, driven by
significantly higher credit costs and higher expenses, while
revenues remained largely unchanged. Earnings per share
decreased 41%, primarily driven by the decline in net income.
Citigroup revenues of $74.3 billion were largely
unchanged from the prior year, as higher revenues in ICG
offset lower revenues in GCB and Corporate/Other.
Citigroup’s end-of-period loans decreased 3% from the
prior year to $676 billion. Excluding the impact of foreign
currency translation into U.S. dollars for reporting purposes
(FX translation), Citigroup’s end-of-period loans declined 4%,
driven by a 4% aggregate decline in GCB and ICG, reflecting
lower spend activity in GCB as well as a higher level of
repayments in both GCB and ICG. Citigroup’s end-of-period
deposits increased 20% to $1.3 trillion. Excluding the impact
of FX translation, Citigroup’s end-of-period deposits increased
19%, primarily driven by 18% growth in GCB and 19%
growth in ICG. (Citi’s results of operations excluding the
impact of FX translation are non-GAAP financial measures.
Citi believes the presentation of its results of operations and
financial condition excluding the impact of FX translation
provides a meaningful depiction of the underlying
fundamentals of its businesses for investors, industry analysts
and others.)
Expenses
Citigroup operating expenses of $43.2 billion increased 3%
versus the prior year, primarily driven by investments in Citi’s
transformation, including infrastructure supporting its risk and
control environment, higher compensation, the civil money
penalty, operational losses related to certain legal matters and
pandemic-related expenses, partially offset by efficiency
savings and reductions in marketing and other discretionary
spending. Operating expenses in GCB declined 2%, while ICG
6
expenses increased 6% and Corporate/Other expenses
increased 16%.
Cost of Credit
Citi’s total provisions for credit losses and for benefits and
claims of $17.5 billion increased significantly from $8.4
billion in the prior year, reflecting ACL reserve increases
across GCB, ICG and Corporate/Other. Citi’s ACL build of
$9.8 billion was largely driven by builds during the first half
of 2020. The reserve build in 2020 primarily reflected the
impact of a deterioration in Citi’s macroeconomic outlook
under the CECL standard and downgrades in the corporate
loan portfolio, partially offset by lower loan volumes in GCB,
all driven by the pandemic. The reserve build included an
additional qualitative management adjustment to reflect the
potential for a higher level of stress and a slower economic
recovery. For further information on the drivers of Citi’s ACL
build, see “Significant Accounting Policies and Significant
Estimates—Allowance for Credit Losses” below. For
information on the transition impact of the adoption of the
CECL standard, see “COVID-19 Pandemic Overview” below.
Net credit losses of $7.6 billion declined 2% from the
prior year. Consumer net credit losses of $6.6 billion
decreased 10%, primarily reflecting lower loan volumes given
lower spending activity and higher payment rates, as well as
the benefits of consumer relief programs (see “COVID-19
Pandemic Overview” below). Corporate net credit losses
increased from $392 million to $1.0 billion, primarily driven
by write-offs across various sectors, which were partially
offset by the release of previously established ACL reserves.
For additional information on Citi’s consumer and
corporate credit costs and ACL, see each respective business’s
results of operations and “Credit Risk” below.
Capital
Citigroup’s Common Equity Tier 1 Capital ratio was 11.7% as
of December 31, 2020, based on the Basel III Advanced
Approaches framework for determining risk-weighted assets,
compared to 11.8% as of December 31, 2019, based on the
Basel III Standardized Approach for determining risk-
weighted assets. The decline in the ratio primarily reflected an
increase in risk-weighted assets and the return of capital to
common shareholders, partially offset by net income and
beneficial net movements in Accumulated other
comprehensive income (AOCI).
Citigroup’s Supplementary Leverage ratio was 7.0% as of
December 31, 2020, compared to 6.2% as of December 31,
2019. The increase was primarily driven by a decrease in Total
Leverage Exposure, reflecting the benefit of temporary relief
granted by the Federal Reserve Board. For additional
information on Citi’s capital ratios and related components,
see “Capital Resources” below.
Global Consumer Banking
GCB net income of $878 million declined 85% from the prior
year. Excluding the impact of FX translation, net income
declined 84%, reflecting lower revenues and higher cost of
credit, partially offset by lower expenses. GCB operating
expenses of $17.2 billion decreased 2%. Excluding the impact
of FX translation, expenses decreased 1%, as lower volume-
related expenses, reductions in marketing and other
discretionary spending and efficiency savings were partially
offset by increases in pandemic-related expenses and higher
repositioning costs.
GCB revenues of $30.0 billion decreased 9%. Excluding
the impact of FX translation, revenues decreased 8%, as strong
deposit growth and momentum in wealth management were
more than offset by lower card volumes and lower interest
rates across all regions, reflecting the impact of the pandemic.
North America GCB revenues of $19.1 billion decreased
6%, with lower revenues across Citi-branded cards, Citi retail
services and retail banking. Citi-branded cards revenues of
$8.8 billion decreased 4%, reflecting lower purchase sales and
higher payment rates driving lower average loans. Citi retail
services revenues of $5.9 billion decreased 12%, reflecting
lower average loans as well as higher partner payments. Retail
banking revenues of $4.5 billion decreased 2%, as the benefit
of stronger deposit volumes and an improvement in mortgage
revenues were more than offset by lower deposit spreads.
North America GCB average deposits of $176 billion
increased 15% year-over-year, average retail banking loans of
$52 billion increased 8% year-over-year and assets under
management of $80 billion increased 11%. Average Citi-
branded cards loans of $85 billion decreased 6% and Citi-
branded cards purchase sales of $338 billion decreased 8%,
while average Citi retail services loans of $47 billion
decreased 7% and Citi retail services purchase sales of $78
billion decreased 11%. The decline in Citi-branded cards and
retail services loans and purchase sales were all driven by
reduced customer activity related to the pandemic. For
additional information on the results of operations of North
America GCB in 2020, see “Global Consumer Banking—
North America GCB” below.
International GCB revenues (consisting of Latin America
GCB and Asia GCB (which includes the results of operations
in certain EMEA countries)) of $10.8 billion declined 14%
versus the prior year. Excluding the impact of FX translation,
international GCB revenues declined 10%, largely reflecting
the impact of the pandemic. On this basis, Latin America GCB
revenues decreased 8%, driven by lower average loans and
lower interest rates, partially offset by strong deposit growth.
Asia GCB revenues decreased 11%, as lower card revenues
and the impact of lower interest rates were partially offset by
strong investment revenues and strong deposit growth. For
additional information on the results of operations of Latin
America GCB and Asia GCB in 2020, including the impact of
FX translation, see “Global Consumer Banking—Latin
America GCB” and “Global Consumer Banking—Asia GCB”
below.
Year-over-year, excluding the impact of FX translation,
international GCB average deposits of $135 billion increased
11%, average retail banking loans of $72 billion increased 3%
and assets under management of $141 billion increased 8%.
On this basis, international GCB average card loans of $22
billion decreased 8% and card purchase sales of $88 billion
decreased 16%, both driven by reduced customer activity
related to the pandemic.
7
Institutional Clients Group
ICG net income of $11.7 billion decreased 9%, as revenue
growth was more than offset by higher cost of credit and
higher expenses. ICG operating expenses increased 6% to
$23.5 billion, largely driven by investments in infrastructure
and risk management and controls, higher compensation costs,
operational losses related to certain legal matters and volume-
driven growth, partially offset by efficiency savings.
ICG revenues of $44.3 billion increased 13%, reflecting a
29% increase in Markets and securities services revenues,
partially offset by a 1% decline in Banking revenues. The
decrease in Banking revenues included the impact of $51
million of losses on loan hedges related to corporate lending
and the private bank, compared to losses of $432 million
related to corporate lending in the prior year.
Banking revenues of $21.2 billion (excluding the impact
of losses on loan hedges) decreased 3%, as increases in
investment banking and the private bank were more than
offset by declines in treasury and trade solutions and corporate
lending. Investment banking revenues of $5.8 billion increased
11%, reflecting solid growth in capital markets, particularly in
equity underwriting. Advisory revenues decreased 20% to
$1.0 billion, while equity underwriting revenues increased
64% to $1.6 billion and debt underwriting revenues increased
7% to $3.2 billion.
Treasury and trade solutions revenues of $9.5 billion
declined 7%, and 5% excluding the impact of FX translation,
as strong client engagement and growth in deposits were more
than offset by lower interest rates and reduced commercial
card spend largely driven by the pandemic. Private bank
revenues of $3.8 billion increased 9%. Excluding the impact
of gains on loan hedges, private bank revenues of $3.7 billion,
increased 8%, driven by increased capital markets activity and
improved managed investments revenues, as well as higher
lending and deposit volumes, partially offset by lower deposit
spreads. Corporate lending revenues of $2.1 billion declined
15%. Excluding the impact of losses on loan hedges, corporate
lending revenues of $2.2 billion declined 25%, as higher
average loan volumes were more than offset by lower spreads,
higher hedging costs and an adjustment to the residual value of
a lease financing asset.
Markets and securities services revenues of $23.1 billion
increased 29%. Fixed income markets revenues of $17.3
billion increased 34%, reflecting strength in rates and
currencies, spread products and commodities. Equity markets
revenues of $3.6 billion increased 25%, as solid performance
in cash equities and derivatives was partially offset by lower
revenues in prime finance. Securities services revenues of $2.5
billion decreased 3%, and 1% excluding the impact of FX
translation, as higher deposit volumes were more than offset
by lower spreads. For additional information on the results of
operations of ICG in 2020, see “Institutional Clients Group”
below.
Corporate/Other
Corporate/Other net loss was $1.6 billion, compared to net
income of $801 million in the prior year, reflecting lower
revenues, increased expenses, higher cost of credit, driven by
an ACL build on Citi’s residual legacy portfolio under the
CECL standard, and lower tax benefits. Operating expenses of
$2.5 billion increased significantly, as the wind-down of
legacy assets was more than offset by investments in
infrastructure, risk management and controls, the civil money
penalty and incremental costs associated with the pandemic.
Corporate/Other revenues of $54 million compared to
$2.0 billion in the prior year, reflecting the impact of lower
interest rates, episodic gains in the prior year, the wind-down
of legacy assets and marks on securities. For additional
information on the results of operations of Corporate/Other in
2020, see “Corporate/Other” below.
CITI’S CONSENT ORDER COMPLIANCE
As previously disclosed, Citi is embarking on a multiyear
transformation, with the target outcome to change Citi’s
business and operating models such that they simultaneously
strengthen risk and controls and improve Citi’s value to
customers, clients and shareholders.
One part of the broader transformation effort involves
Citi’s compliance with the Federal Reserve Board and OCC
consent orders issued with Citigroup and Citibank,
respectively, in October 2020. The consent orders require that
Citigroup and Citibank submit acceptable plans to the Federal
Reserve Board and the OCC, on various timelines, relating
principally to various aspects of risk management,
compliance, data quality management and governance, and
internal controls. The consent order with the OCC also
required Citibank to pay a $400 million civil money penalty.
As a part of its compliance actions, Citi has centralized its
program management under the leadership of a Chief
Administrative Officer organization and is making the
strengthening of its risk and control environment a further
strategic priority for the Company. The Citigroup and Citibank
Boards of Directors each formed a Transformation Oversight
Committee, an ad hoc committee of each Board, to provide
oversight of management’s remediation efforts under the
consent orders.
For additional information about the consent orders, see
“Risk Factors—Compliance Risks” below and Citi’s Current
Report on Form 8-K filed with the SEC on October 7, 2020.
8
COVID-19 PANDEMIC OVERVIEW
In addition to the widespread public health implications, the
COVID-19 pandemic has had an extraordinary impact on
macroeconomic conditions in the U.S. and around the world.
As discussed below and elsewhere throughout this Form 10-K,
Citi’s businesses, results of operations and financial condition
have been impacted by economic dislocations and trends
caused by the pandemic. Citi had builds to its allowance for
credit losses (ACL) of approximately $9.8 billion during 2020,
bringing its total ACL to approximately $27.8 billion at
December 31, 2020, with an allowance for credit losses on
loans (ACLL) reserve ratio of 3.73% on funded loans. For
additional information, see “Impact of CECL on Citi’s
Allowance for Credit Losses” below.
Despite these impacts, Citi has maintained strong capital
and liquidity positions with consistently strong business
operations. At December 31, 2020, Citi had a Common Equity
Tier 1 Capital ratio of 11.7%, a Supplementary Leverage ratio
of 7.0% and a Liquidity Coverage ratio of 118%, each well
above regulatory minimums, with approximately $972 billion
of available liquidity resources (see “Capital Resources” and
“Managing Global Risk—Liquidity Risk” below).
Governments and central banks globally have taken a
series of aggressive actions to support their economies and
mitigate the systemic impacts of the pandemic, and Citi
continues to proactively assess and utilize these measures
where appropriate.
Citi’s COVID-19 Pandemic Response—Supporting
Colleagues, Customers and Communities
The health and safety of Citi’s employees and their families,
as well as Citi’s customers, clients and the communities it
serves, are of the utmost importance. As the public health
crisis has unfolded, Citi has continued to take proactive
measures to support colleagues’ well-being while maintaining
its ability to serve customers and clients.
Citi Colleagues
• The majority of Citi colleagues—roughly 80%—around
the world are working remotely, however this varies by
country.
• Citi is pursuing a slow and measured return in locations
where local guidelines permit, beginning with only a
small number of colleagues.
• Citi’s response teams continue to consult with health
experts and follow local government guidelines in
determining the safest return to office for each location.
• Citi has reconfigured its sites and implemented new
protocols to make work environments as safe as possible
in offices, branches and ATMs.
• Citi continues to provide additional health and well-being
resources for colleagues, plus enhanced flexibility and
paid time off for those impacted by COVID-19.
• The company continues to monitor the situation as it
evolves and will review and update operations as needed.
Citi Communities
In addition to its business activities, including the consumer
relief programs discussed below, Citi is supporting those
immediately impacted by the pandemic through philanthropic
efforts around the world. Citi and the Citi Foundation have
committed more than $100 million to date in support of
COVID-19-related community relief and economic recovery
efforts globally. These contributions include over $4 million
raised through an employee donation matching program to
further global relief efforts. Additionally, Citi has donated $50
million in proceeds from its participation in the U.S. Small
Business Administration’s Paycheck Protection Program
(PPP) to the Citi Foundation, which deployed those proceeds
to support Community Development Financial Institutions
(CDFIs) across the U.S.
Citi Consumer Loan Relief Programs
As previously disclosed, Citi was one of the first banks in the
U.S. to announce temporary assistance measures for
pandemic-impacted consumer customers. In addition, Citi has
offered a wide array of short- and medium-term relief
programs to customers across regions and products as a result
of the pandemic. The relief has primarily been in the form of
payment deferrals and fee waivers. These consumer relief
programs have mainly been provided to GCB customers, with
a small portion reported within Corporate/Other. To date, Citi
has provided assistance to approximately three million U.S.
consumers and small businesses impacted by the pandemic.
In the fourth quarter of 2020, Citi experienced a decline in
enrollment of approximately 21% quarter-over-quarter in its
formal COVID-19 assistance programs. As a result of the
significant and steady decline in enrollment, Citi ended the
programs as of December 31, 2020 for the majority of
countries and products. Continued COVID-19 assistance
programs through Citi’s subservicer include extended
mortgage payment deferrals through 2021 and suspended
foreclosures into the first quarter of 2021 for U.S. mortgages.
Citi remains committed to discussing assistance options with
customers that continue to experience financial hardship on a
case-by-case basis.
The table below provides information on the number of
loan modifications, the associated enrollment and outstanding
balances as of December 31, 2020, for Citi’s pandemic-related
relief programs, excluding troubled debt restructurings (for
additional information, see “Troubled Debt Restructuring
(TDR) Relief” below).
9

For the Three Months
Ended December 31, 2020
For the Twelve Months
Ended December 31, 2020 As of December 31, 2020
Program details
In millions of dollars,
except number of loans
modified
Number of
loans
modified
Enrollment
balance
(1)
Number of
loans
modified
Enrollment
balance
(2)
EOP
balance
(3)
% of total
loan
portfolio
(4)
North America
Credit cards 270,655 $ 843 2,626,225 $ 9,165 $ 708 1 % Waivers on late fees and
deferral of minimum payments
for two to four payment cycles
Residential first
mortgages
1,022 197 9,279 3,573 1,256 3 Extending existing payment
deferral options through 2021
and suspending foreclosures
into the first quarter of 2021
Home equity loans 264 18 5,230 614 254 4 Extending existing payment
deferral options
Personal, small
business and other
1,178 11 22,247 315 7 — Waivers on fees including non-
Citi ATM fees and monthly
service fees as well as
minimum payment deferrals
for up to six months
Total North America 273,119 $ 1,069 2,662,981 $ 13,667 $ 2,225 1 %
International
Asia
Credit cards 153,684 $ 366 1,306,090 $ 2,520 $ 189 1 % Payment deferrals for one to
six months, interest and fee
waivers, and reductions in
minimum due payments;
balance conversion programs
Residential first
mortgages
1,537 119 46,275 3,812 583 2 Payment deferrals for up to 12
months, interest and fee
waivers, and reductions in
minimum due payments
Personal, small
business and other
14,977 85 219,071 1,740 49 — Payment deferrals for up to
three months for revolving
products and overdrafts or up
to 12 months for installment
loans, interest and fee waivers,
and reductions in minimum
due payments
Latin America
Credit cards — — 641,038 1,263 — — Minimum payment deferrals
for up to six months
Residential first
mortgages
— — 26,251 950 — — Installment payment deferral
for up to six months to be
recovered as a balloon
payment at the end of the loan
Personal, small
business and other
— — 184,966 1,711 — — Installment payment deferral
for up to six months,
temporary interest rate
reductions
Total international 170,198 $ 570 2,423,691 $ 11,996 $ 821 1 %
Total consumer 443,317 $ 1,639 5,086,672 $ 25,663 $ 3,046 1 %
(1) Enrollment balances represent the aggregate amounts enrolled during the fourth quarter of 2020.
(2) Enrollment balances represent the aggregate amounts enrolled during the 12 months ended December 31, 2020.
(3) Total outstanding balance on loans enrolled in consumer relief programs as of December 31, 2020. Reserves for these loans are calculated in accordance with the
CECL standard.
(4) The percentage denominator is the total end-of-period loans balance for the respective product and region as of December 31, 2020.
As set forth in the table above, during the fourth quarter
of 2020, Citi modified approximately 0.4 million consumer
loans, excluding TDRs, with associated enrollment balances of
approximately $1.6 billion. For the year ended December 31,
2020, Citi modified 5.1 million consumer loans, excluding
TDRs, with associated enrollment balances of approximately
$25.7 billion. As of December 31, 2020, Citi had
approximately $3.0 billion of loan balances outstanding under
the consumer loan relief programs, representing approximately
1% of Citi’s total consumer loan balance.
As of December 31, 2020, Citi had approximately $2.2
billion of loan balances outstanding under the consumer relief
programs in North America.
10

Citi’s North America credit card programs had the largest
number of loan modifications in 2020. As these credit card
relief programs were introduced during the first half of 2020
and offered a deferral of minimum payments for two to four
payment cycles, nearly all of the customers had rolled off the
programs by year-end, of whom approximately 86% have
continued to make payments.
For customers enrolled in mortgage forbearance programs
in North America, Citi’s subservicer offered payment deferrals
and suspended foreclosures, and by the end of 2020,
approximately 63% of mortgage customers had rolled off the
program, of whom approximately 72% have continued to
make payments. As of December 31, 2020, Citi had
approximately $1.3 billion of mortgage loan balances
outstanding under the programs.
As of December 31, 2020, Citi had approximately $0.8
billion of loan balances outstanding under Asia consumer
relief programs. In Asia, approximately 96% of customers had
rolled off the consumer relief programs as of December 31,
2020, of whom approximately 83% have continued to make
payments.
As of December 31, 2020, Citi had no loan balances
outstanding under the Latin America consumer relief
programs, as all the customers had rolled off the programs, of
whom approximately 78% have continued to make payments.
Citi Corporate Loan Relief Programs
Citi has modified the contractual terms of corporate loans to
certain borrowers impacted by the pandemic, primarily
commercial banking (small business) and private bank
customers. These modifications consist primarily of deferrals
in the payment of principal and/or interest that Citi has
provided during 2020 in response to borrower requests, as
well as those provided pursuant to government-mandated
relief programs.
The table below summarizes Citi’s outstanding active
loan modifications, excluding TDRs as of December 31, 2020.
December 31, 2020
In millions of dollars
Total credit
exposure Funded Unfunded
Corporate loans $ 1,132 $ 1,074 $ 58
Private bank loans 773 762 11
Total corporate $ 1,905 $ 1,836 $ 69
Citi’s Management of COVID-19 Pandemic Risks
Citi has responded on multiple fronts to the challenges of the
pandemic to support the ongoing needs of its customers and
clients, while concurrently maintaining safety and soundness
standards.
Citi’s dedicated continuity of business and crisis
management groups are managing Citi’s protocols in response
to the pandemic. These protocols provide for the safety and
well-being of Citi’s staff, while continuing to maintain high
levels of client servicing across all of the markets in which
Citi operates. These protocols address the prioritization of
critical processing; ability of staff and third parties to support
these processes from remote work locations; deployment of
new hardware to support technology needs; and ongoing
monitoring to assess controls and service levels. Planning for
Citi’s return-to-office strategy is ongoing.
Citi’s organizational response to the pandemic has been
governed by Citi’s Executive Management Team, consisting
of the Citigroup CEO and certain direct reports of the CEO,
and driven through regional task forces that were deployed in
Asia, EMEA, North America and Latin America. Led by
regional CEOs and their management teams, these groups
focused on, and continue to manage, the pandemic responses,
implementation of continuity of business plans, locational and
staffing strategies and responses to customer and client needs.
Throughout the crisis, Citi has also worked closely with
U.S. authorities and host governments on implementing
immediate policy responses and financial assistance structures
to mitigate the systemic impacts of the pandemic. Citi also
continues to engage closely with customers and clients,
regulators and other relevant stakeholders to assure alignment
on all pandemic-related matters.
11
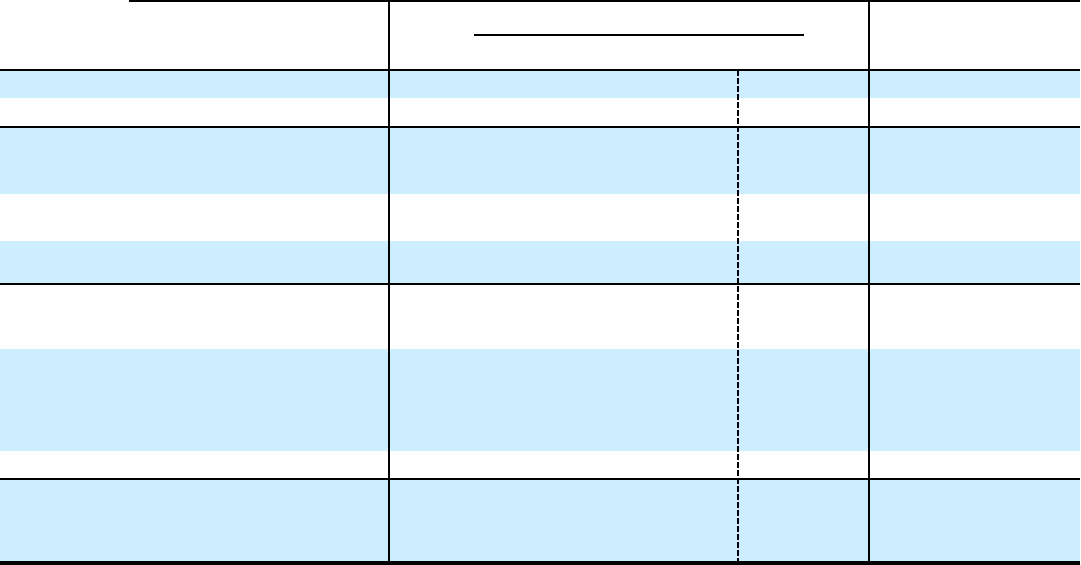
Citi’s Allowance for Credit Losses (ACL)
The table below shows the impact of Citi’s adoption of the
current expected credit loss (CECL) standard as of January 1,
2020 and the ACL builds (releases) during 2020. For
information on the drivers of Citi’s ACL release in the fourth
quarter, see “Significant Accounting Policies and Significant
Estimates—Allowance for Credit Losses” below. For
additional information on Citi’s accounting policy on
accounting for credit losses under CECL, see Note 1 to the
Consolidated Financial Statements.
Allowance for credit losses (ACL)
In millions of
dollars
Balance
Dec. 31,
2019
CECL
transition
impact
Collection
costs
change
(1)
Balance
Jan. 1,
2020
Build (release)
2020
FX/
Other
Balance
Dec. 31,
2020
ACLL/EOP
loans Dec. 31,
2020
(2)
1Q20 2Q20 3Q20 4Q20 2020
Cards
(1)
$ 8,419 $ 4,456 $ (407) $ 12,468 $ 2,412 $ 1,911 $ 55 $ (79) $ 4,299 $ 38 $ 16,805 10.98 %
All other GCB 1,200 566 (36) 1,730 399 388 (21) (114) 652 37 2,419
Global
Consumer
Banking $ 9,619 $ 5,022 $ (443) $ 14,198 $ 2,811 $ 2,299 $ 34 $ (193) $ 4,951 $ 75 $ 19,224 6.81 %
Institutional
Clients Group 2,886 (721) — 2,165 1,316 3,370 106 (1,620) 3,172 65 5,402 1.42
Corporate/
Other 278 (100) — 178 191 160 (128) (35) 188 (36) 330
Allowance for
credit losses on
loans (ACLL) $ 12,783 $ 4,201 $ (443) $ 16,541 $ 4,318 $ 5,829 $ 12
$ (1,848)
$ 8,311 $ 104 $ 24,956 3.73 %
Allowance for
credit losses on
unfunded
lending
commitments 1,456 (194) — 1,262 557 113 424 352 1,446 (53) 2,655
Other — 96 — 96 2 79 (32) (38) 11 39 146
Total
allowance for
credit losses
(ACL) $ 14,239 $ 4,103 $ (443) $ 17,899 $ 4,877 $ 6,021 $ 404
$ (1,534)
$ 9,768 $ 90 $ 27,757
(1) See Note 1 to the Consolidated Financial Statements.
(2) As of December 31, 2020, in North America GCB, Citi-branded cards ACLL/EOP loans was 10.0% and Citi retail services ACLL/EOP loans was 13.6%.
Certain Key Government Actions in Support of the
Economy
U.S. Government-Sponsored Liquidity Programs
During the first quarter of 2020, the Federal Reserve Board
(FRB) introduced several liquidity facilities in response to the
funding market volatility caused by the pandemic. Citi has
participated in several of the U.S. government-sponsored
liquidity programs, including the Money Market Mutual Fund
Liquidity Facility (MMLF), the Primary Dealer Credit Facility
(PDCF) and Discount Window (DW) in order to facilitate
client activity and support the FRB actions to provide
additional liquidity into the market. Citi has also participated
in the Paycheck Protection Program Lending Facility
(PPPLF), which was established to facilitate lending under the
Small Business Administration’s (SBA’s) Paycheck Protection
Program (see “Small Business Administration’s Paycheck
Protection Program” below). The amounts Citi sourced from
these facilities were not significant to Citi’s overall liquidity
profile during 2020, which remains strong and highly liquid.
For additional information about Citi’s liquidity resources, see
“Managing Global Risk—Liquidity Risk” below.
U.S. Banking Agencies Regulatory Capital Relief
In response to the pandemic, throughout 2020, the U.S.
banking agencies issued several final rules and interim final
rules revising the current regulatory capital standards, to
provide banking organizations with additional flexibility to
support consumers and businesses. Those rules applicable to
Citi include:
• Easing of capital distribution limits in the event of
regulatory capital buffer breaches, which provides some
flexibility to continue distributing capital under certain
circumstances.
• Modification of the CECL transition provision to defer
the January 1, 2020 capital impact to January 1, 2022 and
to provide additional capital relief for ongoing increases
in credit reserves. Citi’s reported Common Equity Tier 1
Capital ratio at December 31, 2020, reflecting the
modified CECL transition provision, was 39 basis points
12

higher than Citi’s Common Equity Tier 1 Capital ratio,
reflecting the full impact of CECL on regulatory capital.
Excluding the modified CECL transition provision,
Citigroup’s Common Equity Tier 1 Capital ratio would
have been 11.34%, compared with a 10.0% effective
minimum requirement.
• Temporary Supplementary Leverage ratio (SLR) relief for
bank holding companies, commencing in the second
quarter of 2020, allowing Citigroup to temporarily expand
its balance sheet by excluding U.S. Treasury securities
and deposits with the FRB from the SLR denominator.
Citigroup’s reported Supplementary Leverage ratio of
7.00% benefited by 109 basis points during the fourth
quarter of 2020 as a result of the temporary relief.
Excluding the temporary relief, Citigroup’s
Supplementary Leverage ratio would have been 5.91%,
compared with a 5.0% effective minimum requirement.
• Assigning a 0% risk weight to loans originated under the
Paycheck Protection Program.
For additional information about regulatory capital relief
provided by the U.S. banking agencies, see “Capital
Resources” below.
Troubled Debt Restructuring (TDR) Relief
Under U.S. GAAP, banks are required to assess modifications
to a loan’s terms for potential classification as a TDR. A loan
to a borrower experiencing financial difficulty is classified as
a TDR when a lender grants a concession that it would
otherwise not consider, such as a payment deferral or interest
concession.
In order to encourage banks to work with impacted
borrowers, the Coronavirus Aid, Relief, and Economic
Security Act (CARES Act) and U.S. banking agencies have
provided relief from TDR accounting. The main benefits of
TDR relief include a capital benefit in the form of reduced
risk-weighted assets, as TDRs are more heavily risk-weighted
for capital purposes; aging of the loans is frozen, i.e., they will
continue to be reported in the same delinquency bucket they
were in at the time of modification; and the loans are generally
not reported as non-accrual during the modification period.
The loans included in Citi’s pandemic-related consumer relief
programs are included in Citi’s reserving process under the
CECL standard.
Small Business Administration’s Paycheck Protection
Program
The Paycheck Protection Program (PPP) authorizes the
origination of forgivable loans for small businesses to pay
their employees during the pandemic. Loan terms are the same
for all businesses. During the first round of PPP, which was
launched in April 2020, Citi funded over 30,000 loans totaling
$3.8 billion as of December 31, 2020, with approximately $3.4
billion outstanding at December 31, 2020. The processing of
loan forgiveness requests under PPP began during the third
quarter of 2020 and Citi received approximately $314 million
of funds from the SBA relating to forgiveness in the fourth
quarter of 2020. Citi is currently participating in the relaunch
of PPP and remains committed to supporting small businesses.
Pandemic and Other Impacts
In 2021, Citi expects overall revenues to decline from 2020,
largely driven by normalization in the ICG markets
businesses. In addition, GCB, ICG and Corporate/Other
revenues will likely continue to be adversely impacted by the
lower global interest rate environment, and GCB and ICG
revenues will be affected by the challenges and uncertainties
in the macroeconomic and market environment, including as a
result of the continued severity and duration of the pandemic.
Each GCB region is also expected to continue to experience
the adverse impacts the pandemic has had on customer
activity, while Latin America GCB is also likely to continue to
experience an impact from macroeconomic weakness in
Mexico.
Citi also expects to incur higher expenses, as it continues
to accelerate the transformation of its infrastructure, risk
management and controls, including its efforts to improve the
risk and control environment, as well as to comply with the
consent orders (see “Citi’s Consent Order Compliance”
above).
Moreover, based on its existing portfolios as of December
31, 2020, Citi expects to experience higher net credit losses,
which will vary by business and region and be dependent on
future macroeconomic conditions. Citi believes that these
losses are adequately reserved for under the CECL standard at
December 31, 2020. Citi expects international consumer losses
to peak during the first half of 2021, while in the U.S., losses
could begin to rise in 2021 but peak afterward. If Citi’s fourth
quarter of 2020 macroeconomic forecast assumptions are
realized, Citi would not expect additional reserve builds on its
existing portfolios (for additional information, see “Significant
Accounting Policies and Significant Estimates” below);
however, the overall level of reserves remains dependent on
the evolving economic and public health environments relative
to this forecast, as well as new lending volumes.
For additional information about material risks to Citi
from the pandemic and other macroeconomic challenges and
uncertainties, see “Risk Factors” below.
13

RESULTS OF OPERATIONS
SUMMARY OF SELECTED FINANCIAL DATA
Citigroup Inc. and Consolidated Subsidiaries
In millions of dollars, except per share amounts
2020 2019 2018 2017 2016
Net interest revenue $ 43,548 $ 47,347 $ 46,562 $ 45,061 $ 45,476
Non-interest revenue 30,750 26,939 26,292 27,383 25,321
Revenues, net of interest expense $ 74,298 $ 74,286 $ 72,854 $ 72,444 $ 70,797
Operating expenses 43,171 42,002 41,841 42,232 42,338
Provisions for credit losses and for benefits and claims 17,495 8,383 7,568 7,451 6,982
Income from continuing operations before income taxes $ 13,632 $ 23,901 $ 23,445 $ 22,761 $ 21,477
Income taxes
(1)
2,525 4,430 5,357 29,388 6,444
Income (loss) from continuing operations $ 11,107 $ 19,471 $ 18,088 $ (6,627) $ 15,033
Income (loss) from discontinued operations, net of taxes (20) (4) (8) (111) (58)
Net income (loss) before attribution of noncontrolling
interests $ 11,087 $ 19,467 $ 18,080 $ (6,738) $ 14,975
Net income attributable to noncontrolling interests 40 66 35 60 63
Citigroup’s net income (loss)
(1)
$ 11,047 $ 19,401 $ 18,045 $ (6,798) $ 14,912
Earnings per share
Basic
Income (loss) from continuing operations $ 4.75 $ 8.08 $ 6.69 $ (2.94) $ 4.74
Net income (loss) 4.74 8.08 6.69 (2.98) 4.72
Diluted
Income (loss) from continuing operations $ 4.73 $ 8.04 $ 6.69 $ (2.94) $ 4.74
Net income (loss) 4.72 8.04 6.68 (2.98) 4.72
Dividends declared per common share 2.04 1.92 1.54 0.96 0.42
Common dividends $ 4,299 $ 4,403 $ 3,865 $ 2,595 $ 1,214
Preferred dividends 1,095 1,109 1,174 1,213 1,077
Common share repurchases 2,925 17,875 14,545 14,538 9,451
Table continues on the next page, including footnotes.
14

SUMMARY OF SELECTED FINANCIAL DATA
(Continued)
Citigroup Inc. and Consolidated Subsidiaries
In millions of dollars, except per share amounts, ratios and direct staff
2020 2019 2018 2017 2016
At December 31:
Total assets $ 2,260,090 $ 1,951,158 $ 1,917,383 $ 1,842,465 $ 1,792,077
Total deposits 1,280,671 1,070,590 1,013,170 959,822 929,406
Long-term debt 271,686 248,760 231,999 236,709 206,178
Citigroup common stockholders’ equity
(1)
179,962 175,262 177,760 181,487 205,867
Total Citigroup stockholders’ equity
(1)
199,442 193,242 196,220 200,740 225,120
Average assets 2,226,256 1,978,805 1,920,242 1,875,438 1,808,728
Direct staff (in thousands) 210 200 204 209 219
Performance metrics
Return on average assets 0.50 % 0.98 % 0.94 % (0.36) % 0.82 %
Return on average common stockholders’ equity
(1)(2)
5.7 10.3 9.4 (3.9) 6.6
Return on average total stockholders’ equity
(1)(2)
5.7 9.9 9.1 (3.0) 6.5
Return on tangible common equity (RoTCE)
(1)(3)
6.6 12.1 11.0 8.1 7.6
Efficiency ratio (total operating expenses/total revenues, net) 58.1 56.5 57.4 58.3 59.8
Basel III ratios
(1)(4)
Common Equity Tier 1 Capital
(5)
11.73 % 11.79 % 11.86 % 12.36 % 12.57 %
Tier 1 Capital
(5)
13.31 13.33 13.43 14.06 14.24
Total Capital
(5)
15.61 15.87 16.14 16.30 16.24
Supplementary Leverage ratio 7.00 6.20 6.40 6.68 7.22
Citigroup common stockholders’ equity to assets
(1)
7.96 % 8.98 % 9.27 % 9.85 % 11.49 %
Total Citigroup stockholders’ equity to assets
(1)
8.82 9.90 10.23 10.90 12.56
Dividend payout ratio
(6)
43 24 23 NM 9
Total payout ratio
(7)
73 122 109 NM 77
Book value per common share
(1)
$ 86.43 $ 82.90 $ 75.05 $ 70.62 $ 74.26
Tangible book value (TBV) per share
(1)(3)
73.67 70.39 63.79 60.16 64.57
(1) 2017 includes the one-time impact related to enactment of the Tax Cuts and Jobs Act (Tax Reform). 2020, 2019 and 2018 reflect the tax rate structure post Tax
Reform. RoTCE for 2017 excludes the one-time impact from Tax Reform and is a non-GAAP financial measure. For additional information, see “Significant
Accounting Policies and Significant Estimates—Income Taxes” below.
(2) The return on average common stockholders’ equity is calculated using net income less preferred stock dividends divided by average common stockholders’
equity. The return on average total Citigroup stockholders’ equity is calculated using net income divided by average Citigroup stockholders’ equity.
(3) RoTCE and TBV are non-GAAP financial measures. For information on RoTCE and TBV, see “Capital Resources—Tangible Common Equity, Book Value Per
Share, Tangible Book Value Per Share and Returns on Equity” below.
(4) Citi’s risk-based capital and leverage ratios for 2017 and 2016 are non-GAAP financial measures, which reflect full implementation of regulatory capital
adjustments and deductions prior to the effective date of January 1, 2018.
(5) Citi’s reportable Common Equity Tier 1 Capital, Tier 1 Capital and Total Capital as of December 31, 2020 were derived under the Basel III Advanced Approaches
frameworks, whereas Citi’s reportable Common Equity Tier 1 Capital and Tier 1 Capital ratios were the lower derived under the Basel III Standardized Approach
and the reportable Total Capital ratio was the lower derived under the Basel III Advanced Approaches framework as of December 31, 2019 and 2018.
(6) Dividends declared per common share as a percentage of net income per diluted share.
(7) Total common dividends declared plus common share repurchases as a percentage of net income available to common shareholders (Net income, less preferred
dividends). See “Consolidated Statement of Changes in Stockholders’ Equity,” Note 10 to the Consolidated Financial Statements and “Equity Security
Repurchases” below for the component details.
NM Not meaningful
15

SEGMENT AND BUSINESS—INCOME (LOSS) AND REVENUES
CITIGROUP INCOME
In millions of dollars
2020 2019 2018
% Change
2020 vs. 2019
% Change
2019 vs. 2018
Income (loss) from continuing operations
Global Consumer Banking
North America $ 59 $ 3,224 $ 3,087 (98) % 4 %
Latin America 277 901 802 (69) 12
Asia
(1)
538 1,577 1,420 (66) 11
Total $ 874 $ 5,702 $ 5,309 (85) % 7 %
Institutional Clients Group
North America $ 3,461 $ 3,511 $ 3,675 (1) % (4) %
EMEA 3,327 3,867 3,889 (14) (1)
Latin America 1,406 2,111 2,013 (33) 5
Asia 3,604 3,455 2,997 4 15
Total $ 11,798 $ 12,944 $ 12,574 (9) % 3 %
Corporate/Other (1,565) 825 205 NM NM
Income from continuing operations $ 11,107 $ 19,471 $ 18,088 (43) % 8 %
Discontinued operations $ (20) $ (4) $ (8) NM 50 %
Less: Net income attributable to noncontrolling interests 40 66 35 (39) % 89
Citigroup’s net income $ 11,047 $ 19,401 $ 18,045 (43) % 8 %
(1) Asia GCB includes the results of operations of GCB activities in certain EMEA countries.
NM Not meaningful
CITIGROUP REVENUES
In millions of dollars
2020 2019 2018
% Change
2020 vs. 2019
% Change
2019 vs. 2018
Global Consumer Banking
North America $ 19,148 $ 20,398 $ 19,829 (6) % 3 %
Latin America 4,372 5,238 5,309 (17) (1)
Asia
(1)
6,471 7,335 7,201 (12) 2
Total $ 29,991 $ 32,971 $ 32,339 (9) % 2 %
Institutional Clients Group
North America $ 17,185 $ 13,459 $ 13,522 28 % — %
EMEA 12,814 12,006 11,770 7 2
Latin America 4,838 5,166 4,954 (6) 4
Asia 9,416 8,670 8,079 9 7
Total $ 44,253 $ 39,301 $ 38,325 13 % 3 %
Corporate/Other 54 2,014 2,190 (97) (8)
Total Citigroup net revenues $ 74,298 $ 74,286 $ 72,854 — % 2 %
(1) Asia GCB includes the results of operations of GCB activities in certain EMEA countries.
16
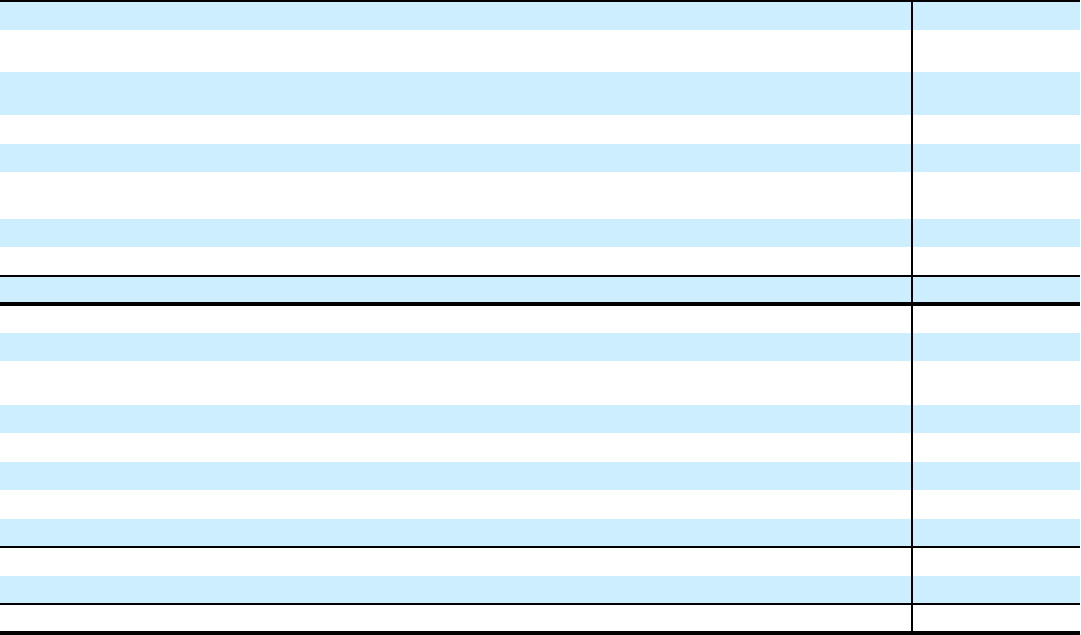
SEGMENT BALANCE SHEET
(1)
—DECEMBER 31, 2020
In millions of dollars
Global
Consumer
Banking
Institutional
Clients
Group
Corporate/
Other
and
consolidating
eliminations
(2)
Citigroup
parent
company-
issued
long-term
debt and
stockholders’
equity
(3)
Total
Citigroup
consolidated
Assets
Cash and deposits with banks, net of
allowance $ 7,445 $ 89,503 $ 212,667 $ — $ 309,615
Securities borrowed and purchased under
agreements to resell, net of allowance 201 294,258 253 — 294,712
Trading account assets 1,948 360,131 13,000 — 375,079
Investments, net of allowance 1,310 136,105 309,944 — 447,359
Loans, net of unearned income and allowance
for credit losses on loans 262,876 381,598 6,453 — 650,927
Other assets, net of allowance 39,716 99,348 43,334 — 182,398
Net inter-segment liquid assets
(4)
120,077 368,902 (488,979) — —
Total assets $ 433,573 $ 1,729,845 $ 96,672 $ — $ 2,260,090
Liabilities and equity
Total deposits $ 344,500 $ 924,300 $ 11,871 $ — $ 1,280,671
Securities loaned and sold under agreements
to repurchase 685 198,828 12 — 199,525
Trading account liabilities 1,322 165,500 1,205 — 168,027
Short-term borrowings — 25,507 4,007 — 29,514
Long-term debt
(3)
1,268 74,799 25,056 170,563 271,686
Other liabilities, net of allowance 21,422 74,573 14,472 — 110,467
Net inter-segment funding (lending)
(3)
64,376 266,338 39,291 (370,005) —
Total liabilities $ 433,573 $ 1,729,845 $ 95,914 $ (199,442) $ 2,059,890
Total stockholders’ equity
(5)
— — 758 199,442 200,200
Total liabilities and equity $ 433,573 $ 1,729,845 $ 96,672 $ — $ 2,260,090
(1) The supplemental information presented in the table above reflects Citigroup’s consolidated GAAP balance sheet by reporting segment. The respective segment
information depicts the assets and liabilities managed by each segment.
(2) Consolidating eliminations for total Citigroup and Citigroup parent company assets and liabilities are recorded within Corporate/Other.
(3) Total stockholders’ equity and the majority of long-term debt of Citigroup are reflected on the Citigroup parent company balance sheet. Citigroup allocates
stockholders’ equity and long-term debt to its businesses through inter-segment allocations as shown above.
(4) Represents the attribution of Citigroup’s liquid assets (primarily consisting of cash, marketable equity securities and available-for-sale debt securities) to the
various businesses based on Liquidity Coverage Ratio (LCR) assumptions.
(5) Corporate/Other equity represents noncontrolling interests.
17

GLOBAL CONSUMER BANKING
Global Consumer Banking (GCB) consists of consumer banking businesses in North America, Latin America (consisting of Citi’s
consumer banking business in Mexico) and Asia. GCB provides traditional banking services to retail customers through retail banking,
Citi-branded cards and, in the U.S., Citi retail services (for additional information on these businesses, see “Citigroup Segments”
above). GCB is focused on its priority markets in the U.S., Mexico and Asia, with 2,303 branches in 19 countries and jurisdictions as
of December 31, 2020. At December 31, 2020, GCB had $434 billion in assets and $344.5 billion in retail banking deposits.
GCB’s strategy is to leverage its global footprint and digital capabilities to develop multi-product relationships with customers—
both in and out of Citi’s branch footprint. To achieve this, GCB strives to optimize its clients’ experiences across lending, payments
and wealth management through continued digitization, new partnerships and innovation.
In millions of dollars, except as otherwise noted
2020 2019 2018
% Change
2020 vs. 2019
% Change
2019 vs. 2018
Net interest revenue $ 26,200 $ 28,205 $ 27,374 (7) % 3 %
Non-interest revenue 3,791 4,766 4,965 (20) (4)
Total revenues, net of interest expense $ 29,991 $ 32,971 $ 32,339 (9) % 2 %
Total operating expenses $ 17,203 $ 17,628 $ 17,786 (2) % (1) %
Net credit losses on loans $ 6,646 $ 7,382 $ 6,884 (10) % 7 %
Credit reserve build for loans 4,951 439 568 NM (23)
Provision for credit losses on unfunded lending commitments — 1 — (100) 100
Provisions for benefits and claims, HTM debt securities and
other assets 105 73 103 44 (29)
Provisions for credit losses and for benefits and claims (PBC) $ 11,702 $ 7,895 $ 7,555 48 % 5 %
Income from continuing operations before taxes $ 1,086 $ 7,448 $ 6,998 (85) % 6 %
Income taxes 212 1,746 1,689 (88) 3
Income from continuing operations $ 874 $ 5,702 $ 5,309 (85) % 7 %
Noncontrolling interests (4) 6 7 NM (14)
Net income $ 878 $ 5,696 $ 5,302 (85) % 7 %
Balance Sheet data and ratios
EOP assets (in billions of dollars) $ 434 $ 407 $ 388 7 % 5 %
Average assets (in billions of dollars) 426 389 378 10 3
Return on average assets 0.21 % 1.46 % 1.40 %
Efficiency ratio 57 53 55
Average retail banking deposits (in billions of dollars) $ 311 $ 277 $ 269 12 3
Net credit losses as a percentage of average loans 2.39 % 2.60 % 2.48 %
Revenue by business
Retail banking $ 11,734 $ 12,549 $ 12,627 (6) % (1) %
Cards
(1)
18,257 20,422 19,712 (11) 4
Total $ 29,991 $ 32,971 $ 32,339 (9) % 2 %
Income from continuing operations by business
Retail banking $ 744 $ 1,842 $ 1,851 (60) % — %
Cards
(1)
130 3,860 3,458 (97) 12
Total $ 874 $ 5,702 $ 5,309 (85) % 7 %
Table continues on the next page, including footnotes.
18

Foreign currency (FX) translation impact
Total revenue—as reported $ 29,991 $ 32,971 $ 32,339 (9) % 2 %
Impact of FX translation
(2)
— (509) (664)
Total revenues—ex-FX
(3)
$ 29,991 $ 32,462 $ 31,675 (8) % 2 %
Total operating expenses—as reported $ 17,203 $ 17,628 $ 17,786 (2) % (1) %
Impact of FX translation
(2)
— (276) (371)
Total operating expenses—ex-FX
(3)
$ 17,203 $ 17,352 $ 17,415 (1) % — %
Total provisions for credit losses and PBC—as reported $ 11,702 $ 7,895 $ 7,555 48 % 5 %
Impact of FX translation
(2)
— (124) (161)
Total provisions for credit losses and PBC—ex-FX
(3)
$ 11,702 $ 7,771 $ 7,394 51 % 5 %
Net income—as reported $ 878 $ 5,696 $ 5,302 (85) % 7 %
Impact of FX translation
(2)
— (74) (90)
Net income—ex-FX
(3)
$ 878 $ 5,622 $ 5,212 (84) % 8 %
(1) Includes both Citi-branded cards and Citi retail services.
(2) Reflects the impact of FX translation into U.S. dollars at the 2020 average exchange rates for all periods presented.
(3) Presentation of this metric excluding FX translation is a non-GAAP financial measure.
NM Not meaningful
19

NORTH AMERICA GCB
North America GCB provides traditional retail banking and Citi-branded and Citi retail services card products to retail and small
business customers in the U.S. North America GCB’s U.S. cards product portfolio includes its proprietary portfolio (including the Citi
Double Cash, Thank You and Value cards) and co-branded cards (including, among others, American Airlines and Costco) within
Citi-branded cards, as well as its co-brand and private label relationships (including, among others, Sears, The Home Depot, Best Buy
and Macy’s) within Citi retail services.
At December 31, 2020, North America GCB had 687 retail bank branches concentrated in the six key metropolitan areas of New
York, Chicago, Miami, Washington, D.C., Los Angeles and San Francisco. Also as of December 31, 2020, North America GCB had
$52.7 billion in retail banking loans and $194.8 billion in retail banking deposits. In addition, North America GCB had $130.4 billion
in outstanding card loan balances.
In millions of dollars, except as otherwise noted
2020 2019 2018
% Change
2020 vs. 2019
% Change
2019 vs. 2018
Net interest revenue $ 18,802 $ 19,869 $ 19,006 (5) % 5 %
Non-interest revenue
(1)
346 529 823 (35) (36)
Total revenues, net of interest expense $ 19,148 $ 20,398 $ 19,829 (6) % 3 %
Total operating expenses $ 9,942 $ 10,154 $ 10,230 (2) % (1) %
Net credit losses on loans $ 4,990 $ 5,583 $ 5,085 (11) % 10 %
Credit reserve build for loans 4,115 469 460 NM 2
Provision for credit losses on unfunded lending commitments — 1 — (100) 100
Provisions for benefits and claims, HTM debt securities and
other assets 17 19 22 (11) (14)
Provisions for credit losses and for benefits and claims $ 9,122 $ 6,072 $ 5,567 50 % 9 %
Income from continuing operations before taxes $ 84 $ 4,172 $ 4,032 (98) % 3 %
Income taxes 25 948 945 (97) —
Income from continuing operations $ 59 $ 3,224 $ 3,087 (98) % 4 %
Noncontrolling interests — — — — —
Net income $ 59 $ 3,224 $ 3,087 (98) % 4 %
Balance Sheet data and ratios
Average assets (in billions of dollars) $ 266 $ 232 $ 227 15 % 2 %
Return on average assets 0.02 % 1.39 % 1.36 %
Efficiency ratio 52 50 52
Average retail banking deposits (in billions of dollars) $ 176 $ 153 $ 148 15 3
Net credit losses as a percentage of average loans 2.72 % 2.97 % 2.78 %
Revenue by business
Retail banking $ 4,457 $ 4,529 $ 4,600 (2) % (2) %
Citi-branded cards 8,758 9,165 8,628 (4) 6
Citi retail services 5,933 6,704 6,601 (12) 2
Total $ 19,148 $ 20,398 $ 19,829 (6) % 3 %
Income (loss) from continuing operations by business
Retail banking $ (144) $ 196 $ 312 NM (37) %
Citi-branded cards 21 1,742 1,581 (99) % 10
Citi retail services 182 1,286 1,194 (86) 8
Total $ 59 $ 3,224 $ 3,087 (98) % 4 %
(1) 2018 includes an approximate $150 million gain on the Hilton portfolio sale.
NM Not meaningful
20
2020 vs. 2019
Net income decreased 98%, as significantly higher cost of
credit and lower revenues were partially offset by lower
expenses.
Revenues decreased 6%, reflecting lower revenues in Citi
retail services, Citi-branded cards and retail banking, primarily
due to the pandemic, including lower interest rates.
Retail banking revenues decreased 2%, as the benefit of
stronger deposit volumes and an improvement in mortgage
revenues were more than offset by lower deposit spreads,
reflecting lower interest rates.
Average deposits increased 15%, driven by a combination
of factors, including government stimulus payments, a
reduction in overall consumer spending related to the
pandemic and strategic efforts to drive organic growth,
including digital deposits which drove more than one-third of
the year-over-year growth.
Cards revenues decreased 7%. Citi-branded cards
revenues decreased 4%, reflecting lower purchase sales and
higher payment rates driving lower average loans. Average
loans decreased 6% and purchase sales decreased 8%, both
reflecting the impact of the pandemic on customer activity.
Citi retail services revenues decreased 12%, primarily
reflecting lower average loans and higher contractual partner
payments. (For additional information on partner payments,
see Note 5 to the Consolidated Financial Statements.) Average
loans were down 7% and purchase sales declined 11%, both
reflecting the impact of the pandemic on customer activity.
Expenses decreased 2%, as lower volume-related
expenses, reductions in marketing and other discretionary
expenses, as well as efficiency savings, more than offset
higher pandemic-related expenses.
Provisions of $9.1 billion increased 50% from the prior
year, driven by a higher allowance for credit losses (ACL)
build, partially offset by lower net credit losses. Net credit
losses decreased 11%, primarily driven by lower net credit
losses in Citi retail services (down 16% to $2.2 billion) and
Citi-branded cards (down 5% to $2.7 billion), primarily
reflecting lower loan volumes as well as higher payment rates
given high levels of liquidity, lower spending and the benefits
of relief programs.
The ACL build of $4.1 billion (compared to a build of
$470 million in the prior year under prior accounting
standards) was driven by builds during the first half of 2020.
The builds reflected the impact of a deterioration in Citi’s
macroeconomic outlook under the CECL standard, including
an increase in the qualitative management adjustment to
reflect the potential for a higher level of stress and a slower
economic recovery, partially offset by lower loan volumes,
both primarily driven by the pandemic. For additional
information on Citi’s ACL, see “Significant Accounting
Policies and Significant Estimates” below and Notes 1 and 15
to the Consolidated Financial Statements.
For additional information on North America GCB’s retail
banking, and its Citi-branded cards and Citi retail services
portfolios, see “Credit Risk—Consumer Credit” below.
For additional information about trends, uncertainties and
risks related to North America GCB’s future results, see
“COVID-19 Pandemic Overview” above and “Risk Factors”
below.
21

LATIN AMERICA GCB
Latin America GCB provides traditional retail banking and Citi-branded card products to retail and small business customers in
Mexico through Citibanamex, one of Mexico’s largest banks.
At December 31, 2020, Latin America GCB had 1,392 retail branches in Mexico, with $9.8 billion in retail banking loans and
$25.8 billion in deposits. In addition, the business had $4.8 billion in outstanding card loan balances.
In millions of dollars, except as otherwise noted
2020 2019 2018
% Change
2020 vs. 2019
% Change
2019 vs. 2018
Net interest revenue $ 3,078 $ 3,639 $ 3,681 (15) % (1) %
Non-interest revenue
(1)
1,294 1,599 1,628 (19) (2)
Total revenues, net of interest expense $ 4,372 $ 5,238 $ 5,309 (17) % (1) %
Total operating expenses $ 2,730 $ 2,883 $ 2,900 (5) % (1) %
Net credit losses on loans $ 866 $ 1,109 $ 1,131 (22) % (2) %
Credit reserve build (release) for loans 316 (38) 84 NM NM
Provision for credit losses on unfunded lending commitments — — — — —
Provisions for benefits and claims, HTM debt securities and
other assets 87 54 81 61 (33)
Provisions for credit losses and for benefits and claims (PBC) $ 1,269 $ 1,125 $ 1,296 13 % (13) %
Income from continuing operations before taxes $ 373 $ 1,230 $ 1,113 (70) % 11 %
Income taxes 96 329 311 (71) 6
Income from continuing operations $ 277 $ 901 $ 802 (69) % 12 %
Noncontrolling interests — — — — —
Net income $ 277 $ 901 $ 802 (69) % 12 %
Balance Sheet data and ratios
Average assets (in billions of dollars) $ 32 $ 35 $ 33 (9) % 6 %
Return on average assets 0.87 % 2.57 % 2.43 %
Efficiency ratio 62 55 55
Average deposits (in billions of dollars) $ 23 $ 23 $ 23 — —
Net credit losses as a percentage of average loans 5.97 % 6.45 % 6.50 %
Revenue by business
Retail banking $ 3,009 $ 3,585 $ 3,744 (16) % (4) %
Citi-branded cards 1,363 1,653 1,565 (18) 6
Total $ 4,372 $ 5,238 $ 5,309 (17) % (1) %
Income from continuing operations by business
Retail banking $ 153 $ 600 $ 596 (75) % 1 %
Citi-branded cards 124 301 206 (59) 46
Total $ 277 $ 901 $ 802 (69) % 12 %
FX translation impact
Total revenues—as reported
(1)
$ 4,372 $ 5,238 $ 5,309 (17) % (1) %
Impact of FX translation
(2)
— (473) (511)
Total revenues—ex-FX
(3)
$ 4,372 $ 4,765 $ 4,798 (8) % (1) %
Total operating expenses—as reported $ 2,730 $ 2,883 $ 2,900 (5) % (1) %
Impact of FX translation
(2)
— (246) (253)
Total operating expenses—ex-FX
(3)
$ 2,730 $ 2,637 $ 2,647 4 % — %
Provisions for credit losses and PBC—as reported $ 1,269 $ 1,125 $ 1,296 13 % (13) %
Impact of FX translation
(2)
— (115) (136)
Provisions for credit losses and PBC—ex-FX
(3)
$ 1,269 $ 1,010 $ 1,160 26 % (13) %
Net income—as reported $ 277 $ 901 $ 802 (69) % 12 %
Impact of FX translation
(2)
— (78) (87)
Net income—ex-FX
(3)
$ 277 $ 823 $ 715 (66) % 15 %
(1) 2018 includes an approximate $250 million gain on the sale of an asset management business. See Note 2 to the Consolidated Financial Statements.
(2) Reflects the impact of FX translation into U.S. dollars at the 2020 average exchange rates for all periods presented.
(3) Presentation of this metric excluding FX translation is a non-GAAP financial measure.
NM Not meaningful
22
The discussion of the results of operations for Latin America GCB below excludes the impact of FX translation for all periods
presented. Presentations of the results of operations, excluding the impact of FX translation, are non-GAAP financial measures. For a
reconciliation of certain of these metrics to the reported results, see the table above.
2020 vs. 2019
Net income decreased 66%, reflecting lower revenues, higher
cost of credit and higher expenses.
Revenues decreased 8%, reflecting lower retail banking
and cards revenues, largely due to the pandemic, including
lower interest rates. Revenues also decreased due to the
ongoing slowdown in overall economic growth and industry
volumes in Mexico.
Retail banking revenues decreased 8%, driven by a
decline in loan volumes and lower deposit spreads, partially
offset by deposit growth and an increase in assets under
management. Average deposits were up 10%, while average
loans decreased 5%, reflecting the impact of the pandemic on
customer activity, as well as the ongoing economic slowdown.
Assets under management increased 12%, including the
benefit of market movements.
Cards revenues decreased 10%, primarily driven by lower
purchase sales (down 17%) and lower average loans (down
8%), reflecting the impact of the pandemic on customer
activity and the ongoing economic slowdown.
Expenses increased 4%, as efficiency savings were more
than offset by repositioning costs, pandemic-related expenses,
and ongoing investment spending.
Provisions of $1.3 billion increased 26% from the prior
year, driven by a higher allowance for credit losses (ACL)
build, partially offset by lower net credit losses. Net credit
losses decreased 14%, primarily driven by lower average loans
and the impact of consumer relief programs.
The ACL build of $316 million (compared to a net
reserve release of $35 million in the prior year under prior
accounting standards) was driven by builds during the first
half of 2020. The builds reflected the impact of a deterioration
in Citi’s macroeconomic outlook under the CECL standard,
including an increase in the qualitative management
adjustment to reflect the potential for a higher level of stress
and a slower economic recovery, partially offset by lower loan
volumes, both primarily driven by the pandemic. For
additional information on Citi’s ACL, see “Significant
Accounting Policies and Significant Estimates” below and
Notes 1 and 15 to the Consolidated Financial Statements.
For additional information on Latin America GCB’s retail
banking and its Citi-branded cards portfolios, see “Credit Risk
—Consumer Credit” below.
For additional information about trends, uncertainties and
risks related to Latin America GCB’s future results, see
“COVID-19 Pandemic Overview” above and “Risk Factors”
below.
23

ASIA GCB
Asia GCB provides traditional retail banking and Citi-branded card products to retail and small business customers. During 2020, Asia
GCB’s most significant revenues in Asia were from Hong Kong, Singapore, South Korea, Taiwan, India, Australia, Thailand, the
Philippines, China and Indonesia. Included within Asia GCB, traditional retail banking and Citi-branded card products are also
provided to retail customers in certain EMEA countries, primarily the United Arab Emirates, Poland and Russia.
At December 31, 2020, on a combined basis, the businesses had 224 retail branches, $66.5 billion in retail banking loans and
$123.9 billion in deposits. In addition, the businesses had $17.9 billion in outstanding card loan balances.
In millions of dollars, except as otherwise noted
(1)
2020 2019 2018
% Change
2020 vs. 2019
% Change
2019 vs. 2018
Net interest revenue $ 4,320 $ 4,697 $ 4,687 (8) % — %
Non-interest revenue 2,151 2,638 2,514 (18) 5
Total revenues, net of interest expense $ 6,471 $ 7,335 $ 7,201 (12) % 2 %
Total operating expenses $ 4,531 $ 4,591 $ 4,656 (1) % (1) %
Net credit losses on loans $ 790 $ 690 $ 668 14 % 3 %
Credit reserve build for loans 520 8 24 NM (67)
Provision for HTM debt securities and other assets 1 — — 100 —
Provisions for credit losses $ 1,311 $ 698 $ 692 88 % 1 %
Income from continuing operations before taxes $ 629 $ 2,046 $ 1,853 (69) % 10 %
Income taxes 91 469 433 (81) 8
Income from continuing operations $ 538 $ 1,577 $ 1,420 (66) % 11 %
Noncontrolling interests (4) 6 7 NM (14)
Net income $ 542 $ 1,571 $ 1,413 (65) % 11 %
Balance Sheet data and ratios
Average assets (in billions of dollars) $ 129 $ 122 $ 119 6 % 3 %
Return on average assets 0.42 % 1.29 % 1.19 %
Efficiency ratio 70 63 65
Average deposits (in billions of dollars) $ 113 $ 101 $ 98 12 3
Net credit losses as a percentage of average loans 0.99 % 0.88 % 0.86 %
Revenue by business
Retail banking $ 4,268 $ 4,435 $ 4,283 (4) % 4 %
Citi-branded cards 2,203 2,900 2,918 (24) (1)
Total $ 6,471 $ 7,335 $ 7,201 (12) % 2 %
Income (loss) from continuing operations by business
Retail banking $ 735 $ 1,046 $ 943 (30) % 11 %
Citi-branded cards (197) 531 477 NM 11
Total $ 538 $ 1,577 $ 1,420 (66) % 11 %
FX translation impact
Total revenues—as reported $ 6,471 $ 7,335 $ 7,201 (12) % 2 %
Impact of FX translation
(2)
— (36) (153)
Total revenues—ex-FX
(3)
$ 6,471 $ 7,299 $ 7,048 (11) % 4 %
Total operating expenses—as reported $ 4,531 $ 4,591 $ 4,656 (1) % (1) %
Impact of FX translation
(2)
— (30) (118)
Total operating expenses—ex-FX
(3)
$ 4,531 $ 4,561 $ 4,538 (1) % 1 %
Provisions for credit losses—as reported $ 1,311 $ 698 $ 692 88 % 1 %
Impact of FX translation
(2)
— (9) (25)
Provisions for credit losses—ex-FX
(3)
$ 1,311 $ 689 $ 667 90 % 3 %
Net income—as reported $ 542 $ 1,571 $ 1,413 (65) % 11 %
Impact of FX translation
(2)
— 4 (3)
Net income—ex-FX
(3)
$ 542 $ 1,575 $ 1,410 (66) % 12 %
(1) Asia GCB includes the results of operations of GCB activities in certain EMEA countries for all periods presented.
24
(2) Reflects the impact of FX translation into U.S. dollars at the 2020 average exchange rates for all periods presented.
(3) Presentation of this metric excluding FX translation is a non-GAAP financial measure.
NM Not meaningful
The discussion of the results of operations for Asia GCB below excludes the impact of FX translation for all periods presented.
Presentations of the results of operations, excluding the impact of FX translation, are non-GAAP financial measures. For a
reconciliation of certain of these metrics to the reported results, see the table above.
2020 vs. 2019
Net income decreased 66%, as lower revenues and
significantly higher cost of credit were partially offset by
lower expenses.
Revenues decreased 11%, reflecting lower cards and retail
banking revenues, largely due to the pandemic, including
lower interest rates.
Retail banking revenues decreased 3%, as growth in
deposits and higher fees on investments and foreign currency
transactions due to higher volumes and volatility were more
than offset by lower deposit spreads and lower insurance
revenues. Average deposits increased 11% and average loans
increased 5%. Assets under management increased 5% and
investment sales increased 43%. Retail lending revenues
increased 4%, largely reflecting growth in mortgages and
personal loans, partially offset by spread compression in
personal loans.
Cards revenues decreased 24%, primarily driven by lower
purchase sales (down 16%) and lower average loans (down
8%), reflecting the impact of the pandemic on customer
activity, including from lower travel spend in the region given
Citi’s skew to an affluent client base and a greater proportion
of fee revenues coming from travel-related interchange and
foreign transaction fees.
Expenses decreased 1%, as lower discretionary expenses
and volume-related costs, as well as efficiency savings, were
partially offset by ongoing investment spending.
Provisions of $1.3 billion increased 90%, driven by a
higher allowance for credit losses (ACL) build as well as
higher net credit losses. Net credit losses increased 16%, as
pandemic lockdowns and the deterioration in the macro-
environment impacted credit performance.
The ACL build of $520 million (compared to a build of
$7 million in the prior year under prior accounting standards)
was driven by builds during the first three quarters of 2020.
The builds reflected the impact of a deterioration in Citi’s
macroeconomic outlook under the CECL standard, including
an increase in the qualitative management adjustment to
reflect the potential for a higher level of stress and a slower
economic recovery, partially offset by lower loan volumes,
both primarily driven by the pandemic. For additional
information on Citi’s ACL, see “Significant Accounting
Policies and Significant Estimates” below and Notes 1 and 15
to the Consolidated Financial Statements.
For additional information on Asia GCB’s retail banking
portfolios and its Citi-branded cards portfolios, see “Credit
Risk—Consumer Credit” below.
For additional information about trends, uncertainties and
risks related to Asia GCB’s future results, see “COVID-19
Pandemic Overview” above and “Risk Factors” below.
25
INSTITUTIONAL CLIENTS GROUP
Institutional Clients Group (ICG) includes Banking and
Markets and securities services (for additional information on
these businesses, see “Citigroup Segments” above). ICG
provides corporate, institutional, public sector and high-net-
worth clients around the world with a full range of wholesale
banking products and services, including fixed income and
equity sales and trading, foreign exchange, prime brokerage,
derivative services, equity and fixed income research,
corporate lending, investment banking and advisory services,
private banking, cash management, trade finance and
securities services. ICG transacts with clients in both cash
instruments and derivatives, including fixed income, foreign
currency, equity and commodity products.
ICG revenue is generated primarily from fees and spreads
associated with these activities. ICG earns fee income for
assisting clients with transactional services and clearing and
providing brokerage and investment banking services and
other such activities. Such fees are recognized at the point in
time when Citigroup’s performance under the terms of a
contractual arrangement is completed, which is typically at the
trade/execution date or closing of a transaction. Revenue
generated from these activities is recorded in Commissions
and fees and Investment banking. Revenue is also generated
from assets under custody and administration, which is
recognized as/when the associated promised service is
satisfied, which normally occurs at the point in time the
service is requested by the customer and provided by Citi.
Revenue generated from these activities is primarily recorded
in Administration and other fiduciary fees. For additional
information on these various types of revenues, see Note 5 to
the Consolidated Financial Statements.
In addition, as a market maker, ICG facilitates
transactions, including holding product inventory to meet
client demand, and earns the differential between the price at
which it buys and sells the products. These price differentials
and the unrealized gains and losses on the inventory are
recorded in Principal transactions. Mark-to-market gains and
losses on certain credit derivatives (used to hedge the
corporate loan portfolio) are also recorded in Principal
transactions, (for additional information on Principal
transactions revenue, see Note 6 to the Consolidated Financial
Statements). Other primarily includes realized gains and losses
on available-for-sale (AFS) debt securities, gains and losses on
equity securities not held in trading accounts and other non-
recurring gains and losses. Interest income earned on assets
held, less interest paid on long- and short-term debt and to
customers on deposits, is recorded as Net interest revenue.
The amount and types of Markets revenues are impacted
by a variety of interrelated factors, including market liquidity;
changes in market variables such as interest rates, foreign
exchange rates, equity prices, commodity prices and credit
spreads, as well as their implied volatilities; investor
confidence and other macroeconomic conditions. Assuming
all other market conditions do not change, increases in client
activity levels or bid/offer spreads generally result in increases
in revenues. However, changes in market conditions can
significantly impact client activity levels, bid/offer spreads and
the fair value of product inventory. For example, a decrease in
market liquidity may increase bid/offer spreads, decrease
client activity levels and widen credit spreads on product
inventory positions.
ICG’s management of the Markets businesses involves
daily monitoring and evaluation of the above factors at the
trading desk as well as the country level. ICG does not
separately track the impact on total Markets revenues of the
volume of transactions, bid/offer spreads, fair value changes of
product inventory positions and economic hedges because, as
noted above, these components are interrelated and are not
deemed useful or necessary to manage the Markets businesses
at an aggregate level.
In the Markets businesses, client revenues are those
revenues directly attributable to client transactions at the time
of inception, including commissions, interest or fees earned.
Client revenues do not include the results of client facilitation
activities (e.g., holding product inventory in anticipation of
client demand) or the results of certain economic hedging
activities.
ICG’s international presence is supported by trading
floors in approximately 80 countries and a proprietary network
in 96 countries and jurisdictions. At December 31, 2020, ICG
had $1.7 trillion in assets and $924 billion in deposits, while
two of its businesses—securities services and issuer services
—managed $24.0 trillion and $20.3 trillion in assets under
custody as of December 31, 2020 and 2019, respectively. For
additional information on these operations, see
“Administration and Other Fiduciary Fees” in Note 5 to the
Consolidated Financial Statements.
26

In millions of dollars, except as otherwise noted
2020 2019 2018
% Change
2020 vs. 2019
% Change
2019 vs. 2018
Commissions and fees $ 4,412 $ 4,462 $ 4,651 (1) % (4) %
Administration and other fiduciary fees 2,877 2,756 2,806 4 (2)
Investment banking 5,009 4,440 4,358 13 2
Principal transactions 13,308 8,562 8,742 55 (2)
Other
(1)
1,149 1,829 941 (37) 94
Total non-interest revenue $ 26,755 $ 22,049 $ 21,498 21 % 3 %
Net interest revenue (including dividends) 17,498 17,252 16,827 1 3
Total revenues, net of interest expense $ 44,253 $ 39,301 $ 38,325 13 % 3 %
Total operating expenses $ 23,467 $ 22,224 $ 21,780 6 % 2 %
Net credit losses on loans $ 987 $ 394 $ 208 NM 89 %
Credit reserve build (release) for loans 3,172 71 (109) NM NM
Provision for credit losses on unfunded lending commitments 1,435 98 116 NM (16)
Provisions for credit losses on HTM debt securities and other
assets 21 — — 100 % —
Provisions for credit losses $ 5,615 $ 563 $ 215 NM NM
Income from continuing operations before taxes $ 15,171 $ 16,514 $ 16,330 (8) % 1 %
Income taxes 3,373 3,570 3,756 (6) (5)
Income from continuing operations $ 11,798 $ 12,944 $ 12,574 (9) % 3 %
Noncontrolling interests 50 40 17 25 NM
Net income $ 11,748 $ 12,904 $ 12,557 (9) % 3 %
Balance Sheet data and ratios
EOP assets (in billions of dollars) $ 1,730 $ 1,447 $ 1,438 20 % 1 %
Average assets (in billions of dollars) 1,706 1,493 1,449 14 3
Return on average assets 0.69 % 0.86 % 0.87 %
Efficiency ratio 53 57 57
Revenues by region
North America $ 17,185 $ 13,459 $ 13,522 28 % — %
EMEA 12,814 12,006 11,770 7 2
Latin America 4,838 5,166 4,954 (6) 4
Asia 9,416 8,670 8,079 9 7
Total $ 44,253 $ 39,301 $ 38,325 13 % 3 %
Income from continuing operations by region
North America $ 3,461 $ 3,511 $ 3,675 (1) % (4) %
EMEA 3,327 3,867 3,889 (14) (1)
Latin America 1,406 2,111 2,013 (33) 5
Asia 3,604 3,455 2,997 4 15
Total $ 11,798 $ 12,944 $ 12,574 (9) % 3 %
Average loans by region (in billions of dollars)
North America $ 201 $ 188 $ 174 7 % 8 %
EMEA 88 87 81 1 7
Latin America 39 40 42 (3) (5)
Asia 71 73 77 (3) (5)
Total $ 399 $ 388 $ 374 3 % 4 %
EOP deposits by business (in billions of dollars)
Treasury and trade solutions $ 651 $ 536 $ 509 21 % 5 %
All other ICG businesses 273 232 218 18 6
Total $ 924 $ 768 $ 727 20 % 6 %
(1) 2019 includes an approximate $350 million gain on Citi’s investment in Tradeweb.
NM Not meaningful
27

ICG Revenue Details
In millions of dollars
2020 2019 2018
% Change
2020 vs. 2019
% Change
2019 vs. 2018
Investment banking revenue details
Advisory $ 1,010 $ 1,259 $ 1,301 (20) % (3) %
Equity underwriting 1,593 973 991 64 (2)
Debt underwriting 3,184 2,984 2,719 7 10
Total investment banking $ 5,787 $ 5,216 $ 5,011 11 % 4 %
Treasury and trade solutions 9,524 10,293 9,914 (7) 4
Corporate lending—excluding gains (losses) on loan hedges
(1)
2,184 2,921 2,913 (25) —
Private bank—excluding gains (losses) on loan hedges
(1)
3,737 3,460 3,398 8 2
Total Banking revenues (ex-gains (losses) on loan hedges)
(1)
$ 21,232 $ 21,890 $ 21,236 (3) % 3 %
Gains (losses) on loan hedges
(1)
$ (51) $ (432) $ 45 88 % NM
Total Banking revenues (including gains (losses) on loan
hedges), net of interest expense $ 21,181 $ 21,458 $ 21,281 (1) % 1 %
Fixed income markets
(2)
$ 17,256 $ 12,884 $ 11,661 34 % 10 %
Equity markets 3,624 2,908 3,427 25 (15)
Securities services 2,545 2,631 2,631 (3) —
Other (353) (580) (675) 39 14
Total Markets and securities services revenues, net
of interest expense $ 23,072 $ 17,843 $ 17,044 29 % 5 %
Total revenues, net of interest expense $ 44,253 $ 39,301 $ 38,325 13 % 3 %
Commissions and fees $ 677 $ 782 $ 705 (13) % 11 %
Principal transactions
(3)
11,518 7,661 7,134 50 7
Other
(2)
579 1,117 380 (48) NM
Total non-interest revenue $ 12,774 $ 9,560 $ 8,219 34 % 16 %
Net interest revenue 4,482 3,324 3,442 35 (3)
Total fixed income markets
(4)
$ 17,256 $ 12,884 $ 11,661 34 % 10 %
Rates and currencies $ 12,145 $ 9,225 $ 8,486 32 % 9 %
Spread products/other fixed income 5,111 3,659 3,175 40 15
Total fixed income markets $ 17,256 $ 12,884 $ 11,661 34 % 10 %
Commissions and fees $ 1,245 $ 1,121 $ 1,267 11 % (12) %
Principal transactions
(3)
1,281 775 1,240 65 (38)
Other 322 172 110 87 56
Total non-interest revenue $ 2,848 $ 2,068 $ 2,617 38 % (21) %
Net interest revenue 776 840 810 (8) 4
Total equity markets
(4)
$ 3,624 $ 2,908 $ 3,427 25 % (15) %
(1) Credit derivatives are used to economically hedge a portion of the private bank and corporate loan portfolio that includes both accrual loans and loans at fair value.
Gains (losses) on loan hedges include the mark-to-market on the credit derivatives and the mark-to-market on the loans in the portfolio that are at fair value. The
fixed premium costs of these hedges are netted against the private bank and corporate lending revenues to reflect the cost of credit protection. Gains (losses) on
loan hedges include $(74) million related to the corporate loan portfolio and $23 million related to the private bank for the year ended December 31, 2020. All of
gains (losses) on loan hedges are related to the corporate loan portfolio for the years ended December 31, 2019 and 2018. Citigroup’s results of operations
excluding the impact of gains (losses) on loan hedges are non-GAAP financial measures.
(2) 2019 includes an approximate $350 million gain on Citi’s investment in Tradeweb.
(3) Excludes principal transactions revenues of ICG businesses other than Markets, primarily treasury and trade solutions and the private bank.
(4) Citi assesses its Markets business performance on a total revenue basis, as offsets may occur across revenue line items. For example, securities that generate Net
interest revenue may be risk managed by derivatives that are recorded in Principal transactions revenue. For a description of the composition of these revenue
line items, see Notes 4, 5 and 6 to the Consolidated Financial Statements.
NM Not meaningful
28
The discussion of the results of operations for ICG below excludes (where noted) the impact of gains (losses) on hedges of accrual
loans, which are non-GAAP financial measures. For a reconciliation of these metrics to the reported results, see the table above.
2020 vs. 2019
Net income decreased 9%, as higher revenues were more than
offset by significantly higher credit costs and higher expenses.
Revenues increased 13%, driven by a 29% increase in
Markets and securities services revenues, partially offset by a
1% decrease in Banking revenues (including the impact of
gains (losses) on loan hedges). Excluding the impact of gains
(losses) on loan hedges, Banking revenues declined 3%, as
growth in investment banking and the private bank was more
than offset by a decrease in treasury and trade solutions and
corporate lending. Excluding the pretax gain of approximately
$350 million on Citi’s investment in Tradeweb in the prior
year, Markets and securities services revenues increased 32%,
primarily driven by growth in both fixed income markets and
equity markets, partially offset by a decline in securities
services.
Within Banking:
• Investment banking revenues were up 11%, reflecting
growth in overall market wallet as well as gains in wallet
share. Advisory revenues decreased 20%, primarily
reflecting a decline in the market wallet largely due to the
pandemic and a decline in wallet share. Equity
underwriting revenues increased 64%, reflecting growth
in North America, EMEA and Asia, driven by continued
strength in the market wallet, reflecting improved market
liquidity and investor sentiment as well as wallet share
gains. Debt underwriting revenues increased 7%,
reflecting particular strength in North America, partially
offset by Latin America, primarily driven by an increase
in the second quarter of 2020, as the business assisted
clients with sourcing liquidity. The increase in revenues
was largely driven by a higher market wallet in
investment grade debt underwriting, as well as an increase
in overall wallet share.
• Treasury and trade solutions revenues decreased 7%.
Excluding the impact of FX translation, revenues
decreased 5%, primarily driven by declines in EMEA and
Asia. The decline in revenues was driven by both the cash
and trade businesses. In the cash business, the decline in
revenues reflected lower interest rates and a slowdown in
commercial cards spend driven by the pandemic, partially
offset by strong deposit volumes. Average deposit
balances increased 23% (22% excluding the impact of FX
translation), reflecting strong client engagement and solid
growth across all regions. In trade, revenues were
impacted by a decline in trade fees and trade loans,
reflecting a slowdown in underlying trade flows related to
the pandemic, partially offset by improved trade spreads.
• Corporate lending revenues decreased 15%, including
lower losses on loan hedges. Excluding the impact of
losses on loan hedges, revenues decreased 25%, driven by
lower loan spreads, an adjustment to the residual value of
a lease financing asset and higher hedging costs, partially
offset by higher average loan volumes. Average loans
were up 4%, reflecting higher volumes as the business
assisted clients with sourcing liquidity in the evolving
environment, primarily in the first half of 2020. End-of-
period loans declined 9% in the current year, primarily
reflecting repayments, as Citi’s clients accessed the
capital markets, as well as lower loan demand in the
second half of 2020, given more muted economic activity.
• Private bank revenues increased 9%. Excluding the
impact of gains on loan hedges, revenues increased 8%,
reflecting strength across all regions, driven by continued
solid client engagement, in particular in capital markets,
higher managed investments revenues and higher loan and
deposit volumes, partially offset by lower deposit spreads
due to the low interest rate environment.
Within Markets and securities services:
• Fixed income markets revenues increased 34%. Excluding
the Tradeweb gain in the prior year, revenues increased
38%, reflecting strength across all regions, driven by
strong client activity in rates and currencies, spread
products and commodities, due to the impact of market
conditions, including elevated volatility related to the
pandemic primarily in the first half of the year, and
developments related to vaccines and the U.S. elections in
the second half of the year. Non-interest revenues
increased, reflecting higher corporate and investor
activity, given elevated volumes, spreads and volatility,
primarily in the first half the year. Net interest revenues
also increased, largely reflecting a change in the mix of
trading positions in support of client activity, as well as
lower funding costs.
Rates and currencies revenues increased 32%,
primarily driven by higher G10 rates and currencies
revenues in North America and EMEA, as Citi helped
corporate and investor clients reposition their portfolios in
a volatile market environment driven by the pandemic
largely in the first half of 2020. Spread products and other
fixed income revenues increased 40%, reflecting strong
client activity following robust primary issuance,
particularly in flow trading, as well as a more favorable
market making environment, as evidenced by spread
tightening. Commodities revenues increased, reflecting a
more favorable market making environment, as volatility
remained elevated, particularly in gold and oil.
• Equity markets revenues increased 25%, driven by higher
revenues in cash equities and derivatives, partially offset
by a modest decline in prime finance revenues. Cash
equities revenues increased driven by elevated levels of
client activity. Equity derivatives revenues increased,
reflecting strong client activity and continued market
volatility, particularly in North America. The decline in
prime finance revenues was largely due to lower
financing spreads. Non-interest revenues increased,
primarily driven by higher principal transactions and
commissions and fee revenues, due to higher client
activity and a more favorable trading environment due to
volatility related to the pandemic and developments
29
related to vaccines and U.S. elections, as well as a change
in the mix of trading positions in support of client activity.
• Securities services revenues decreased 3%. Excluding the
impact of FX translation, revenues decreased 1%, as
higher deposit volumes were more than offset by lower
deposit spreads due to the low interest rate environment.
For additional information on trends in ICG’s deposits
and trade loans, see “Managing Global Risk—Liquidity Risk
—Loans” and “—Deposits” below.
Expenses increased 6%, reflecting investments in
infrastructure, risk management and controls, higher
compensation costs, operational losses related to certain legal
matters and volume-driven growth, partially offset by
efficiency savings.
Provisions increased to $5.6 billion, driven by net credit
losses of $987 million (compared to $394 million in the prior
year), and an ACL build of $4.6 billion (compared to a modest
build in the prior year under prior accounting standards). The
increase in net credit losses was largely driven by write-offs
across various sectors in both North America and EMEA,
primarily reflecting energy and energy-related exposures. The
net credit losses were partially offset by the release of
previously established ACL reserves.
The increase in the ACL build was driven by builds
during the first half of 2020. The builds reflected the impact of
a deterioration in Citi’s macroeconomic outlook under the
CECL standard, driven by the impact of the pandemic across
multiple sectors, as well as downgrades in the corporate
portfolios. Sectors significantly impacted by the pandemic
(including transportation; commercial real estate; energy and
energy-related; and consumer retail) drove approximately half
of the ACL reserve build during 2020. The reserve build also
included an increase in the qualitative management adjustment
to reflect the potential for a higher level of stress and a slower
economic recovery. For additional information on Citi’s ACL
accounting, see “Significant Accounting Policies and
Significant Estimates” below and Notes 1 and 15 to the
Consolidated Financial Statements.
As of December 31, 2020, reserves held on Citi’s balance
sheet represented 1.4% of funded loans, compared to 0.7% as
of December 31, 2019, including 4.4% of reserves held against
the non-investment grade portion.
For additional information on ICG’s corporate credit
portfolio, see “Managing Global Risk—Credit Risk—
Corporate Credit” below.
For additional information about trends, uncertainties and
risks related to ICG’s future results, see “COVID-19
Pandemic Overview” and “Risk Factors” above.
30

CORPORATE/OTHER
Corporate/Other includes certain unallocated costs of global staff functions (including finance, risk, human resources, legal and
compliance), other corporate expenses and unallocated global operations and technology expenses and income taxes, as well as
Corporate Treasury, certain North America legacy consumer loan portfolios, other legacy assets and discontinued operations (for
additional information on Corporate/Other, see “Citigroup Segments” above). At December 31, 2020, Corporate/Other had $96
billion in assets.
In millions of dollars
2020 2019 2018
% Change
2020 vs. 2019
% Change
2019 vs. 2018
Net interest revenue $ (150) $ 1,890 $ 2,361 NM (20) %
Non-interest revenue 204 124 (171) 65 % NM
Total revenues, net of interest expense $ 54 $ 2,014 $ 2,190 (97) % (8) %
Total operating expenses $ 2,501 $ 2,150 $ 2,275 16 % (5) %
Net credit losses (recoveries) on loans $ (22) $ (8) $ 21 NM NM
Credit reserve build (release) for loans 188 (60) (218) NM 72 %
Provision (release) for credit losses on unfunded lending
commitments 11 (7) (3) NM NM
Provisions (releases) for benefits and claims, HTM debt
securities and other assets 1 — (2) 100 % 100
Provisions (releases) for credit losses and for benefits and
claims $ 178 $ (75) $ (202) NM 63 %
Income (loss) from continuing operations before taxes $ (2,625) $ (61) $ 117 NM NM
Income taxes (benefits) (1,060) (886) (88) (20) % NM
Income (loss) from continuing operations $ (1,565) $ 825 $ 205 NM NM
(Loss) from discontinued operations, net of taxes (20) (4) (8) NM 50 %
Net income (loss) before attribution of noncontrolling
interests $ (1,585) $ 821 $ 197 NM NM
Noncontrolling interests (6) 20 11 NM 82 %
Net income (loss) $ (1,579) $ 801 $ 186 NM NM
NM Not meaningful
2020 vs. 2019
Net loss was $1.6 billion, compared to net income of $801
million in the prior year, largely driven by lower revenues,
higher expenses, higher cost of credit and higher tax benefits
in the prior year. The higher tax benefits in the prior year were
primarily due to higher valuation allowance adjustments on
Citi’s deferred tax assets.
Revenues of $54 million decreased $2.0 billion, reflecting
the impact of lower interest rates, episodic gains in the prior
year, the wind-down of legacy assets and marks on securities.
Expenses increased 16%, as the wind-down of legacy
assets was more than offset by investments in infrastructure,
risk management and controls, the $400 million civil money
penalty (for additional information, see “Executive Summary”
and “Citi’s Consent Order Compliance” above) and
incremental costs associated with the pandemic.
Provisions increased $253 million to $178 million,
primarily driven by ACL builds of $199 million on legacy
assets (versus a $67 million release in the prior year under
prior accounting standards).
The ACL build was driven by builds during the first half
of 2020 and primarily reflected the impact of a deterioration in
Citi’s macroeconomic outlook under the CECL standard,
primarily due to the pandemic. For additional information on
Citi’s ACL, see “Significant Accounting Policies and
Significant Estimates” below and Notes 1 and 15 to the
Consolidated Financial Statements.
For additional information about trends, uncertainties and
risks related to Corporate/Other’s future results, see
“COVID-19 Pandemic Overview” above and “Risk Factors”
below.
31
CAPITAL RESOURCES
Overview
Capital is used principally to support assets in Citi’s
businesses and to absorb credit, market and operational losses.
Citi primarily generates capital through earnings from its
operating businesses. Citi may augment its capital through
issuances of common stock and noncumulative perpetual
preferred stock, among other issuances. Further, Citi’s capital
levels may also be affected by changes in accounting and
regulatory standards, as well as U.S. corporate tax laws and
the impact of future events on Citi’s business results, such as
changes in interest and foreign exchange rates, as well as
business and asset dispositions.
During 2020, Citi returned a total of $7.2 billion of capital
to common shareholders in the form of share repurchases
(approximately 41 million common shares) and dividends. On
March 15, 2020, Citi announced it had joined other major U.S.
banks in suspending share repurchases to support clients in
light of the pandemic. Citi commenced share repurchases in
February 2021. For additional information, see “Unregistered
Sales of Equity Securities, Repurchases of Equity Securities
and Dividends—Equity Security Repurchases” below.
Capital Management
Citi’s capital management framework is designed to ensure
that Citigroup and its principal subsidiaries maintain sufficient
capital consistent with each entity’s respective risk profile,
management targets and all applicable regulatory standards
and guidelines. Citi assesses its capital adequacy against a
series of internal quantitative capital goals, designed to
evaluate its capital levels in expected and stressed economic
environments. Underlying these internal quantitative capital
goals are strategic capital considerations, centered on
preserving and building financial strength.
The Citigroup Capital Committee, with oversight from the
Risk Management Committee of Citigroup’s Board of
Directors, has responsibility for Citi’s aggregate capital
structure, including the capital assessment and planning
process, which is integrated into Citi’s capital plan. Balance
sheet management, including oversight of capital adequacy,
for Citigroup’s subsidiaries is governed by each entity’s Asset
and Liability Committee, where applicable.
For additional information regarding Citi’s capital
planning and stress testing exercises, see “Stress Testing
Component of Capital Planning” below.
Current Regulatory Capital Standards
Citi is subject to regulatory capital standards issued by the
Federal Reserve Board, which constitute the U.S. Basel III
rules. These rules establish an integrated capital adequacy
framework, encompassing both risk-based capital ratios and
leverage ratios.
Risk-Based Capital Ratios
The U.S. Basel III rules set forth the composition of regulatory
capital (including the application of regulatory capital
adjustments and deductions), as well as two comprehensive
methodologies (a Standardized Approach and Advanced
Approaches) for measuring total risk-weighted assets. Total
risk-weighted assets under the Advanced Approaches, which
are primarily models based, include credit, market and
operational risk-weighted assets. The Standardized Approach
generally applies prescribed supervisory risk weights to broad
categories of credit risk exposures. As a result, credit risk-
weighted assets calculated under the Advanced Approaches
are more risk sensitive than those calculated under the
Standardized Approach. Market risk-weighted assets are
currently calculated on a generally consistent basis under both
approaches. The Standardized Approach excludes operational
risk-weighted assets.
Under the U.S. Basel III rules, both Citi and Citibank,
N.A. (Citibank) are required to maintain stated minimum
Common Equity Tier 1 Capital, Tier 1 Capital and Total
Capital ratios of 4.5%, 6.0% and 8.0%, respectively. Further,
the U.S. Basel III rules implement the “capital floor provision”
of the so-called “Collins Amendment” of the Dodd-Frank Act,
which requires Advanced Approaches banking organizations
to calculate each of the three risk-based capital ratios
(Common Equity Tier 1 Capital, Tier 1 Capital and Total
Capital) under both the U.S. Basel III Standardized Approach
and the Advanced Approaches and comply with the lower of
each of the resulting risk-based capital ratios.
Tier 1 Leverage Ratio
Under the U.S. Basel III rules, Citi is also required to maintain
a minimum Tier 1 Leverage ratio of 4.0%. The Tier 1
Leverage ratio, a non-risk-based measure of capital adequacy,
is defined as Tier 1 Capital as a percentage of quarterly
adjusted average total assets less amounts deducted from Tier
1 Capital.
32
Supplementary Leverage Ratio
Citi is also required to calculate a Supplementary Leverage
ratio, which differs from the Tier 1 Leverage ratio by also
including certain off-balance sheet exposures within the
denominator of the ratio (Total Leverage Exposure). The
Supplementary Leverage ratio represents end of period Tier 1
Capital to Total Leverage Exposure, with the latter defined as
the sum of the daily average of on-balance sheet assets for the
quarter and the average of certain off-balance sheet exposures
calculated as of the last day of each month in the quarter, less
applicable Tier 1 Capital deductions. Advanced Approaches
banking organizations are required to maintain a stated
minimum Supplementary Leverage ratio of 3.0%.
Further, U.S. GSIBs, including Citi, are subject to
enhanced Supplementary Leverage ratio standards. The
enhanced Supplementary Leverage ratio standards establish a
2.0% leverage buffer in addition to the stated 3.0% minimum
Supplementary Leverage ratio requirement, for a total
effective minimum Supplementary Leverage ratio requirement
of 5.0%. If a U.S. GSIB fails to exceed the 5.0% effective
minimum Supplementary Leverage ratio requirement, it will
be subject to increasingly onerous restrictions (depending
upon the extent of the shortfall) regarding capital distributions
and discretionary executive bonus payments.
Temporary Supplementary Leverage Ratio Relief
In April 2020, the Federal Reserve Board issued an interim
final rule that temporarily changes the calculation of the
Supplementary Leverage ratio for bank holding companies,
including Citigroup, by excluding U.S. Treasuries and
deposits at Federal Reserve Banks from Total Leverage
Exposure. Repo-style transactions on U.S. Treasuries are not
in scope for this relief. The Supplementary Leverage ratio is a
non-risk-sensitive measure, and the temporary exclusion
allows banking organizations to expand their balance sheet, as
appropriate, to continue to serve as financial intermediaries
and to provide credit to households and businesses during the
pandemic.
The interim final rule became effective for Citigroup’s
Supplementary Leverage ratio, as well as for Citigroup’s
leverage-based Total Loss Absorbing Capacity (TLAC) and
Long-Term Debt (LTD) requirements, beginning with the
quarter ended June 30, 2020, and will continue through March
31, 2021. Citigroup’s reported Supplementary Leverage ratio
of 7.0% benefited 109 basis points during the fourth quarter of
2020 as a result of the temporary relief. Excluding the
temporary relief, Citigroup’s Supplementary Leverage ratio
would have been 5.9%, compared with a 5.0% effective
minimum requirement.
In June 2020, the U.S. banking agencies issued an interim
final rule permitting depository institutions, including
Citibank, to elect to temporarily exclude U.S. Treasuries and
deposits at Federal Reserve Banks from Total Leverage
Exposure, subject to the condition that the depository
institution receive approval from its primary federal banking
regulator prior to paying dividends or making certain other
capital distributions while the exclusion is in effect. Citibank
did not elect to temporarily exclude U.S. Treasuries and
deposits at Federal Reserve Banks from Total Leverage
Exposure. Accordingly, the calculation methodology of
Citibank’s Supplementary Leverage ratio was unchanged.
Regulatory Capital Treatment—Modified Transition of the
Current Expected Credit Losses Methodology
In September 2020, the U.S. banking agencies issued a final
rule (substantially unchanged from a March 2020 interim final
rule) that modifies the regulatory capital transition provision
related to the current expected credit losses (CECL)
methodology.
The final rule permits banks to delay for two years the
“Day One” adverse regulatory capital effects resulting from
adoption of the CECL methodology on January 1, 2020 until
January 1, 2022, followed by a three-year transition to phase
out the regulatory capital benefit provided by the delay.
In addition, for the ongoing impact of CECL, the agencies
utilize a 25% scaling factor as an approximation of the
increased reserve build under CECL compared to the previous
incurred loss model and, therefore, allows banks to add back
to Common Equity Tier 1 Capital an amount equal to 25% of
the change in CECL-based allowances recognized through
earnings in each quarter between January 1, 2020 and
December 31, 2021. Beginning January 1, 2022, the
cumulative 25% change in CECL-based allowances
recognized through earnings between January 1, 2020 and
December 31, 2021 will be phased in to regulatory capital at
25% per year on January 1 of each year over the three-year
transition period, along with the delayed “Day One” impact.
Citigroup and Citibank have elected the modified CECL
transition provision provided by the rule beginning with the
quarter ended March 31, 2020. Accordingly, the Day One
regulatory capital effects resulting from adoption of the CECL
methodology, as well as the ongoing adjustments for 25% of
the change in CECL-based allowances recognized through
earnings in each quarter between January 1, 2020 and
December 31, 2021, will now commence phase-in on January
1, 2022 and will be fully reflected in Citi’s regulatory capital
as of January 1, 2025.
For additional information on the U.S. banking agencies’
original regulatory capital transition provision related to the
“Day One” adverse regulatory capital effects resulting from
adoption of the CECL methodology, see “Capital Resources—
Regulatory Capital Treatment—Implementation and
Transition of the Current Expected Credit Losses (CECL)
Methodology” in Citi’s 2019 Annual Report on Form 10-K.
Neither the September 2020 final rule nor the agencies’ prior
guidance has any impact on U.S. GAAP accounting.
33
Regulatory Capital Buffers
Citi and Citibank are required to maintain several regulatory
capital buffers above stated minimum capital requirements.
These capital buffers would be available to absorb losses in
advance of any potential impairment of regulatory capital
below the stated minimum risk-based capital ratio
requirements. Any breach of the buffers to absorb losses
during periods of financial or economic stress would result in
restrictions on earnings distributions (e.g., dividends, share
repurchases and discretionary executive bonuses), with the
degree of such restrictions based upon the extent to which the
buffers are breached. For additional information regarding
limitations on capital distributions, see “Use of Regulatory
Capital Buffers” below.
Stress Capital Buffer
In March 2020, the Federal Reserve Board issued the final
Stress Capital Buffer (SCB) rule, integrating the annual stress
testing requirements with ongoing regulatory capital
requirements.
For Citigroup only, the SCB replaces the fixed 2.5%
Capital Conservation Buffer under the Standardized
Approach, and equals the peak-to-trough Common Equity Tier
1 Capital ratio decline under the Supervisory Severely
Adverse scenario used in the Comprehensive Capital Analysis
and Review (CCAR) and Dodd-Frank Act Stress Testing
(DFAST), plus four quarters of planned common stock
dividends, subject to a floor of 2.5%. The fixed 2.5% Capital
Conservation Buffer will continue to apply under the
Advanced Approaches. SCB-based minimum capital
requirements will generally be updated once per year as part of
the CCAR process. For additional information regarding
CCAR and DFAST, see “Stress Testing Component of Capital
Planning” below.
In August 2020, the Federal Reserve Board finalized and
announced Citi’s SCB requirement of 2.5%. Accordingly,
effective October 1, 2020, Citigroup is required to maintain a
10.0% effective minimum Common Equity Tier 1 Capital
ratio under the Standardized Approach, which is unchanged
from Citi’s previous effective minimum requirement Common
Equity Tier 1 Capital ratio under the Standardized Approach
inclusive of the 2.5% Capital Conservation Buffer.
The Federal Reserve Board may, but is not required to,
recalculate Citi’s SCB as a result of the capital plan
resubmission, and has deferred such a decision through March
31, 2021. For additional information on the capital plan
resubmission, which the Federal Reserve Board required for
each firm subject to its capital plan rule, see “Capital Plan
Resubmission and Related Limitations on Capital
Distributions” below.
The SCB applies to Citigroup only. The regulatory capital
framework applicable to Citibank, including the Capital
Conservation Buffer, is unchanged by the SCB final rule.
Capital Conservation Buffer and Countercyclical Capital
Buffer
Citigroup is subject to a fixed 2.5% Capital Conservation
Buffer under the Advanced Approaches and, prior to the
October 1, 2020 effective date of the SCB, under the
Standardized Approach as well. Citibank is subject to the fixed
2.5% Capital Conservation Buffer under both the Advanced
Approaches and the Standardized Approach.
Additionally, Advanced Approaches banking
organizations, such as Citi and Citibank, are subject to a
discretionary Countercyclical Capital Buffer. The Federal
Reserve Board last voted to affirm the Countercyclical Capital
Buffer amount at the current level of 0% in December 2020.
GSIB Surcharge
The Federal Reserve Board imposes a risk-based capital
surcharge upon U.S. bank holding companies that are
identified as global systemically important bank holding
companies (GSIBs), including Citi. The GSIB surcharge
augments the SCB, Capital Conservation Buffer and, if
invoked, any Countercyclical Capital Buffer.
A U.S. bank holding company that is designated a GSIB
is required, on an annual basis, to calculate a surcharge using
two methods and is subject to the higher of the resulting two
surcharges. The first method (“method 1”) is based on the
Basel Committee’s GSIB methodology. Under the second
method (“method 2”), the substitutability category under the
Basel Committee’s GSIB methodology is replaced with a
quantitative measure intended to assess a GSIB’s reliance on
short-term wholesale funding. In addition, method 1
incorporates relative measures of systemic importance across
certain global banking organizations and a year-end spot
foreign exchange rate, whereas method 2 uses fixed measures
of systemic importance and application of an average foreign
exchange rate over a three-year period. The GSIB surcharges
calculated under both method 1 and method 2 are based on
measures of systemic importance from the year immediately
preceding that in which the GSIB surcharge calculations are
being performed (e.g., the method 1 and method 2 GSIB
surcharges to be calculated by December 31, 2021 will be
based on 2020 systemic indicator data). Generally, Citi’s
surcharge determined under method 2 will result in a higher
surcharge than its surcharge determined under method 1.
Should a GSIB’s systemic importance change year-over-
year such that it becomes subject to a higher surcharge, the
higher surcharge would not become effective for a full year
(e.g., a higher surcharge calculated by December 31, 2021
would not become effective until January 1, 2023). However,
if a GSIB’s systemic importance changes such that the GSIB
would be subject to a lower surcharge, the GSIB would be
subject to the lower surcharge beginning with the next
calendar year (e.g., a lower surcharge calculated by December
31, 2021 would become effective January 1, 2022).
34

The following table sets forth Citi’s effective GSIB
surcharge as determined under method 1 and method 2 for
2020 and 2019:
2020 2019
Method 1 2.0 % 2.0 %
Method 2 3.0 3.0
Citi’s GSIB surcharge effective for both 2020 and 2019
was 3.0%, as derived under the higher method 2 result. Citi’s
GSIB surcharge effective for 2021 will remain unchanged at
3.0%, as derived under the higher method 2 result. Citi expects
that its method 2 GSIB surcharge will continue to remain
higher than its method 1 GSIB surcharge. Accordingly, Citi’s
GSIB surcharge effective for 2022 will not exceed 3.0%.
Citi’s GSIB surcharge effective for 2023 will likely be based
on the lower of its method 2 scores for year-end 2020 and
2021, and could increase to 3.5%.
Use of Regulatory Capital Buffers
In March 2020, the U.S. banking agencies issued a statement
encouraging banking organizations to use their regulatory
capital buffers as they respond to the challenges presented by
the effects of the COVID-19 pandemic.
Consistent with the statement, in October 2020, the U.S.
banking agencies issued a final rule (substantially unchanged
from two previous interim final rules in March 2020) that
eases capital distribution limitations in the original U.S. Basel
III rules, in an effort to reduce the impact of using regulatory
capital buffers. The changes in the rule have the potential to
prevent a complete and sudden cessation of capital
distributions due to a breach of regulatory capital buffers,
which include the SCB, Capital Conservation Buffer, GSIB
surcharge, and any Countercyclical Capital Buffer (currently
0%).
The rule became effective in March 2020, and applies to
risk-based capital ratios, the Supplementary Leverage ratio,
and RWA-based or leverage-based external TLAC buffers.
External Long-Term Debt requirements do not include any
buffers and are, therefore, unaffected by the final rule. For
additional information on Citi’s TLAC-related requirements,
see “Total Loss-Absorbing Capacity (TLAC)” and “Risk
Factors—Compliance, Conduct and Legal Risks” below.
More specifically, under the U.S. Basel III rules, banking
organizations that fall below their regulatory capital buffers
are subject to limitations on capital distributions and
discretionary bonus payments to executive officers based on a
percentage of “Eligible Retained Income” (ERI), with
increasing restrictions based upon the severity of the breach.
The original definition of ERI in the U.S. Basel III rules was
equal to the bank’s net income for the four calendar quarters
preceding the current calendar quarter, net of any distributions
and tax effects not already reflected in net income. The final
rule revises the definition of ERI to equal the greater of: (i) the
bank’s net income for the four calendar quarters preceding the
current calendar quarter, net of any distributions and tax
effects not already reflected in net income, and (ii) the average
of the bank’s net income for the four calendar quarters
preceding the current calendar quarter.
As of December 31, 2020, Citi’s regulatory capital ratios
exceeded effective regulatory minimum requirements. Citi is
not subject to payout limitations as a result of Basel III
requirements. For information related to capital distribution
limitations that are currently in effect for large banks, see
“Capital Plan Resubmission and Related Limitations on
Capital Distributions” below.
The impact of the final rule on Citibank is limited,
because the minimum requirements to be considered “well-
capitalized” under the Prompt Corrective Action (PCA)
framework are unchanged.
Prompt Corrective Action Framework
In general, the Prompt Corrective Action (PCA) regulations
direct the U.S. banking agencies to enforce increasingly strict
limitations on the activities of insured depository institutions
that fail to meet certain regulatory capital thresholds. The PCA
framework contains five categories of capital adequacy as
measured by risk-based capital and leverage ratios: (i) “well
capitalized,” (ii) “adequately capitalized,” (iii)
“undercapitalized,” (iv) “significantly undercapitalized” and
(v) “critically undercapitalized.”
Accordingly, an insured depository institution, such as
Citibank, must maintain minimum Common Equity Tier 1
Capital, Tier 1 Capital, Total Capital and Tier 1 Leverage
ratios of 6.5%, 8.0%, 10.0% and 5.0%, respectively, to be
considered “well capitalized.” In addition, insured depository
institution subsidiaries of U.S. GSIBs, including Citibank,
must maintain a minimum Supplementary Leverage ratio of
6.0% to be considered “well capitalized.” Citibank was “well
capitalized” as of December 31, 2020.
Stress Testing Component of Capital Planning
Citi is subject to an annual assessment by the Federal Reserve
Board as to whether Citigroup has effective capital planning
processes as well as sufficient regulatory capital to absorb
losses during stressful economic and financial conditions,
while also meeting obligations to creditors and counterparties
and continuing to serve as a credit intermediary. This annual
assessment includes two related programs: the Comprehensive
Capital Analysis and Review (CCAR) and Dodd-Frank Act
Stress Testing (DFAST).
For the largest and most complex firms, such as Citi,
CCAR includes a qualitative evaluation of a firm’s abilities to
determine its capital needs on a forward-looking basis. In
conducting the qualitative assessment, the Federal Reserve
Board evaluates firms’ capital planning practices, focusing on
six areas of capital planning—namely, governance, risk
management, internal controls, capital policies, incorporating
stressful conditions and events, and estimating impact on
capital positions. As part of the CCAR process, the Federal
Reserve Board evaluates Citi’s capital adequacy, capital
adequacy process and its planned capital distributions, such as
dividend payments and common share repurchases. The
Federal Reserve Board assesses whether Citi has sufficient
capital to continue operations throughout times of economic
and financial market stress and whether Citi has robust,
forward-looking capital planning processes that account for its
unique risks.
35
Since firms are now required to maintain risk-based
capital ratio minimum requirements that integrate stress test
results, the Federal Reserve Board’s SCB final rule eliminated
a number of previous CCAR requirements, including the once-
a-year quantitative objection, the pre-approval requirement
from the Federal Reserve Board for making distributions in
excess of planned capital actions, and the 30% dividend
payout ratio as a criterion for heightened supervisory scrutiny.
All CCAR firms, including Citi, are subject to a rigorous
evaluation of their capital planning process. Firms with weak
practices may be subject to a deficient supervisory rating, and
potentially an enforcement action, for failing to meet
supervisory expectations. For additional information regarding
CCAR, see “Risk Factors—Strategic Risks” below.
DFAST is a forward-looking quantitative evaluation of
the impact of stressful economic and financial market
conditions on Citi’s regulatory capital. This program serves to
inform the Federal Reserve Board and the general public as to
how Citi’s regulatory capital ratios might change using a
hypothetical set of adverse economic conditions as designed
by the Federal Reserve Board. In addition to the annual
supervisory stress test conducted by the Federal Reserve
Board, Citi is required to conduct annual company-run stress
tests under the same adverse economic conditions designed by
the Federal Reserve Board.
Both CCAR and DFAST include an estimate of projected
revenues, losses, reserves, pro forma regulatory capital ratios,
and any other additional capital measures deemed relevant by
Citi. Projections are required over a nine-quarter planning
horizon under two supervisory scenarios (baseline and
severely adverse conditions). All risk-based capital ratios
reflect application of the Standardized Approach framework
under the U.S. Basel III rules. Moreover, the Federal Reserve
Board has deferred the use of the Advanced Approaches
framework indefinitely.
In addition, Citibank is required to conduct the annual
Dodd-Frank Act Stress Test. The annual stress test consists of
a forward-looking quantitative evaluation of the impact of
stressful economic and financial market conditions under
several scenarios on Citibank’s regulatory capital. This
program serves to inform the Office of the Comptroller of the
Currency as to how Citibank’s regulatory capital ratios might
change during a hypothetical set of adverse economic
conditions and to ultimately evaluate the reliability of
Citibank’s capital planning process.
Capital Plan Resubmission and Related Limitations on
Capital Distributions
In June 2020, the Federal Reserve Board determined that
changes in financial markets and macroeconomic outlooks
related to the COVID-19 pandemic could have a material
effect on the risk profile and financial condition of each firm
subject to its capital plan rule and, therefore, required updated
capital plans. Citigroup resubmitted its capital plan in
November 2020.
In December 2020, the Federal Reserve Board announced
that it was modifying and extending for an additional quarter
several measures that were previously announced for the third
and fourth quarters of 2020 to ensure that large banks maintain
a high level of capital resilience. Through the end of the first
quarter of 2021, the Federal Reserve Board has authorized
firms, including Citi, to pay common stock dividends and
make share repurchases that, in the aggregate, do not exceed
an amount equal to the average of the firm’s net income for
the four preceding calendar quarters, unless otherwise
specified by the Federal Reserve Board, provided that the firm
does not exceed the amount of common stock dividends paid
in the second quarter of 2020. Additionally, through the end of
the first quarter of 2021, the Federal Reserve Board has
authorized firms to make share repurchases relating to
issuances of common stock related to employee stock
ownership plans, and to redeem and make scheduled payments
on Additional Tier 1 Capital and Tier 2 Capital instruments.
These limitations on capital distributions may be extended or
modified by the Federal Reserve Board.
On June 29, 2020, Citi announced its planned capital
actions including common dividends. Citi is permitted to
return capital to common shareholders of up $2.8 billion
during the first quarter of 2021, including the previously
announced common dividends of $0.51 per share in the
quarter, consistent with the Federal Reserve Board’s income-
based formula for temporary limitations on common dividends
and common share repurchases announced in December 2020.
Citi commenced share repurchases in February 2021.
The Federal Reserve Board may, but is not required to,
recalculate Citi’s SCB as a result of the capital plan
resubmission, and has deferred such a decision up to March
31, 2021.
36
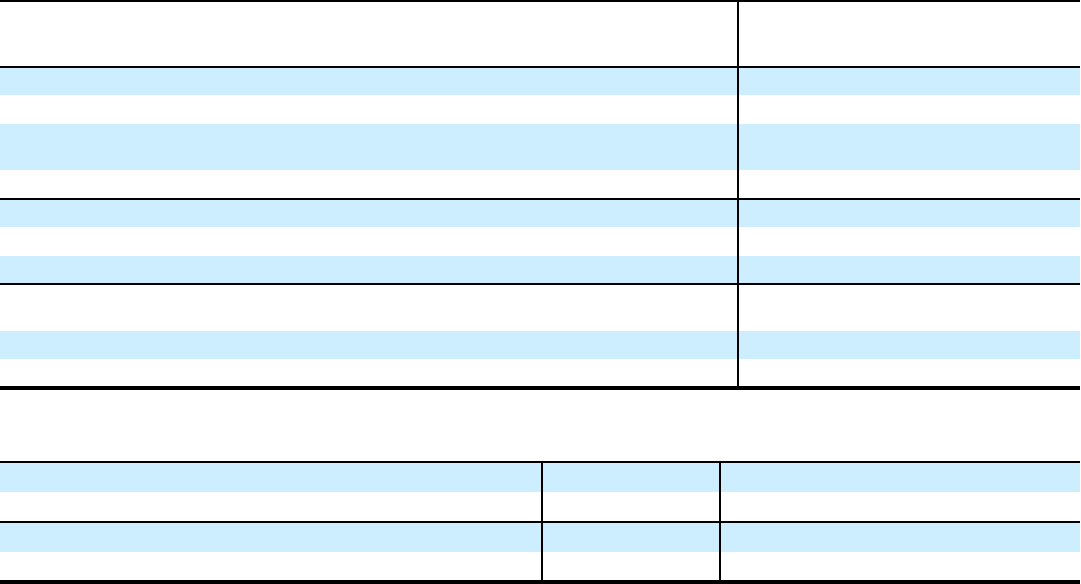
Citigroup’s Capital Resources
Citi is required to maintain stated minimum Common Equity
Tier 1 Capital, Tier 1 Capital and Total Capital ratios of 4.5%,
6.0% and 8.0%, respectively. Citi’s effective minimum capital
requirements are presented in the table below.
Furthermore, to be “well capitalized” under current
federal bank regulatory agency definitions, a bank holding
company must have a Tier 1 Capital ratio of at least 6.0%, a
Total Capital ratio of at least 10.0% and not be subject to a
Federal Reserve Board directive to maintain higher capital
levels.
The following tables set forth Citi’s capital components
and ratios as of December 31, 2020, September 30, 2020 and
December 31, 2019:
Advanced Approaches Standardized Approach
In millions of dollars, except ratios
Effective
Minimum
Requirement
(1)
Dec. 31, 2020 Sep. 30, 2020 Dec. 31, 2019 Dec. 31, 2020 Sep. 30, 2020 Dec. 31, 2019
Common Equity Tier 1 Capital
(2)
$ 147,274 $ 142,158 $ 137,798 $ 147,274 $ 142,158 $ 137,798
Tier 1 Capital 167,053 160,311 155,805 167,053 160,311 155,805
Total Capital (Tier 1 Capital +
Tier 2 Capital)
(2)
195,959 189,477 181,337 204,849 198,120 193,711
Total Risk-Weighted Assets 1,255,284 1,218,977 1,142,804 1,221,576 1,178,219 1,168,848
Credit Risk
(2)
$ 844,374 $ 821,024 $ 778,759 $ 1,109,435 $ 1,077,719 $ 1,110,100
Market Risk 107,812 96,873 57,317 112,141 100,500 58,748
Operational Risk 303,098 301,080 306,728 — — —
Common Equity Tier 1 Capital
ratio
(3)
10.0 % 11.73 % 11.66 % 12.06 % 12.06 % 12.07 % 11.79 %
Tier 1 Capital ratio
(3)
11.5 13.31 13.15 13.63 13.68 13.61 13.33
Total Capital ratio
(3)
13.5 15.61 15.54 15.87 16.77 16.82 16.57
In millions of dollars, except ratios
Effective
Minimum
Requirement Dec. 31, 2020 Sept. 30, 2020 Dec. 31, 2019
Quarterly Adjusted Average Total Assets
(2)(4)
$ 2,265,615 $ 2,224,446 $ 1,957,039
Total Leverage Exposure
(2)(5)
2,386,881 2,349,620 2,513,702
Tier 1 Leverage ratio 4.0% 7.37 % 7.21 % 7.96 %
Supplementary Leverage ratio 5.0 7.00 6.82 6.20
(1) Beginning October 1, 2020, Citi’s effective minimum risk-based capital requirements include the 2.5% SCB and 3.0% GSIB surcharge under the Standardized
Approach, and the 2.5% Capital Conservation Buffer and 3.0% GSIB surcharge under the Advanced Approaches (all of which must be composed of Common
Equity Tier 1 Capital). For prior periods presented, Citi’s effective minimum risk-based capital requirements include the 2.5% Capital Conservation Buffer and the
3.0% GSIB surcharge under both Approaches.
(2) Citi has elected to apply the modified transition provision related to the impact of the CECL accounting standard on regulatory capital, as provided by the U.S.
banking agencies’ September 2020 final rule. Under the modified CECL transition provision, the changes in retained earnings (after-tax), deferred tax assets
(DTAs) arising from temporary differences, and the ACL upon the January 1, 2020 CECL adoption date have been deferred and will phase in to regulatory capital
at 25% per year commencing January 1, 2022. For the ongoing impact of CECL, Citigroup is allowed to adjust retained earnings and the ACL in an amount equal
to 25% of the change in the ACL recognized through earnings (pretax) for each period between January 1, 2020 and December 31, 2021. The cumulative
adjustments to retained earnings and the ACL between January 1, 2020 and December 31, 2021 will also phase in to regulatory capital at 25% per year
commencing January 1, 2022, along with the deferred impacts related to the January 1, 2020 CECL adoption date. Corresponding adjustments to average on-
balance sheet assets are reflected in quarterly adjusted average total assets and Total Leverage Exposure. Additionally, the increase in DTAs arising from
temporary differences upon the January 1, 2020 adoption date has been deducted from risk-weighted assets (RWA) and will phase in to RWA at 25% per year
commencing January 1, 2022.
(3) Citi’s reportable Common Equity Tier 1 Capital and Tier 1 Capital ratios were derived under the Basel III Advanced Approaches framework as of December 31,
2020 and September 30, 2020, and the Basel III Standardized Approach as of December 31, 2019, whereas Citi’s reportable Total Capital ratio was the lower
derived under the Basel III Advanced Approaches framework for all periods presented.
(4) Tier 1 Leverage ratio denominator. Represents quarterly average total assets less amounts deducted from Tier 1 Capital.
(5) Supplementary Leverage ratio denominator. Commencing with the second quarter of 2020, Citigroup’s Total Leverage Exposure temporarily excludes U.S.
Treasuries and deposits at Federal Reserve Banks. For additional information, see “Temporary Supplementary Leverage Ratio Relief” above.
37

Common Equity Tier 1 Capital Ratio
Citi’s Common Equity Tier 1 Capital ratio was 11.7% at
December 31, 2020 and September 30, 2020, both under the
Basel III Advanced Approaches framework. Citi’s reportable
Common Equity Tier 1 Capital ratio was 11.8% at December
31, 2019 under the Basel III Standardized Approach. Citi’s
Common Equity Tier 1 Capital ratio remained unchanged
from September 30, 2020, as a net increase in risk-weighted
assets and the return of $1.1 billion capital to common
shareholders in the form of dividends were offset by quarter-
to-date net income of $4.3 billion. Citi’s Common Equity Tier
1 Capital ratio decreased from year-end 2019, largely driven
by a net increase in risk-weighted assets and the return of $7.2
billion of capital to common shareholders in the form of share
repurchases and dividends, partially offset by year-to-date net
income of $11.0 billion, beneficial net movements in AOCI,
and the relief of the modified CECL transition provision.
Components of Citigroup Capital
In millions of dollars
December 31,
2020
December 31,
2019
Common Equity Tier 1 Capital
Citigroup common stockholders’ equity
(1)
$ 180,118 $ 175,414
Add: Qualifying noncontrolling interests 141 154
Regulatory capital adjustments and deductions:
Add: CECL transition and 25% provision deferral
(2)
5,348 —
Less: Accumulated net unrealized gains (losses) on cash flow hedges, net of tax 1,593 123
Less: Cumulative unrealized net gain (loss) related to changes in fair value of financial liabilities
attributable to own creditworthiness, net of tax (1,109) (679)
Less: Intangible assets:
Goodwill, net of related DTLs
(3)
21,124 21,066
Identifiable intangible assets other than MSRs, net of related DTLs 4,166 4,087
Less: Defined benefit pension plan net assets 921 803
Less: DTAs arising from net operating loss, foreign tax credit and general business credit
carry-forwards
(4)
11,638 12,370
Total Common Equity Tier 1 Capital (Advanced Approaches and Standardized Approach) $ 147,274 $ 137,798
Additional Tier 1 Capital
Qualifying noncumulative perpetual preferred stock
(1)
$ 19,324 $ 17,828
Qualifying trust preferred securities
(5)
1,393 1,389
Qualifying noncontrolling interests 35 42
Regulatory capital deductions:
Less: Permitted ownership interests in covered funds
(6)
917 1,216
Less: Other 56 36
Total Additional Tier 1 Capital (Advanced Approaches and Standardized Approach) $ 19,779 $ 18,007
Total Tier 1 Capital (Common Equity Tier 1 Capital + Additional Tier 1 Capital)
(Advanced Approaches and Standardized Approach) $ 167,053 $ 155,805
Tier 2 Capital
Qualifying subordinated debt $ 23,481 $ 23,673
Qualifying trust preferred securities
(7)
331 326
Qualifying noncontrolling interests 41 46
Excess of eligible credit reserves over expected credit losses
(2)(8)
5,084 1,523
Regulatory capital deduction:
Less: Other 31 36
Total Tier 2 Capital (Advanced Approaches) $ 28,906 $ 25,532
Total Capital (Tier 1 Capital + Tier 2 Capital) (Advanced Approaches) $ 195,959 $ 181,337
Adjustment for eligible allowance for credit losses
(2)(8)
$ 8,890 $ 12,374
Total Tier 2 Capital (Standardized Approach) $ 37,796 $ 37,906
Total Capital (Tier 1 Capital + Tier 2 Capital) (Standardized Approach) $ 204,849 $ 193,711
Footnotes continue on the following page.
38
(1) Issuance costs of $156 million and $152 million related to noncumulative perpetual preferred stock outstanding at December 31, 2020 and 2019, respectively, are
excluded from common stockholders’ equity and netted against such preferred stock in accordance with Federal Reserve Board regulatory reporting requirements,
which differ from those under U.S. GAAP.
(2) Citi has elected to apply the modified transition provision related to the impact of the CECL accounting standard on regulatory capital, as provided by the U.S.
banking agencies’ September 2020 final rule. Under the modified CECL transition provision, the changes in retained earnings (after-tax) and the ACL upon the
January 1, 2020 CECL adoption date have been deferred and will phase in to regulatory capital at 25% per year commencing January 1, 2022. For the ongoing
impact of CECL, Citigroup is allowed to adjust retained earnings and the ACL in an amount equal to 25% of the change in the ACL recognized through earnings
(pretax) for each period between January 1, 2020 and December 31, 2021. The cumulative adjustments to retained earnings and the ACL between January 1, 2020
and December 31, 2021 will also phase in to regulatory capital at 25% per year commencing January 1, 2022, along with the deferred impacts related to the
January 1, 2020 CECL adoption date.
(3) Includes goodwill “embedded” in the valuation of significant common stock investments in unconsolidated financial institutions.
(4) Of Citi's $24.8 billion of net DTAs at December 31, 2020, $15.3 billion was includable in Common Equity Tier 1 Capital pursuant to the U.S. Basel III rules,
while $9.5 billion was excluded. Excluded from Citi's Common Equity Tier 1 Capital as of December 31, 2020 was $11.6 billion of net DTAs arising from net
operating loss, foreign tax credit and general business credit tax carry-forwards. The amount excluded was reduced by $2.1 billion of net DTLs primarily
associated with goodwill and certain other intangible assets that are separately deducted from capital. DTAs arising from tax carry-forwards are required to be
entirely deducted from Common Equity Tier 1 Capital under the U.S. Basel III rules. DTAs arising from temporary differences are required to be deducted from
capital only if these DTAs exceed a 10% limitation under the U.S. Basel III rules. Citi’s DTAs do not currently exceed this limitation and, therefore, are not
subject to deduction from Common Equity Tier 1 Capital, but are subject to risk weighting at 250%.
(5) Represents Citigroup Capital XIII trust preferred securities, which are permanently grandfathered as Tier 1 Capital under the U.S. Basel III rules.
(6) Banking entities are required to be in compliance with the Volcker Rule of the Dodd-Frank Act, which prohibits conducting certain proprietary investment
activities and limits their ownership of, and relationships with, covered funds. The U.S. agencies issued a revised Volcker Rule 2.0 in November 2019 that
removes permitted investments in third-party covered funds from capital deduction requirements, among other changes. Upon the removal of the capital
deduction, permitted investments in third-party covered funds will be included in risk-weighted assets. Mandatory compliance with the revised Volcker Rule 2.0 is
required by January 1, 2021, with early adoption permitted, in whole or in part, beginning January 1, 2020. Additionally, the U.S. agencies issued a revised
Volcker Rule 2.1 in July 2020 that improves and streamlines several “covered funds” requirements, with an effective date of October 1, 2020. Citi continues to
deduct from Tier 1 Capital all permitted ownership interests in covered funds for all periods presented.
(7) Represents the amount of non-grandfathered trust preferred securities eligible for inclusion in Tier 2 Capital under the U.S. Basel III rules, which will be fully
phased out of Tier 2 Capital by January 1, 2022.
(8) Under the Advanced Approaches framework, eligible credit reserves that exceed expected credit losses are eligible for inclusion in Tier 2 Capital to the extent that
the excess reserves do not exceed 0.6% of credit risk-weighted assets, which differs from the Standardized Approach, in which the ACL is eligible for inclusion in
Tier 2 Capital up to 1.25% of credit risk-weighted assets, with any excess ACL being deducted in arriving at credit risk-weighted assets. The total amount of ACL
that was eligible for inclusion in Tier 2 Capital, subject to limitation, under the Standardized Approach framework was $14.0 billion and $13.9 billion at
December 31, 2020 and December 31, 2019 respectively.
39

Citigroup Capital Rollforward
In millions of dollars
Three months ended
December 31, 2020
Twelve months ended
December 31, 2020
Common Equity Tier 1 Capital, beginning of period $ 142,158 $ 137,798
Net income 4,309 11,047
Common and preferred dividends declared (1,340) (5,394)
Net change in treasury stock 8 (2,469)
Net increase in common stock and additional paid-in capital 87 10
Net change in foreign currency translation adjustment net of hedges, net of tax 2,401 (250)
Net change in unrealized gains (losses) on debt securities AFS, net of tax (98) 3,585
Net change in defined benefit plans liability adjustment, net of tax 62 (55)
Net change in adjustment related to change in fair value of financial liabilities
attributable to own creditworthiness, net of tax 62 (45)
Net increase in excluded component of fair value hedges (16) (15)
Net increase in goodwill, net of related DTLs (602) (58)
Net change in identifiable intangible assets other than MSRs, net of related DTLs 82 (79)
Net change in defined benefit pension plan net assets 28 (118)
Net decrease in DTAs arising from net operating loss, foreign tax credit and
general business credit carry-forwards 423 732
Net change in CECL 25% provision deferral (290) 2,463
Other — 122
Net increase in Common Equity Tier 1 Capital $ 5,116 $ 9,476
Common Equity Tier 1 Capital, end of period
(Advanced Approaches and Standardized Approach) $ 147,274 $ 147,274
Additional Tier 1 Capital, beginning of period $ 18,153 $ 18,007
Net increase in qualifying perpetual preferred stock 1,495 1,496
Net change in qualifying trust preferred securities — 4
Net decrease in permitted ownership interests in covered funds 158 299
Other (27) (27)
Net increase in Additional Tier 1 Capital $ 1,626 $ 1,772
Tier 1 Capital, end of period
(Advanced Approaches and Standardized Approach) $ 167,053 $ 167,053
Tier 2 Capital, beginning of period (Advanced Approaches) $ 29,113 $ 25,532
Net decrease in qualifying subordinated debt (397) (192)
Net increase in excess of eligible credit reserves over expected credit losses 185 3,561
Other 5 5
Net change in Tier 2 Capital (Advanced Approaches) $ (207) $ 3,374
Tier 2 Capital, end of period (Advanced Approaches) $ 28,906 $ 28,906
Total Capital, end of period (Advanced Approaches) $ 195,959 $ 195,959
Tier 2 Capital, beginning of period (Standardized Approach) $ 37,768 $ 37,877
Net decrease in qualifying subordinated debt (397) (192)
Net increase in eligible allowance for credit losses 420 106
Other 5 5
Net change in Tier 2 Capital (Standardized Approach) $ 28 $ (81)
Tier 2 Capital, end of period (Standardized Approach) $ 37,796 $ 37,796
Total Capital, end of period (Standardized Approach) $ 204,849 $ 204,849
40
Citigroup Risk-Weighted Assets Rollforward (Basel III Advanced Approaches)
In millions of dollars
Three months ended
December 31, 2020
Twelve months ended
December 31, 2020
Total Risk-Weighted Assets, beginning of period $ 1,218,977 $ 1,142,804
Changes in Credit Risk-Weighted Assets
Retail exposures
(1)
(299) (23,709)
Wholesale exposures
(2)
(1,690) 24,631
Repo-style transactions
(3)
1,277 15,618
Securitization exposures 1,122 (1,089)
Equity exposures 874 924
Over-the-counter (OTC) derivatives
(4)
5,199 21,837
Derivatives CVA
(5)
7,138 17,713
Other exposures
(6)
8,884 6,810
Supervisory 6% multiplier 845 2,880
Net increase in Credit Risk-Weighted Assets $ 23,350 $ 65,615
Changes in Market Risk-Weighted Assets
Risk levels
(7)
$ 6,726 $ 31,744
Model and methodology updates
(7)
4,213 18,751
Net increase in Market Risk-Weighted Assets $ 10,939 $ 50,495
Net change in Operational Risk-Weighted Assets
(8)
$ 2,018 $ (3,630)
Total Risk-Weighted Assets, end of period $ 1,255,284 $ 1,255,284
(1) Retail exposures decreased during the 12 months ended December 31, 2020, primarily driven by lower consumer activity in 2020 due to the pandemic.
(2) Wholesale exposures decreased during the three months ended December 31, 2020, primarily due to reductions in commercial loans partially offset by an increase
in investment securities. Wholesale exposures increased during the 12 months ended December 31, 2020, primarily due to increases in investment securities and
rating downgrades partially offset by annual model parameter updates reflecting Citi’s loss experiences.
(3) Repo-style transactions include repurchase and reverse repurchase transactions as well as securities borrowing and securities lending transactions. Repo-style
transactions increased during the 12 months ended December 31, 2020, mainly driven by market volatility and volume increases.
(4) OTC derivatives increased during the three months ended December 31, 2020, primarily due to an increase in mark-to-market gains for bilateral derivatives. OTC
derivatives increased during the 12 months ended December 31, 2020, primarily due to increases in mark-to-market gains and notional for bilateral derivatives.
(5) Derivatives CVA increased during the three months ended December 31, 2020, primarily due to new trades with higher credit spreads and sensitivity. Derivatives
CVA increased during the 12 months ended December 31, 2020, primarily due to widening credit spreads and market volatility.
(6) Other exposures include cleared transactions, unsettled transactions, assets other than those reportable in specific exposure categories and non-material portfolios.
Other exposures increased during the three months and 12 months ended December 31, 2020, primarily due to increases in centrally cleared transactions and
various other assets.
(7) Market risk-weighted assets increased during the three months ended December 31, 2020 primarily due to changes in exposures impacting Stressed Value at Risk
and Securitization charges. Market risk-weighted assets increased during the 12 months ended December 31, 2020 primarily driven by increases in market
volatility due to the pandemic.
(8) Operational risk-weighted assets increased during the three months December 31, 2020, primarily due to changes in operational loss frequency. Operational risk-
weighted assets decreased during the 12 months ended December 31, 2020, primarily due to changes in operational loss severity and frequency.
41
Citigroup Risk-Weighted Assets Rollforward (Basel III Standardized Approach)
In millions of dollars
Three months ended
December 31, 2020
Twelve months ended
December 31, 2020
Total Risk-Weighted Assets, beginning of period $ 1,178,219 $ 1,168,848
Changes in Credit Risk-Weighted Assets
General credit risk exposures
(1)
11,075 (26,602)
Repo-style transactions
(2)
6,274 13,440
Securitization exposures 1,184 1,119
Equity exposures 1,387 1,269
Over-the-counter (OTC) derivatives
(3)
4,518 16,331
Other exposures
(4)
5,275 (1,582)
Off-balance sheet exposures
(5)
2,003 (4,640)
Net change in Credit Risk-Weighted Assets $ 31,716 $ (665)
Changes in Market Risk-Weighted Assets
Risk levels
(6)
$ 7,428 $ 34,642
Model and methodology updates
(6)
4,213 18,751
Net increase in Market Risk-Weighted Assets $ 11,641 $ 53,393
Total Risk-Weighted Assets, end of period $ 1,221,576 $ 1,221,576
(1) General credit risk exposures include cash and balances due from depository institutions, securities, and loans and leases. General credit risk exposures increased
during the three months ended December 31, 2020 primarily due to new accounts and holiday spending for qualifying revolving exposures (cards) partially offset
by reductions in commercial loans. General credit risk exposures decreased during the 12 months ended December 31, 2020 primarily due to lesser spending for
qualifying revolving (cards) exposures due to the pandemic.
(2) Repo-style transactions include repurchase and reverse repurchase transactions as well as securities borrowing and securities lending transactions. Repo-style
transactions increased during the three months and 12 months ended December 31, 2020, primarily due to increases in exposure and volume.
(3) OTC derivatives increased during the three months ended December 31, 2020 primarily due to an increases in mark-to-market gains for bilateral derivatives. OTC
derivatives increased during the 12 months ended December 31, 2020 primarily due to increases in mark-to-market gains and notional for bilateral derivatives.
(4) Other exposures include cleared transactions, unsettled transactions, and other assets. Other exposures increased during three months ended December 31, 2020
primarily due to increases in other assets and centrally cleared transactions. Other exposures decreased during the 12 months ended December 31, 2020 primarily
due to decreases in notional for centrally cleared derivatives and excess of credit reserves not included in Tier 2 capital eligible for RWA reduction.
(5) Off-balance sheet exposures increased during the three months ended December 31, 2020 primarily due to an increase in loan commitments. Off-balance sheet
exposures decreased during the 12 months ended December 31, 2020 primarily due to a decrease in loan commitments.
(6) Market risk-weighted assets increased during the three months ended December 31, 2020 primarily due to changes in exposures impacting Stressed Value at Risk
and Securitization charges. Market risk-weighted assets increased during the 12 months ended December 31, 2020 primarily driven by increases in market
volatility due to the pandemic.
42

Supplementary Leverage Ratio
The following table sets forth Citi’s Supplementary Leverage
ratio and related components as of December 31, 2020,
September 30, 2020 and December 31, 2019:
In millions of dollars, except ratios
December 31, 2020 September 30, 2020 December 31, 2019
Tier 1 Capital $ 167,053 $ 160,311 $ 155,805
Total Leverage Exposure
On-balance sheet assets
(1)(2)(3)
$ 1,864,374 $ 1,844,609 $ 1,996,617
Certain off-balance sheet exposures:
(4)
Potential future exposure on derivative contracts 183,604 176,424 175,289
Effective notional of sold credit derivatives, net
(5)
32,640 33,103 38,481
Counterparty credit risk for repo-style transactions
(6)
20,168 18,095 23,715
Unconditionally cancelable commitments 71,163 71,338 70,870
Other off-balance sheet exposures 253,754 244,934 248,308
Total of certain off-balance sheet exposures $ 561,329 $ 543,894 $ 556,663
Less: Tier 1 Capital deductions 38,822 38,883 39,578
Total Leverage Exposure
(3)
$ 2,386,881 $ 2,349,620 $ 2,513,702
Supplementary Leverage ratio 7.00 % 6.82 % 6.20 %
(1) Represents the daily average of on-balance sheet assets for the quarter.
(2) Citi has elected to apply the modified transition provision related to the impact of the CECL accounting standard on regulatory capital, as provided by the U.S.
banking agencies’ September 2020 final rule. Under the modified CECL transition provision, the changes in DTAs arising from temporary differences and the
ACL upon the January 1, 2020 CECL adoption date have been deferred and will phase in to regulatory capital at 25% per year commencing January 1, 2022. For
the ongoing impact of CECL, Citigroup is allowed to adjust the ACL in an amount equal to 25% of the change in the ACL recognized through earnings (pretax)
for each period between January 1, 2020 and December 31, 2021. The cumulative adjustments to the ACL between January 1, 2020 and December 31, 2021 will
also phase in to regulatory capital at 25% per year commencing January 1, 2022, along with the deferred impacts related to the January 1, 2020 CECL adoption
date. Corresponding adjustments to average on-balance sheet assets are reflected in Total Leverage Exposure.
(3) Commencing with the second quarter of 2020, Citigroup’s Total Leverage Exposure temporarily excludes U.S. Treasuries and deposits at Federal Reserve Banks.
For additional information, see “Temporary Supplementary Leverage Ratio Relief” above.
(4) Represents the average of certain off-balance sheet exposures calculated as of the last day of each month in the quarter.
(5) Under the U.S. Basel III rules, banking organizations are required to include in Total Leverage Exposure the effective notional amount of sold credit derivatives,
with netting of exposures permitted if certain conditions are met.
(6) Repo-style transactions include repurchase or reverse repurchase transactions as well as securities borrowing or securities lending transactions.
As set forth in the table above, Citigroup’s Supplementary
Leverage ratio was 7.0% at December 31, 2020, compared to
6.8% at September 30, 2020 and 6.2% at December 31, 2019.
The quarter-over-quarter increase was primarily driven by an
increase in Tier 1 Capital resulting from net income and
beneficial net movements in AOCI, partially offset by an
increase in both average on-balance sheet assets and average
off-balance sheet exposures. The year-over-year increase was
primarily driven by a decrease in Total Leverage Exposure
mainly attributable to the 109 basis point benefit resulting
from the Federal Reserve Board’s temporary Supplementary
Leverage ratio relief.
43
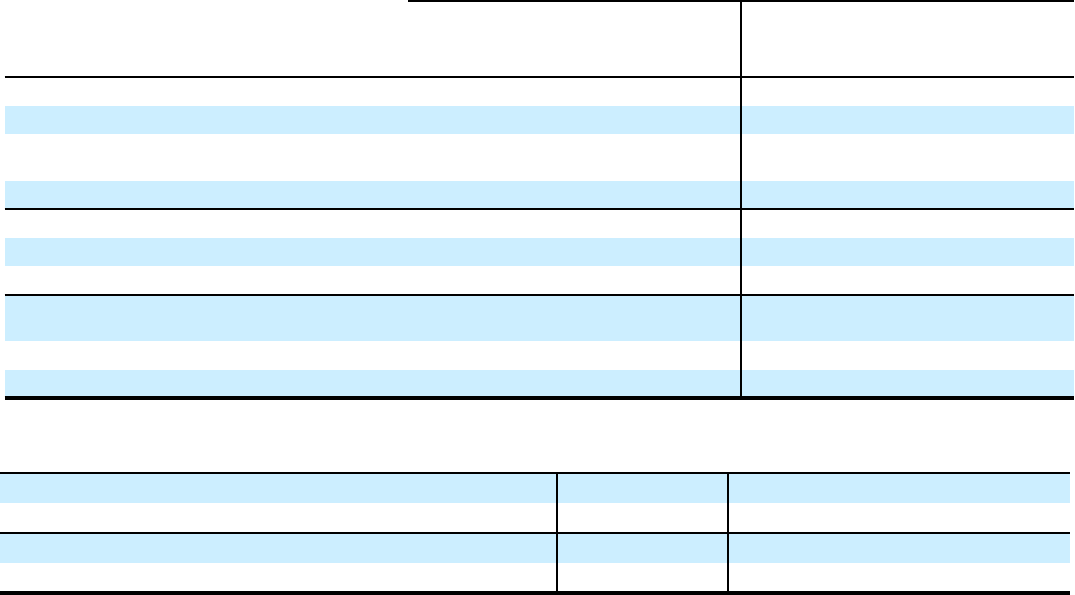
Capital Resources of Citigroup’s Subsidiary U.S.
Depository Institutions
Citigroup’s subsidiary U.S. depository institutions are also
subject to regulatory capital standards issued by their
respective primary bank regulatory agencies, which are similar
to the standards of the Federal Reserve Board.
The following tables set forth the capital components and
ratios for Citibank, Citi’s primary subsidiary U.S. depository
institution, as of December 31, 2020, September 30, 2020 and
December 31, 2019:
Advanced Approaches Standardized Approach
In millions of dollars, except ratios
Effective
Minimum
Requirement
(1)
Dec. 31, 2020 Sept. 30, 2020 Dec. 31, 2019 Dec. 31, 2020 Sept. 30, 2020 Dec. 31, 2019
Common Equity Tier 1 Capital
(2)
$ 142,884 $ 138,310 $ 130,720 $ 142,884 $ 138,310 $ 130,720
Tier 1 Capital 144,992 140,397 132,847 144,992 140,397 132,847
Total Capital (Tier 1 Capital +
Tier 2 Capital)
(2)(3)
161,294 156,697 145,918 169,235 164,459 157,253
Total Risk-Weighted Assets 1,012,129 1,003,634 938,735 1,030,081 1,010,583 1,022,607
Credit Risk
(2)
$ 707,163 $ 706,187 $ 671,131 $ 969,416 $ 954,127 $ 993,010
Market Risk 59,815 55,853 29,167 60,665 56,456 29,597
Operational Risk 245,151 241,594 238,437 — — —
Common Equity Tier 1 Capital
ratio
(4)(5)
7.00 % 14.12 % 13.78 % 13.93 % 13.87 % 13.69 % 12.78 %
Tier 1 Capital ratio
(4)(5)
8.50 14.33 13.99 14.15 14.08 13.89 12.99
Total Capital ratio
(4)(5)
10.50 15.94 15.61 15.54 16.43 16.27 15.38
In millions of dollars, except ratios
Effective
Minimum
Requirement Dec. 31, 2020 Sept. 30, 2020 Dec. 31, 2019
Quarterly Adjusted Average Total Assets
(2)(6)
$ 1,680,056 $ 1,646,280 $ 1,459,780
Total Leverage Exposure
(2)(7)
2,167,969 2,128,033 1,958,173
Tier 1 Leverage ratio
(5)
5.0% 8.63 % 8.53 % 9.10 %
Supplementary Leverage ratio
(5)
6.0 6.69 6.60 6.78
(1) Citibank’s effective minimum risk-based capital requirements are inclusive of the 2.5% Capital Conservation Buffer (all of which must be composed of Common
Equity Tier 1 Capital).
(2) Citibank has elected to apply the modified transition provision related to the impact of the CECL accounting standard on regulatory capital, as provided by the
U.S. banking agencies’ September 2020 final rule. Under the modified CECL transition provision, the changes in retained earnings (after-tax), deferred tax assets
(DTAs) arising from temporary differences, and the ACL upon the January 1, 2020 CECL adoption date have been deferred and will phase in to regulatory capital
at 25% per year commencing January 1, 2022. For the ongoing impact of CECL, Citibank is allowed to adjust retained earnings and the ACL in an amount equal
to 25% of the change in the ACL recognized through earnings (pretax) for each period between January 1, 2020 and December 31, 2021. The cumulative
adjustments to retained earnings and the ACL between January 1, 2020 and December 31, 2021 will also phase in to regulatory capital at 25% per year
commencing January 1, 2022, along with the deferred impacts related to the January 1, 2020 CECL adoption date. Corresponding adjustments to average on-
balance sheet assets are reflected in quarterly adjusted average total assets and Total Leverage Exposure. Additionally, the increase in DTAs arising from
temporary differences upon the January 1, 2020 adoption date has been deducted from risk-weighted assets (RWA) and will phase in to RWA at 25% per year
commencing January 1, 2022.
(3) Under the Advanced Approaches framework, eligible credit reserves that exceed expected credit losses are eligible for inclusion in Tier 2 Capital to the extent that
the excess reserves do not exceed 0.6% of credit risk-weighted assets, which differs from the Standardized Approach in which the ACL is eligible for inclusion in
Tier 2 Capital up to 1.25% of credit risk-weighted assets, with any excess ACL being deducted in arriving at credit risk-weighted assets.
(4) Citibank’s reportable Total Capital ratio was derived under the Basel III Advanced Approaches framework as of December 31, 2020 and September 30, 2020, and
the Basel III Standardized Approach as of December 31, 2019, whereas Citibank’s reportable Common Equity Tier 1 Capital and Tier 1 Capital ratios were the
lower derived under the Basel III Standardized Approach framework for all periods presented.
(5) Citibank must maintain minimum Common Equity Tier 1 Capital, Tier 1 Capital, Total Capital and Tier 1 Leverage ratios of 6.5%, 8.0%, 10.0% and 5.0%,
respectively, to be considered “well capitalized” under the revised Prompt Corrective Action (PCA) regulations applicable to insured depository institutions as
established by the U.S. Basel III rules. Citibank must also maintain a minimum Supplementary Leverage ratio of 6.0% to be considered “well capitalized.”
(6) Tier 1 Leverage ratio denominator. Represents quarterly average total assets less amounts deducted from Tier 1 Capital.
(7) Supplementary Leverage ratio denominator. Citibank did not elect to temporarily exclude U.S. Treasuries and deposits at Federal Reserve Banks from Total
Leverage Exposure. For additional information, see “Temporary Supplementary Leverage Ratio Relief” above.
As indicated in the table above, Citibank’s capital ratios at
December 31, 2020 were in excess of the stated and effective
minimum requirements under the U.S. Basel III rules. In
addition, Citibank was also “well capitalized” as of December
31, 2020.
44
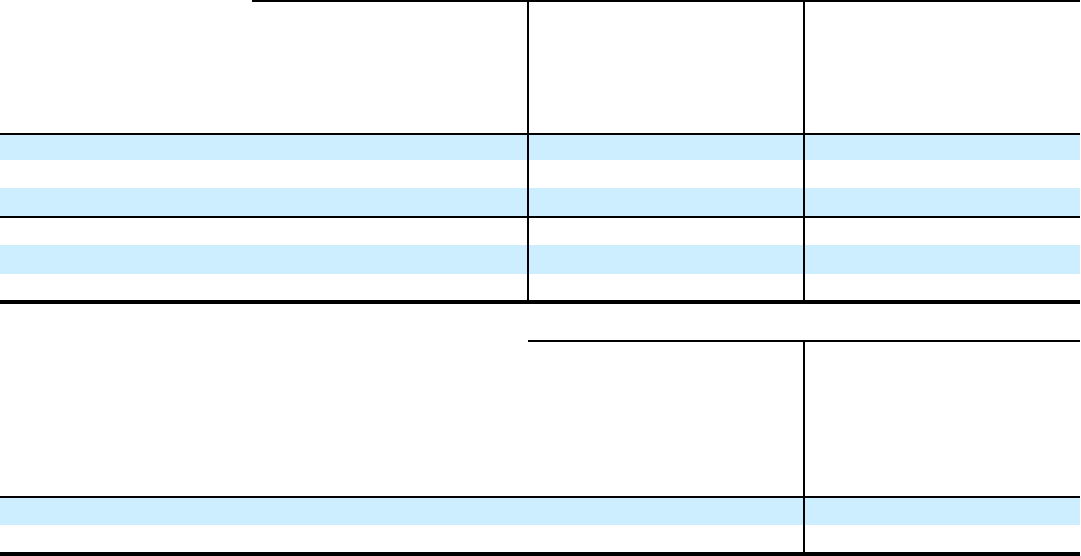
Impact of Changes on Citigroup and Citibank Capital Ratios
The following tables present the estimated sensitivity of
Citigroup’s and Citibank’s capital ratios to changes of $100
million in Common Equity Tier 1 Capital, Tier 1 Capital and
Total Capital (numerator), and changes of $1 billion in
Advanced Approaches and Standardized Approach risk-
weighted assets and quarterly adjusted average total assets, as
well as Total Leverage Exposure (denominator), as of
December 31, 2020. This information is provided for the
purpose of analyzing the impact that a change in Citigroup’s
or Citibank’s financial position or results of operations could
have on these ratios. These sensitivities only consider a single
change to either a component of capital, risk-weighted assets,
quarterly adjusted average total assets or Total Leverage
Exposure. Accordingly, an event that affects more than one
factor may have a larger basis point impact than is reflected in
these tables.
Common Equity
Tier 1 Capital ratio Tier 1 Capital ratio Total Capital ratio
In basis points
Impact of
$100 million
change in
Common
Equity
Tier 1 Capital
Impact of
$1 billion
change in risk-
weighted assets
Impact of
$100 million
change in
Tier 1 Capital
Impact of
$1 billion
change in risk-
weighted assets
Impact of
$100 million
change in
Total Capital
Impact of
$1 billion
change in risk-
weighted assets
Citigroup
Advanced Approaches 0.8 0.9 0.8 1.1 0.8 1.2
Standardized Approach 0.8 1.0 0.8 1.1 0.8 1.4
Citibank
Advanced Approaches 1.0 1.4 1.0 1.4 1.0 1.6
Standardized Approach 1.0 1.3 1.0 1.4 1.0 1.6
Tier 1 Leverage ratio Supplementary Leverage ratio
In basis points
Impact of
$100 million
change in
Tier 1 Capital
Impact of
$1 billion
change in
quarterly
adjusted
average total
assets
Impact of
$100 million
change in
Tier 1 Capital
Impact of
$1 billion
change in
Total Leverage
Exposure
Citigroup 0.4 0.3 0.4 0.3
Citibank 0.6 0.5 0.5 0.3
Citigroup Broker-Dealer Subsidiaries
At December 31, 2020, Citigroup Global Markets Inc., a U.S.
broker-dealer registered with the SEC that is an indirect
wholly owned subsidiary of Citigroup, had net capital,
computed in accordance with the SEC’s net capital rule, of
$12.7 billion, which exceeded the minimum requirement by
$9.2 billion.
Moreover, Citigroup Global Markets Limited, a broker-
dealer registered with the United Kingdom’s Prudential
Regulation Authority (PRA) that is also an indirect wholly
owned subsidiary of Citigroup, had total capital of $23.5
billion at December 31, 2020, which exceeded the PRA’s
minimum regulatory capital requirements.
In addition, certain of Citi’s other broker-dealer
subsidiaries are subject to regulation in the countries in which
they do business, including requirements to maintain specified
levels of net capital or its equivalent. Citigroup’s other
principal broker-dealer subsidiaries were in compliance with
their regulatory capital requirements at December 31, 2020.
45
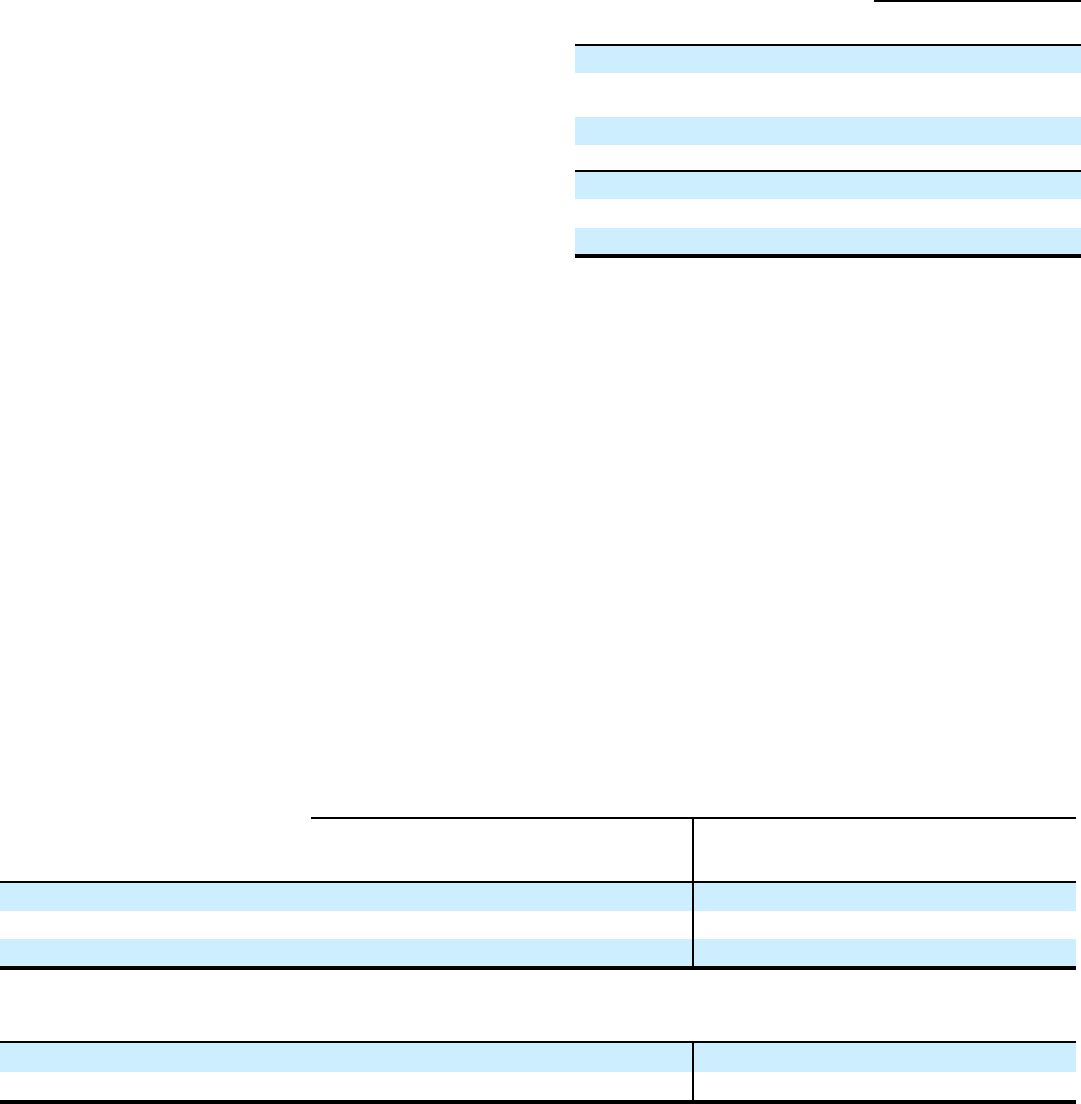
Total Loss-Absorbing Capacity (TLAC)
U.S. GSIBs, including Citi, are required to maintain minimum
levels of TLAC and eligible long-term debt (LTD), each set by
reference to the GSIB’s consolidated risk-weighted assets
(RWA) and total leverage exposure.
Minimum External TLAC Requirement
The minimum external TLAC requirement is the greater of (i)
18% of the GSIB’s RWA plus the then-applicable RWA-based
TLAC buffer (see below) and (ii) 7.5% of the GSIB’s total
leverage exposure plus a leverage-based TLAC buffer of 2%
(i.e., 9.5%).
The RWA-based TLAC buffer equals the 2.5% capital
conservation buffer, plus any applicable countercyclical
capital buffer (currently 0%), plus the GSIB’s capital
surcharge as determined under method 1 of the GSIB
surcharge rule (2.0% for Citi for 2020). Accordingly, Citi’s
total current minimum TLAC requirement was 22.5% of
RWA for 2020.
Minimum LTD Requirement
The minimum LTD requirement is the greater of (i) 6% of the
GSIB’s RWA plus its capital surcharge as determined under
method 2 of the GSIB surcharge rule (3.0% for Citi for 2020),
for a total current requirement of 9% of RWA for Citi, and (ii)
4.5% of the GSIB’s total leverage exposure.
The table below details Citi’s eligible external TLAC and
LTD amounts and ratios, and each effective minimum TLAC
and LTD ratio requirement, as well as the surplus amount in
dollars in excess of each requirement.
December 31, 2020
In billions of dollars, except ratios
External
TLAC LTD
Total eligible amount $ 311 $ 140
% of Advanced Approaches risk-
weighted assets 24.8 % 11.1 %
Effective minimum requirement
(1)(2)
22.5 9.0
Surplus amount $ 29 $ 27
% of Total Leverage Exposure
(3)
13.0 % 5.8 %
Effective minimum requirement 9.5 4.5
Surplus amount $ 85 $ 32
(1) External TLAC includes Method 1 GSIB surcharge of 2.0%.
(2) LTD includes Method 2 GSIB surcharge of 3.0%.
(3) Commencing with the second quarter of 2020, Citigroup’s Total
Leverage Exposure temporarily excludes U.S. Treasuries and deposits at
Federal Reserve Banks.
As of December 31, 2020, Citi exceeded each of the
minimum TLAC and LTD requirements, resulting in a $27
billion surplus above its binding TLAC requirement of LTD as
a percentage of Advanced Approaches risk-weighted assets.
For additional discussion of the method 1 and method 2
GSIB capital surcharge methodologies, see “Regulatory
Capital Buffers—GSIB Surcharge” above.
For additional information on Citi’s TLAC-related
requirements, see “Risk Factors—Compliance Risks” and
“Liquidity Risk—Total Loss-Absorbing Capacity (TLAC)”
below.
Capital Resources (Full Adoption of CECL, and Excluding Temporary Supplementary Leverage Ratio Relief for Citigroup)
The following tables set forth Citigroup’s and Citibank’s capital components and ratios reflecting the full impact of CECL, and
excluding temporary Supplementary Leverage ratio relief for Citigroup, as of December 31, 2020:
Citigroup Citibank
Effective
Minimum
Requirement
Advanced
Approaches
Standardized
Approach
Effective
Minimum
Requirement
Advanced
Approaches
Standardized
Approach
Common Equity Tier 1 Capital ratio 10.0 % 11.34 % 11.65 % 7.0 % 13.67 % 13.43 %
Tier 1 Capital ratio 11.5 12.92 13.28 8.5 13.88 13.64
Total Capital ratio 13.5 15.23 16.38 10.5 15.50 16.00
Effective
Minimum
Requirement Citigroup
Effective
Minimum
Requirement Citibank
Tier 1 Leverage ratio 4.0 % 7.15 % 5.0 % 8.36 %
Supplementary Leverage ratio
(1)
5.0 5.73 6.0 6.47
(1) Citigroup’s Supplementary Leverage ratio, as presented in the table above, reflects the full impact of CECL as well as the inclusion of U.S. Treasuries and
deposits at Federal Reserve Banks in Total Leverage Exposure.
46
Regulatory Capital Standards Developments
U.S. Banking Agencies
TLAC Holdings
In January 2021, the U.S. banking agencies issued a final rule
that creates a new regulatory capital deduction applicable to
Advanced Approaches banking organizations for certain
investments in covered debt instruments issued by GSIBs. The
final rule is substantially consistent with an April 2019
proposal, and is intended to reduce interconnectedness and
systemic risk by creating an incentive for Advanced
Approaches banking organizations to limit their exposure to
GSIBs.
Under the U.S. Basel III rules, non-significant
investments in the capital of unconsolidated financial
institutions are subject to deduction from regulatory capital
using the corresponding deduction approach if, in the
aggregate, they exceed 10% of the banking organization’s
Common Equity Tier 1 Capital. Non-significant investments
in the capital of unconsolidated financial institutions that are
not deducted from regulatory capital are risk weighted in the
usual manner.
Under the final rule, an investment in a “covered debt
instrument” will be treated as an investment in a Tier 2 Capital
instrument and, therefore, will be subject to deduction from
the Advanced Approaches banking organization’s own Tier 2
Capital in accordance with the existing rules for non-
significant investments in unconsolidated financial
institutions. Covered debt instruments include unsecured debt
instruments that are “eligible debt securities” for purposes of
the TLAC rule, or that are pari passu or subordinated to such
securities, in addition to certain unsecured debt instruments
issued by foreign GSIBs.
To support a deep and liquid market for covered debt
instruments, the rule provides an exception from the approach
described above for covered debt instruments held for market-
making activities for 30 days or less (or longer, for synthetic
exposures only), if the aggregate amount of such debt
instruments does not exceed 5% of the banking organization’s
Common Equity Tier 1 Capital.
Additionally, the final rule requires banking organizations
to deduct from Tier 2 Capital investments in their own covered
debt instruments.
The final rule will become effective for Citigroup and
Citibank on April 1, 2021. Citi estimates that the final rule will
not significantly impact Citigroup or Citibank’s regulatory
capital upon adoption.
Standardized Approach for Counterparty Credit Risk
In January 2020, the U.S. banking agencies issued a final
rule to introduce the Standardized Approach for
Counterparty Credit Risk (SA-CCR) in the U.S. The
mandatory compliance date of the SA-CCR final rule is
January 1, 2022, and early adoption was originally
permitted beginning April 1, 2020. For additional
information on the SA-CCR final rule, see “Capital
Resources—Regulatory Capital Standards Developments”
in Citi’s 2019 Annual Report on Form 10-K.
In March 2020, the U.S. banking agencies issued an
interim final rule permitting banks to early adopt the SA-CCR
final rule beginning with the quarter ended March 31,
2020.
Citi has not early adopted the SA-CCR final rule. Citi
intends to implement SA-CCR upon the mandatory
compliance date of January 1, 2022.
Basel Committee
Deferral of Basel III Revisions
In April 2020, in light of the COVID-19 pandemic, the
Basel Committee on Banking Supervision (Basel
Committee) announced that the implementation date of the
Basel III post-crisis regulatory reforms finalized in
December 2017 has been deferred by one year to January 1,
2023. The reforms relate to the methodologies in deriving
credit and operational risk-weighted assets, the imposition
of a new aggregate output floor for risk-weighted assets,
and revisions to the leverage ratio framework. The Basel
Committee also announced that the implementation date of
the revised market risk framework finalized in January
2019 has been deferred by one year to January 1, 2023.
The U.S. banking agencies may revise the U.S. Basel
III rules in the future, in response to the Basel Committee’s
Basel III post-crisis regulatory reforms and revised market
risk framework.
Targeted Revisions to the Credit Valuation Adjustment
Framework
In July 2020, the Basel Committee issued a standard with
targeted revisions to the credit valuation adjustment (CVA)
risk framework, which was previously finalized in December
2017 and will become effective on January 1, 2023. The
revisions align the revised CVA risk framework, in part, with
the revised market risk capital framework that was finalized in
January 2019. The Basel Committee also adjusted the overall
calibration of capital requirements calculated under their CVA
risk framework.
The U.S. agencies may consider revisions to the CVA risk
framework under the U.S. Basel III rules in the future, based
upon the revisions adopted by the Basel Committee.
47
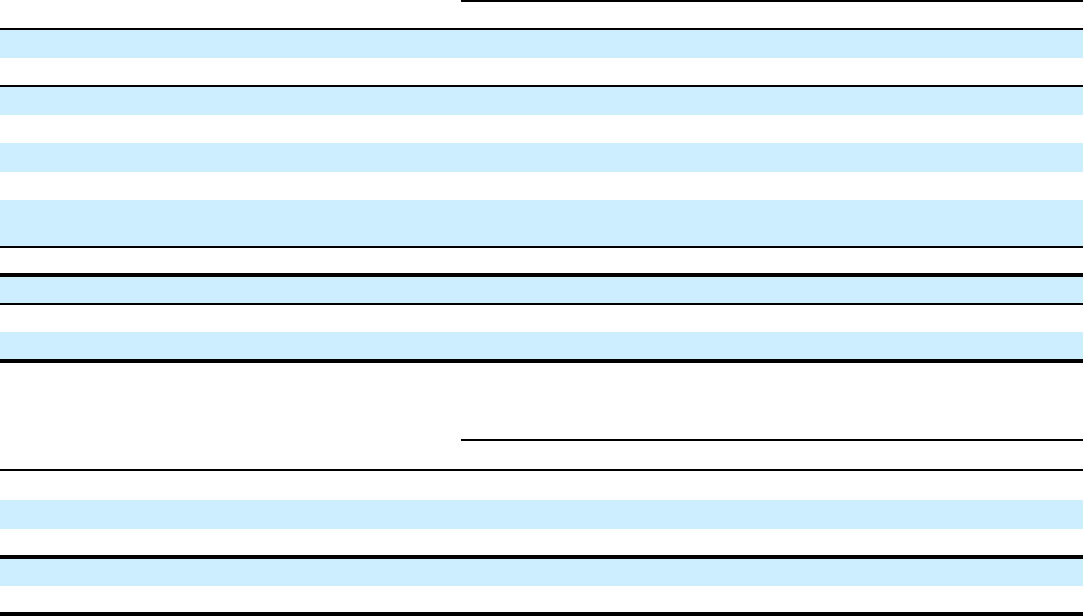
Tangible Common Equity, Book Value Per Share,
Tangible Book Value Per Share and Returns on Equity
Tangible common equity (TCE), as defined by Citi, represents
common stockholders’ equity less goodwill and identifiable
intangible assets (other than MSRs). Other companies may
calculate TCE in a different manner. TCE, tangible book value
(TBV) per share and returns on average TCE are non-GAAP
financial measures. Citi believes the presentation of TCE,
TBV per share and returns on average TCE provides alternate
measures of capital strength and performance for investors,
industry analysts and others.
At December 31,
In millions of dollars or shares, except per share amounts
2020 2019 2018 2017 2016
Total Citigroup stockholders’ equity $ 199,442 $ 193,242 $ 196,220 $ 200,740 $ 225,120
Less: Preferred stock 19,480 17,980 18,460 19,253 19,253
Common stockholders’ equity $ 179,962 $ 175,262 $ 177,760 $ 181,487 $ 205,867
Less:
Goodwill 22,162 22,126 22,046 22,256 21,659
Identifiable intangible assets (other than MSRs) 4,411 4,327 4,636 4,588 5,114
Goodwill and identifiable intangible assets
(other than MSRs) related to assets held-for-sale (HFS) — — — 32 72
Tangible common equity (TCE) $ 153,389 $ 148,809 $ 151,078 $ 154,611 $ 179,022
Common shares outstanding (CSO) 2,082.1 2,114.1 2,368.5 2,569.9 2,772.4
Book value per share (common equity/CSO) $ 86.43 $ 82.90 $ 75.05 $ 70.62 $ 74.26
Tangible book value per share (TCE/CSO) 73.67 70.39 63.79 60.16 64.57
For the year ended December 31,
In millions of dollars
2020 2019 2018 2017
(1)
2016
Net income available to common shareholders $ 9,952 $ 18,292 $ 16,871 $ 14,583 $ 13,835
Average common stockholders’ equity 175,508 177,363 179,497 207,747 209,629
Average TCE 149,892 150,994 153,343 180,458 182,135
Return on average common stockholders’ equity 5.7 % 10.3 % 9.4 % 7.0 % 6.6 %
Return on average TCE (RoTCE)
(2)
6.6 12.1 11.0 8.1 7.6
(1) Year ended December 31, 2017 excludes the one-time impact of Tax Reform. Citi believes the presentation of its 2017 RoTCE excluding the impact of Tax
Reform provides a meaningful depiction of the underlying performance of its business for investors, industry analysts and others. For a reconciliation of these
measures, see “Significant Accounting Policies and Significant Estimates—Income Taxes” below.
(2) RoTCE represents net income available to common shareholders as a percentage of average TCE.
48
RISK FACTORS
The following discussion sets forth what management
currently believes could be the material risks and uncertainties
that could impact Citi’s businesses, results of operations and
financial condition. Other risks and uncertainties, including
those not currently known to Citi or its management, could
also negatively impact Citi’s businesses, results of operations
and financial condition. Thus, the following should not be
considered a complete discussion of all of the risks and
uncertainties Citi may face.
STRATEGIC RISKS
Rapidly Evolving Challenges and Uncertainties Related to
the COVID-19 Pandemic Will Likely Continue to Have
Negative Impacts on Citi’s Businesses and Results of
Operations and Financial Condition.
The COVID-19 pandemic has become global, affecting all of
the countries and jurisdictions where Citi operates. The
pandemic and responses to it have had, and will likely
continue to have, severe impacts on global health and
economic conditions. These impacts will continue to evolve
by region, country or state, largely depending on the duration
and severity of the public health consequences, including the
duration and further spread of the coronavirus; the potential
for new variants of the virus; timely development, production
and distribution of effective vaccines; availability of
therapeutics; public response; and government actions. The
impacts to global economic conditions include, among others:
• the institution of social distancing and restrictions on
businesses and the movement of the public in and among
the U.S. and other countries;
• closures, reduced activity and failures of many businesses,
leading to loss of revenues and net losses;
• sharply reduced U.S. and global economic output,
resulting in significant losses of employment and lower
consumer spending, cards purchase sales and loan
volumes;
• lower interest rates;
• disruption of global supply chains; and
• significant disruption and volatility in financial markets.
The pandemic has had, and will likely continue to have,
negative impacts on Citi’s businesses and overall results of
operations and financial condition, which could be material.
The extent of the impact on Citi’s operations and financial
performance, including its ability to execute its business
strategies and initiatives, will continue to depend significantly
on future developments in the U.S. and globally, which are
uncertain and cannot be predicted, including the course of the
virus, as well as any delay or weakness in the economic
recovery or further economic downturn.
Ongoing legislative and regulatory changes in the U.S.
and globally to address the economic impact from the
pandemic, such as consumer and corporate relief measures and
continued lower interest rates, could further affect Citi’s
businesses, operations and financial performance. Citi could
also face challenges, including legal and reputational, and
scrutiny in its implementation of and ongoing efforts to
provide these relief measures. Such implementations and
efforts have resulted in, and may continue to result in,
litigation, including class actions, and regulatory and
government actions and proceedings. Such actions may result
in judgments, settlements, penalties and fines adverse to Citi.
In addition, the different types of government actions could
vary in scale and duration across jurisdictions and regions with
varying degrees of effectiveness.
The impact of the pandemic on Citi’s consumer and
corporate borrowers will also vary by sector or industry, with
some borrowers experiencing greater stress levels, which
could lead to increased pressure on their results of operations
and financial condition, increased borrowings or credit ratings
downgrades, thus likely leading to higher credit costs for Citi.
In addition, stress levels ultimately experienced by Citi’s
borrowers may be different from and more intense than
assumptions made in earlier estimates or models used by Citi,
resulting in a further increase in Citi’s ACL or net credit
losses, particularly as consumer and small business relief
programs expire and the benefits of fiscal stimulus start to
diminish.
The pandemic may not be contained for an extended
period of time. A prolonged health crisis could further reduce
economic activity in the U.S. and other countries, resulting in
additional declines in employment and business and consumer
confidence. These factors could further negatively impact
global economic activity and markets; cause a continued
decline in the demand for Citi’s products and services and in
its revenues; further increase Citi’s credit and other costs; and
may result in impairment of long-lived assets or goodwill.
These factors could also cause a continued increase in Citi’s
balance sheet, risk-weighted assets and ACL, resulting in a
decline in regulatory capital ratios or liquidity measures, as
well as regulatory demands for higher capital levels and/or
limitations or reductions in capital distributions (such as
common share repurchases and dividends). Moreover, any
disruption or failure of Citi’s performance of, or its ability to
perform, key business functions, as a result of the continued
spread of COVID-19 or otherwise, could adversely affect
Citi’s operations.
Any disruption to, breaches of or attacks on Citi’s
information technology systems, including from cyber
incidents, could have adverse effects on Citi’s businesses (see
the operational processes and systems and cybersecurity risk
factors below). These systems are supporting a substantial
portion of Citi’s colleagues who have been affected by local
pandemic restrictions and have been forced to work remotely.
In addition, these systems interface with and depend on third-
party systems, and Citi could experience service denials or
disruptions if demand for such systems were to exceed
capacity or if a third-party system fails or experiences any
interruptions. Citi has also taken measures to maintain the
health and safety of its colleagues; however, these measures
could result in increased expenses, and widespread illness
could negatively affect staffing within certain functions,
businesses or geographies. In addition, Citi’s ability to recruit,
hire and onboard colleagues in key areas could be negatively
impacted by global pandemic restrictions (see the qualified
colleagues risk factor below).
49
Further, it is unclear how the macroeconomic business
environment or societal norms may be impacted after the
pandemic. The post-pandemic environment may undergo
unexpected developments or changes in financial markets, the
fiscal, monetary, tax and regulatory environments and
consumer customer and corporate client behavior. These
developments and changes could have an adverse impact on
Citi’s results of operations and financial condition. Ongoing
business and regulatory uncertainties and changes may make
Citi’s longer-term business, balance sheet and strategic and
budget planning more difficult or costly. Citi and its
management and businesses may also experience increased or
different competitive and other challenges in this environment.
To the extent that it is not able to adapt or compete effectively,
Citi could experience loss of business and its results of
operations and financial condition could suffer (see the
competitive challenges risk factor below).
For additional information about trends, uncertainties and
risks related to the pandemic, as well as Citi’s management of
pandemic-related risks, see “COVID-19 Pandemic Overview”
above.
Citi’s Ability to Return Capital to Common Shareholders
Consistent with Its Capital Planning Efforts and Targets
Substantially Depends on Regulatory Capital Requirements,
Including the Results of the CCAR Process and Regulatory
Stress Tests.
Citi’s ability to return capital to its common shareholders
consistent with its capital planning efforts and targets, whether
through its common stock dividend or through a share
repurchase program, substantially depends, among other
things, on regulatory capital requirements, including the Stress
Capital Buffer (SCB), which is based upon the results of the
CCAR process required by the Federal Reserve Board (FRB)
as well as the supervisory stress tests required under the Dodd-
Frank Act (as described in more detail below). Citi’s ability to
return capital also depends on its results of operations and
financial condition, forecasts of macroeconomic conditions
and effectiveness in managing its level of risk-weighted assets
under both the Advanced Approaches and the Standardized
Approach, Supplementary Leverage Ratio (SLR) and global
systemically important bank holding company (GSIB)
surcharge, which has been made more challenging due to the
pandemic-related elevated levels of liquidity in the financial
system (see macroeconomic challenges and uncertainties risk
factor below).
Citi’s ability to accurately predict, interpret or explain to
stakeholders the results of the CCAR process, and thus to
address any market or investor perceptions, may be limited as
the FRB’s assessment of Citi’s capital adequacy is conducted
using the FRB’s proprietary stress test models. In addition, all
CCAR firms, including Citi, will continue to be subject to a
rigorous evaluation of their capital planning practices,
including, but not limited to, governance, risk management
and internal controls. For additional information on limitations
on Citi’s ability to return capital to common shareholders, as
well as the CCAR process, supervisory stress test
requirements and GSIB surcharge, see “Capital Resources—
Overview” and “Capital Resources—Stress Testing
Component of Capital Planning” above and the risk
management risk factor below.
The FRB has stated that it expects leading capital
adequacy practices to continue to evolve and to likely be
determined by the FRB each year as a result of its cross-firm
review of capital plan submissions. Similarly, the FRB has
indicated that, as part of its stated goal to continually evolve
its annual stress testing requirements, several parameters of
the annual stress testing process may continue to be altered,
including the severity of the stress test scenario, the FRB
modeling of Citi’s balance sheet pre-provision net revenue
(PPNR) and stress losses, and the addition of components
deemed important by the FRB.
Beginning January 1, 2022, Citi will be required to phase
into regulatory capital at 25% per year the changes in retained
earnings, deferred tax assets and ACL determined upon the
January 1, 2020 CECL adoption date as well as subsequent
changes in the ACL between January 1, 2020 and December
31, 2021. The FRB has stated that it plans to maintain its
current framework for calculating allowances on loans in the
supervisory stress test for the 2021 supervisory stress test
cycle, and to evaluate appropriate future enhancements to this
framework as best practices for implementing the current
expected credit losses (CECL) methodology are developed.
The impacts on Citi’s capital adequacy of the FRB’s
incorporation of CECL in its supervisory stress tests on an
ongoing basis, and of other potential regulatory changes in the
FRB’s stress testing methodologies, remain unclear. For
additional information regarding the CECL methodology,
including the transition provisions related to the adverse
regulatory capital effects resulting from adoption of the CECL
methodology, see “Capital Resources—Current Regulatory
Capital Standards—Regulatory Capital Treatment—Modified
Transition of the Current Expected Credit Losses (CECL)
Methodology” above and Note 1 to the Consolidated Financial
Statements.
In addition, the FRB has integrated the annual stress
testing requirements with ongoing regulatory capital
requirements. For Citigroup, the SCB rule replaced the fixed
2.5% Capital Conservation Buffer in Citi’s ongoing regulatory
capital requirements for the Standardized Approach capital
ratios. The SCB equals the maximum decline in Citi’s
Common Equity Tier 1 Capital ratio under a severely adverse
scenario over a nine-quarter CCAR measurement period, plus
four quarters of planned common stock dividends, subject to a
minimum requirement of 2.5%. Effective October 1, 2020,
Citi’s SCB was 2.5%. The SCB is calculated by the FRB using
its proprietary data and modeling of each firm’s results.
Accordingly, Citi’s SCB may change annually, or possibly
more frequently, based on the supervisory stress test results,
thus potentially resulting in volatility in the calculation of the
SCB. Similar to the Capital Conservation Buffer, a breach of
the SCB would result in graduated limitations on capital
distributions. For additional information on the SCB,
including its calculation, see “Capital Resources—Regulatory
Capital Buffers” above.
Although various uncertainties exist regarding the extent
of, and the ultimate impact to Citi from, these changes to the
FRB’s stress testing and CCAR regimes, these changes could
increase the level of capital Citi is required or elects to hold,
50
including as part of Citi’s management buffer, thus potentially
impacting the extent to which Citi is able to return capital to
shareholders.
Citi, Its Management and Its Businesses Must Continually
Review, Analyze and Successfully Adapt to Ongoing
Regulatory and Legislative Uncertainties and Changes in the
U.S. and Globally.
Despite the adoption of final regulations and laws in numerous
areas impacting Citi and its businesses over the past several
years, Citi, its management and its businesses continually face
ongoing regulatory and legislative uncertainties and changes,
both in the U.S. and globally. While the areas of ongoing
regulatory and legislative uncertainties and changes facing Citi
are too numerous to list completely, various examples include,
but are not limited to (i) potential fiscal, monetary, regulatory,
tax and other changes arising from the U.S. federal
government and other governments, including as a result of
the new U.S. presidential administration, regulatory leadership
and Congress or in response to the pandemic; (ii) potential
changes to various aspects of the regulatory capital framework
and requirements applicable to Citi (see the capital return risk
factor and “Capital Resources—Regulatory Capital Standards
Developments” above); and (iii) the future legislative and
regulatory framework resulting from the U.K.’s exit from the
European Union (EU), including, among others, with respect
to financial services (see “Managing Global Risk—Strategic
Risk—U.K.’s Future Relationship with the EU” below). When
referring to “regulatory,” Citi is including both formal
regulation and the views and expectations of its regulators in
their supervisory roles.
Ongoing regulatory and legislative uncertainties and
changes make Citi’s and its management’s long-term business,
balance sheet and strategic budget planning difficult, subject
to change and potentially more costly. U.S. and other
regulators globally have implemented and continue to discuss
various changes to certain regulatory requirements, which
would require ongoing assessment by management as to the
impact to Citi, its businesses and business planning. For
example, while the Basel III post-crisis regulatory reforms and
revised market risk framework have been finalized at the
international level, there remain significant uncertainties with
respect to the integration of these revisions into the U.S.
regulatory capital framework. Business planning is required to
be based on possible or proposed rules or outcomes, which can
change dramatically upon finalization, or upon
implementation or interpretive guidance from numerous
regulatory bodies worldwide, and such guidance can change.
Moreover, U.S. and international regulatory and
legislative initiatives have not always been undertaken or
implemented on a coordinated basis, and areas of divergence
have developed and continue to develop with respect to the
scope, interpretation, timing, structure or approach, leading to
inconsistent or even conflicting requirements, including within
a single jurisdiction. For example, in May 2019, the European
Commission adopted, as part of Capital Requirements
Directive V (CRD V), a new requirement for major banking
groups headquartered outside the EU (which would include
Citi) to establish an intermediate EU holding company where
the foreign bank has two or more institutions (broadly
meaning banks, broker-dealers and similar financial firms)
established in the EU. While in some respects the requirement
mirrors an existing U.S. requirement for non-U.S. banking
organizations to form U.S. intermediate holding companies,
the implementation of the EU holding company requirement
could lead to additional complexity with respect to Citi’s
resolution planning, capital and liquidity allocation and
efficiency in various jurisdictions.
Regulatory and legislative changes have also significantly
increased Citi’s compliance risks and costs (see the
implementation and interpretation of regulatory changes risk
factor below).
Citi’s Continued Investments and Efficiency Initiatives May
Not Be as Successful as It Projects or Expects.
Citi continues to leverage its scale and make incremental
investments to deepen client relationships, increase revenues
and lower expenses, as well as significant investments to
transform its infrastructure, risk management and controls and
further enhance safety and soundness (for additional
information, see the legal and regulatory proceedings risk
factor below). For example, Citi continues to make
investments to enhance its digital capabilities across the
franchise, including digital platforms and mobile and cloud-
based solutions. Citi also has been making investments across
the firm, such as in the U.S. consumer franchise, Citi’s wealth
management businesses and treasury and trade solutions,
securities services and other businesses in ICG, including
implementing new capabilities and partnerships. Further, Citi
has been pursuing efficiency improvements through various
technology and digital initiatives, organizational simplification
and location strategies.
Citi’s investments and efficiency initiatives are being
undertaken as part of its overall strategy to meet operational
and financial objectives, including, among others, those
relating to shareholder returns. Additionally, in connection
with Citi’s CEO transition, Citi is undergoing an evaluation of
its strategy, which may result in, among other things,
additional investments as well as changes in or exits of
businesses. There is no guarantee that these or other initiatives
Citi may pursue will be as productive or effective as Citi
expects, or at all. Additionally, such initiatives could result in
losses, charges or other negative financial impacts. Citi’s
investment and efficiency initiatives may continue to evolve as
its business strategies, the market environment and regulatory
expectations change, which could make the initiatives more
costly and more challenging to implement, and limit their
effectiveness. Moreover, Citi’s ability to achieve expected
returns on its investments and costs savings depends, in part,
on factors that it cannot control, such as macroeconomic
conditions, including the negative impacts related to the
pandemic, customer, client and competitor actions and
ongoing regulatory changes, among others.
Uncertainties Regarding the Transition Away from or
Discontinuance of the London Inter-Bank Offered Rate
(LIBOR) or Any Other Interest Rate Benchmark Could
Have Adverse Consequences for Market Participants,
Including Citi.
LIBOR continues to be widely used as a “benchmark” or
“reference rate” across financial products and markets
51
globally. Based on statements from U.S. and U.K. authorities,
it is expected, however, that all non-U.S. dollar LIBOR tenors
and some USD LIBOR tenors will cease after December 31,
2021, while most U.S. dollar LIBOR tenors will continue to be
quoted through June 2023. As a result of LIBOR’s wide use,
there can be no assurance that market participants, including
Citi, will be able to successfully modify all outstanding
LIBOR-based securities or products or be sufficiently
prepared for all of the uncertainties resulting from LIBOR’s
discontinuance. In addition, following guidance provided by
the Financial Stability Board, regulators have suggested
reforming or replacing other benchmark rates with alternative
reference rates. The transition away from and discontinuance
of LIBOR or any other benchmark rate presents various
uncertainties, risks and challenges to holders of LIBOR-based
securities and products as well as financial markets and
institutions, including Citi. These include, among others, the
pricing, liquidity, value of, return on and market for financial
instruments and contracts that reference LIBOR or any other
benchmark rate, including any alternative benchmark rate.
Despite ongoing actions by Citi to prepare for the
transition away from LIBOR (see “Managing Global Risk—
Strategic Risk—LIBOR Transition Risk” below), Citi has
continued to meet market demand by trading, holding or
otherwise using a substantial amount of securities or products
that reference LIBOR, including, among others, derivatives,
corporate loans, commercial and residential mortgages, credit
cards, securitized products and other structured securities. The
transition away from and discontinuation of LIBOR for these
securities and products presents significant operational, legal,
reputational or compliance, financial and other risks to Citi.
For example, the LIBOR transition presents various
challenges related to contractual mechanics of existing
floating rate financial instruments and contracts that reference
LIBOR and mature after discontinuance of the relevant
LIBOR. Certain of these legacy instruments and contracts do
not provide for alternative benchmark rates, which makes it
unclear what the future benchmark rates would be after
LIBOR’s cessation. Further, Citi may not be able to amend
certain instruments and contracts due to an inability to obtain
sufficient required consent from counterparties or security
holders. Even if the instruments and contracts provide for a
transition to alternative benchmark rates, the new benchmark
rates may, particularly in times of financial stress, significantly
differ from the prior rates. As a result, Citi may need to
proactively address any contractual uncertainties or rate
differences in such instruments and contracts, which would
likely be both time consuming and costly, and may not
ultimately be successful.
In addition, the transition away from and discontinuance
of LIBOR could result in disputes, including litigation,
involving holders of outstanding instruments and contracts
that reference LIBOR, whether or not the underlying
documentation provides for alternative benchmark rates. Citi
will also need to further invest in and develop significant
internal systems and infrastructure to transition to alternative
benchmark rates to manage its businesses and support its
clients.
Citi’s Ability to Utilize Its DTAs, and Thus Reduce the
Negative Impact of the DTAs on Citi’s Regulatory Capital,
Will Be Driven by Its Ability to Generate U.S. Taxable
Income.
At December 31, 2020, Citi’s net DTAs were $24.8 billion,
net of a valuation allowance of $5.2 billion, of which $9.5
billion was excluded from Citi’s Common Equity Tier 1
Capital under the U.S. Basel III rules, primarily relating to net
operating losses, foreign tax credit and general business credit
carry-forwards (for additional information, see “Capital
Resources—Components of Citigroup Capital” above). Of the
net DTAs at December 31, 2020, $4.4 billion related to
foreign tax credit carry-forwards (FTCs), net of a valuation
allowance. The carry-forward utilization period for FTCs is
ten years and represents the most time-sensitive component of
Citi’s DTAs. The FTC carry-forwards at December 31, 2020
expire over the period of 2021–2029. Citi must utilize any
FTCs generated in the then-current-year tax return prior to
utilizing any carry-forward FTCs.
The accounting treatment for realization of DTAs,
including FTCs, is complex and requires significant judgment
and estimates regarding future taxable earnings in the
jurisdictions in which the DTAs arise and available tax
planning strategies. Forecasts of future taxable earnings will
depend upon various factors, including, among others, the
continued impact of the pandemic and other macroeconomic
conditions. In addition, any future increase in U.S. corporate
tax rates could result in an increase in Citi’s DTA, which may
subject more of Citi’s existing DTA to exclusion from
regulatory capital while improving Citi’s ability to utilize its
FTC carry-forwards. Citi’s overall ability to realize its DTAs
will primarily be dependent upon its ability to generate U.S.
taxable income in the relevant tax carry-forward periods.
Although utilization of FTCs in any year is generally limited
to 21% of foreign source taxable income in that year, overall
domestic losses (ODL) that Citi has incurred in the past allow
it to reclassify domestic source income as foreign source.
Failure to realize any portion of the net DTAs would have a
corresponding negative impact on Citi’s net income and
financial returns.
Citi does not expect to be subject to the Base Erosion
Anti-Abuse Tax (BEAT), which, if applicable to Citi in any
given year, would have a significantly adverse effect on both
Citi’s net income and regulatory capital.
For additional information on Citi’s DTAs, including
FTCs, see “Significant Accounting Policies and Significant
Estimates—Income Taxes” below and Notes 1 and 9 to the
Consolidated Financial Statements.
Citi’s Interpretation or Application of the Complex Tax
Laws to Which It Is Subject Could Differ from Those of the
Relevant Governmental Authorities, Which Could Result in
the Payment of Additional Taxes, Penalties or Interest.
Citi is subject to various income-based tax laws of the U.S.
and its states and municipalities, as well as the numerous non-
U.S. jurisdictions in which it operates. These tax laws are
inherently complex and Citi must make judgments and
interpretations about the application of these laws, including
the Tax Cuts and Jobs Act (Tax Reform), to its entities,
operations and businesses. In addition, Citi is subject to
52
litigation or examinations with U.S. and non-U.S. tax
authorities regarding non-income-based tax matters. Citi’s
interpretations or application of the tax laws, including with
respect to Tax Reform, withholding, stamp, service and other
non-income taxes, could differ from that of the relevant
governmental taxing authority, which could result in the
requirement to pay additional taxes, penalties or interest,
which could be material. For additional information on the
litigation and examinations involving non-U.S. tax authorities,
see Note 27 to the Consolidated Financial Statements.
Citi’s Presence in the Emerging Markets Subjects It to
Various Risks as well as Increased Compliance and
Regulatory Risks and Costs.
During 2020, emerging markets revenues accounted for
approximately 34% of Citi’s total revenues (Citi generally
defines emerging markets as countries in Latin America, Asia
(other than Japan, Australia and New Zealand), and central
and Eastern Europe, the Middle East and Africa in EMEA).
Although Citi continues to pursue its target client strategy,
Citi’s presence in the emerging markets subjects it to various
risks, such as limitations of hedges on foreign investments;
foreign currency volatility, including devaluations, sovereign
volatility, election outcomes, regulatory changes and political
events; foreign exchange controls; limitations on foreign
investment; sociopolitical instability (including from
hyperinflation); fraud; nationalization or loss of licenses;
business restrictions; sanctions or asset freezes; potential
criminal charges; closure of branches or subsidiaries; and
confiscation of assets, and these risks can be exacerbated in
the event of a deterioration in relationships between the U.S.
and an emerging market country. For example, Citi operates in
several countries that have, or have had in the past, strict
capital and currency controls, such as Argentina, that limit its
ability to convert local currency into U.S. dollars and/or
transfer funds outside of those countries (for further
information, see “Strategic Risk—Country Risk—Argentina”
below).
Moreover, if the economic situation in an emerging
markets country where Citi operates were to deteriorate below
a certain level, U.S. regulators may impose mandatory loan
loss or other reserve requirements on Citi, which would
increase its credit costs and decrease its earnings (for further
information, see “Strategic Risk—Country Risk—Argentina”
below). In addition, political turmoil and instability have
occurred in certain regions and countries, including Asia, the
Middle East and Latin America, which have required, and may
continue to require, management time and attention and other
resources (such as monitoring the impact of sanctions on
certain emerging markets economies as well as impacting
Citi’s businesses and results of operations in affected
countries).
Citi’s emerging markets presence also increases its
compliance and regulatory risks and costs. For example, Citi’s
operations in emerging markets, including facilitating cross-
border transactions on behalf of its clients, subject it to higher
compliance risks under U.S. regulations that are primarily
focused on various aspects of global corporate activities, such
as anti-money laundering regulations and the Foreign Corrupt
Practices Act. These risks can be more acute in less developed
markets and thus require substantial investment in compliance
infrastructure or could result in a reduction in certain of Citi’s
business activities. Any failure by Citi to comply with
applicable U.S. regulations, as well as the regulations in the
countries and markets in which it operates as a result of its
global footprint, could result, even if the regulations require
inconsistent results, in legal or regulatory proceedings, fines,
penalties, injunctions or other similar restrictions, many of
which could negatively impact Citi’s results of operations and
reputation (see the implementation and interpretation of
regulatory changes and legal and regulatory proceedings risk
factors below).
A Deterioration in or Failure to Maintain Citi’s Co-
Branding or Private Label Credit Card Relationships,
Including as a Result of Any Bankruptcy or Liquidation,
Could Have a Negative Impact on Citi’s Results of
Operations or Financial Condition.
Citi has co-branding and private label relationships through its
Citi-branded cards and Citi retail services credit card
businesses with various retailers and merchants globally,
whereby in the ordinary course of business Citi issues credit
cards to customers of the retailers or merchants. Citi’s co-
branding and private label agreements provide for shared
economics between the parties and generally have a fixed
term. The five largest relationships across both businesses in
North America GCB constituted an aggregate of
approximately 10% of Citi’s revenues in 2020 (for additional
information, see “Global Consumer Banking—North America
GCB” above).
Over the last several years, a number of U.S. retailers
have continued to experience declining sales, which has
resulted in significant numbers of store closures and, in a
number of cases, bankruptcies, as retailers attempt to cut costs
and reorganize. The pandemic has exacerbated these trends
and generally resulted in a challenging operating environment
for retailers and merchants. In addition, as has been widely
reported, competition among card issuers, including Citi, for
these relationships is significant, and it has become
increasingly difficult in recent years to maintain such
relationships on the same terms or at all.
Citi’s co-branding and private label relationships could
continue to be negatively impacted by, among other things, the
general economic environment; declining sales and revenues,
partner store closures, government imposed restrictions,
reduced air and business travel, or other operational
difficulties of the retailer or merchant; termination due to a
contractual breach by Citi or by the retailer or merchant; or
other factors, including bankruptcies, liquidations,
restructurings, consolidations or other similar events, whether
due to the ongoing impact of the pandemic or otherwise (see
the pandemic-related risk factor above).
While various mitigating factors could be available to Citi
if any of the above events were to occur—such as by replacing
the retailer or merchant or offering other card products—these
events, particularly bankruptcies or liquidations, could
negatively impact the results of operations or financial
condition of Citi-branded cards, Citi retail services or Citi as a
whole, including as a result of loss of revenues, increased
expenses, higher cost of credit, impairment of purchased credit
53
card relationships and contract-related intangibles or other
losses (for information on Citi’s credit card related intangibles
generally, see Note 16 to the Consolidated Financial
Statements).
Citi’s Inability in Its Resolution Plan Submissions to
Address Any Shortcomings or Deficiencies Identified or
Guidance Provided by the FRB and FDIC Could Subject Citi
to More Stringent Capital, Leverage or Liquidity
Requirements, or Restrictions on Its Growth, Activities or
Operations, and Could Eventually Require Citi to Divest
Assets or Operations.
Title I of the Dodd-Frank Act requires Citi to prepare and
submit a plan to the FRB and the FDIC for the orderly
resolution of Citigroup (the bank holding company) and its
significant legal entities under the U.S. Bankruptcy Code in
the event of future material financial distress or failure. On
December 17, 2019, the FRB and FDIC issued feedback on
the resolution plans filed on July 1, 2019 by the eight U.S.
GSIBs, including Citi. The FRB and FDIC identified one
shortcoming, but no deficiencies, in Citi’s resolution plan
relating to governance mechanisms. For additional
information on Citi’s resolution plan submissions, see
“Managing Global Risk—Liquidity Risk” below.
Under Title I, if the FRB and the FDIC jointly determine
that Citi’s resolution plan is not “credible” (which, although
not defined, is generally believed to mean the regulators do
not believe the plan is feasible or would otherwise allow Citi
to be resolved in a way that protects systemically important
functions without severe systemic disruption), or would not
facilitate an orderly resolution of Citi under the U.S.
Bankruptcy Code, and Citi fails to resubmit a resolution plan
that remedies any identified deficiencies, Citi could be
subjected to more stringent capital, leverage or liquidity
requirements, or restrictions on its growth, activities or
operations. If within two years from the imposition of any
such requirements or restrictions Citi has still not remediated
any identified deficiencies, then Citi could eventually be
required to divest certain assets or operations. Any such
restrictions or actions would negatively impact Citi’s
reputation, market and investor perception, operations and
strategy.
Citi’s Performance and the Performance of Its Individual
Businesses Could Be Negatively Impacted if Citi Is Not Able
to Effectively Compete for, Retain and Motivate Highly
Qualified Colleagues.
Citi’s performance and the performance of its individual
businesses largely depend on the talents and efforts of its
diverse and highly qualified colleagues. Specifically, Citi’s
continued ability to compete in each of its lines of business, to
manage its businesses effectively and to execute its global
strategy depends on its ability to attract new colleagues and to
retain and motivate its existing colleagues. If Citi is unable to
continue to attract, retain and motivate the most highly
qualified colleagues, Citi’s performance, including its
competitive position, the execution of its strategy and its
results of operations could be negatively impacted.
Citi’s ability to attract, retain and motivate colleagues
depends on numerous factors, some of which are outside of its
control. For example, the banking industry generally is subject
to more comprehensive regulation of employee compensation
than other industries, including deferral and clawback
requirements for incentive compensation. Citi often competes
for talent with entities that are not subject to similar regulatory
requirements, including, among others, technology companies.
Other factors that could impact Citi’s ability to attract, retain
and motivate colleagues include its reputation, culture and the
management and leadership of the Company and each of its
lines of business, presence in a particular market or region and
the professional opportunities it offers. For information on
Citi’s colleagues and workforce management, see “Human
Capital Resources and Management” below.
Financial Services Companies and Others as well as
Emerging Technologies Pose Increasingly Competitive
Challenges to Citi.
Citi operates in an increasingly competitive environment,
which includes both financial and non-financial services firms,
such as traditional banks, online banks, financial technology
companies and others. These companies compete on the basis
of, among other factors, size, reach, quality and type of
products and services offered, price, technology and
reputation. Emerging technologies have the potential to
intensify competition and accelerate disruption in the financial
services industry.
Citi competes with financial services companies in the
U.S. and globally that continue to develop and introduce new
products and services. In recent years, non-financial services
firms, such as financial technology companies, have begun to
offer services traditionally provided by financial institutions,
such as Citi, and have sought bank charters to provide these
services. These firms attempt to use technology and mobile
platforms to enhance the ability of companies and individuals
to borrow, save and invest money. In addition, as discussed
above, it is unclear how the macroeconomic business
environment or societal norms may be impacted as a result of
the pandemic. Citi may experience increased or different
competitive and other challenges in a post-pandemic
environment.
To the extent that Citi is not able to compete effectively
with financial technology companies and other firms, Citi
could be placed at a competitive disadvantage, which could
result in loss of customers and market share, and its
businesses, results of operations and financial condition could
suffer. For additional information on Citi’s competitors, see
the co-brand and private label cards risk factor above and
“Supervision, Regulation and Other—Competition” below.
Climate Change Could Have a Negative Impact on Citi’s
Results of Operations and Financial Condition.
Citi operates globally, including in countries, states and
regions where its businesses, and the activities of its consumer
customers and corporate clients, could be negatively impacted
by climate change. Climate change presents both immediate
and long-term risks to Citi and its customers and clients, with
the risks expected to increase over time.
Climate risks can arise from physical risks (acute or
chronic risks related to the physical effects of climate change)
and transition risks (risks related to regulatory and legal,
54
technological, market and reputational changes from a
transition to a low-carbon economy). Physical risks could
damage or destroy Citi’s or its customers’ and clients’
properties and other assets and disrupt their operations. For
example, climate change may lead to more extreme weather
events occurring more often which may result in physical
damage and additional volatility within our trading and other
businesses and potential counterparty exposures and other
financial risks. Transition risks may result in changes in
regulations or market preferences, which in turn could have
negative impacts on asset values, results of operation or the
reputation of Citi and its customers and clients. For example,
Citi’s corporate credit portfolios include carbon-intensive
industries like oil and gas and power that are exposed to
climate risks, such as those risks related to the transition to a
low-carbon economy, as well as low-carbon industries that
may be subject to risks associated with new technologies. U.S.
and non-U.S. banking regulators and others have increasingly
viewed financial institutions as important in helping to address
the risks related to climate change both directly and with
respect to their customers. Ongoing legislative or regulatory
uncertainties and changes regarding climate risk management
and practices may result in higher regulatory, compliance,
credit and reputational risks and costs.
For information on Citi’s management of climate risk, see
“Managing Global Risk—Strategic Risk—Climate Risk”
below.
MARKET AND OTHER RISKS
Macroeconomic, Geopolitical and Other Challenges and
Uncertainties Globally Could Have a Negative Impact on
Citi’s Businesses and Results of Operations.
In addition to the significant macroeconomic challenges posed
by the pandemic (see the pandemic-related risk factor above),
Citi has experienced, and could experience in the future,
negative impacts to its businesses and results of operations as
a result of other macroeconomic, geopolitical and other
challenges, uncertainties and volatility. For example,
governmental fiscal and monetary actions, or expected actions,
such as changes in interest rate policies and any program
implemented by a central bank to change the size of its
balance sheet, could significantly impact interest rates,
economic growth rates, the volatility of global financial
markets, foreign exchange rates and global capital flows.
Additional areas of uncertainty include, among others,
geopolitical tensions and conflicts, protracted or widespread
trade tensions, natural disasters, other pandemics and election
outcomes. Moreover, adverse developments or downturns in
one or more of the world’s larger economies would likely have
a significant impact on the global economy or the economies
of other countries because of global financial and economic
linkages.
In 2020, due to the pandemic, the FRB and other central
banks took numerous actions to support the global economy,
including by further reducing their benchmark interest rates
and in certain instances providing additional liquidity to the
financial system. Interest rates on loans Citi makes to
customers and clients are typically based off or set at a spread
over a benchmark interest rate, including the U.S. benchmark
interest rate, and are therefore likely to decline as benchmark
rates decline. By contrast, the interest rates at which Citi pays
depositors are already low and unlikely to decline much
further. Consequently, declining or continued low interest
rates for loans and largely unchanged deposit rates would
likely further compress Citi’s net interest revenue. Citi’s net
interest revenue could also be adversely affected due to a
flattening of the interest rate yield curve (e.g., a lower spread
between shorter-term versus longer-term interest rates), as
Citi, similar to other banks, typically pays interest on deposits
based on shorter-term interest rates and earns money on loans
based on longer-term interest rates. For additional information
on Citi’s interest rate risk, see “Managing Global Risk—
Market Risk—Net Interest Revenue at Risk” below.
These and additional global macroeconomic, geopolitical
and other challenges, uncertainties and volatilities have
negatively impacted, and could continue to negatively impact,
Citi’s businesses, results of operations and financial condition,
including its credit costs, revenues across ICG and GCB and
AOCI (which would in turn negatively impact Citi’s book and
tangible book value).
OPERATIONAL RISKS
A Failure in or Disruption of Citi’s Operational Processes or
Systems Could Negatively Impact Citi’s Reputation,
Customers, Clients, Businesses or Results of Operations and
Financial Condition.
Citi’s global operations rely heavily on the accurate, timely
and secure processing, management, storage and transmission
of confidential transactions, data and other information as well
as the monitoring of a substantial amount of data and complex
transactions in real time. For example, Citi obtains and stores
an extensive amount of personal and client-specific
information for its consumer and institutional customers and
clients, and must accurately record and reflect their extensive
account transactions. Citi’s operations must also comply with
complex and evolving laws and regulations in the countries in
which it operates.
With the evolving proliferation of new technologies and
the increasing use of the internet, mobile devices and cloud
technologies to conduct financial transactions, large global
financial institutions such as Citi have been, and will continue
to be, subject to an ever-increasing risk of operational loss,
failure or disruption, including as a result of cyber or
information security incidents. These risks have been
exacerbated during the pandemic, when a substantial portion
of Citi’s colleagues have worked remotely and customers and
clients have increased their use of online banking and other
platforms (for additional information, see the cybersecurity
risk factor below and pandemic-related risk factor above).
Although Citi has continued to upgrade its operational
systems to automate processes and enhance efficiencies,
operational incidents are unpredictable and can arise from
numerous sources, not all of which are within Citi’s control,
including, among others, human error, such as processing
errors, fraud or malice on the part of employees or third
parties, accidental system or technological failure, electrical or
telecommunication outages, failures of or cyber incidents
involving computer servers or infrastructure or other similar
losses or damage to Citi’s property or assets. Irrespective of
the sophistication of the technology utilized by Citi, there will
55
always be some room for human error. In view of the large
transactions in which Citi engages, such errors could result in
significant loss. Operational incidents can also arise as a result
of failures by third parties with which Citi does business, such
as failures by internet, mobile technology and cloud service
providers or other vendors to adequately follow procedures or
processes, safeguard their systems or prevent system
disruptions or cyber attacks.
Incidents that impact information security and/or
technology operations may cause disruptions and/or
malfunctions within Citi’s businesses (e.g., the temporary loss
of availability of Citi’s online banking system or mobile
banking platform), as well as the operations of its clients,
customers or other third parties. In addition, operational
incidents could involve the failure or ineffectiveness of
internal processes or controls. Given Citi’s global footprint
and the high volume of transactions processed by Citi, certain
failures, errors or actions may be repeated or compounded
before they are discovered and rectified, which would further
increase the consequences and costs. Operational incidents
could result in financial losses as well as misappropriation,
corruption or loss of confidential and other information or
assets, which could significantly negatively impact Citi’s
reputation, customers, clients, businesses or results of
operations and financial condition. Cyber-related and other
operational incidents can also result in legal and regulatory
proceedings, fines and other costs (see the legal and regulatory
proceedings risk factor below).
For information on Citi’s management of operational risk,
see “Managing Global Risk—Operational Risk” below.
Citi’s and Third Parties’ Computer Systems and Networks
Have Been, and Will Continue to Be, Susceptible to an
Increasing Risk of Continually Evolving, Sophisticated
Cybersecurity Activities That Could Result in the Theft, Loss,
Misuse or Disclosure of Confidential Client or Customer
Information, Damage to Citi’s Reputation, Additional Costs
to Citi, Regulatory Penalties, Legal Exposure and Financial
Losses.
Citi’s computer systems, software and networks are subject to
ongoing cyber incidents such as unauthorized access, loss or
destruction of data (including confidential client information),
account takeovers, unavailability of service, computer viruses
or other malicious code, cyber attacks and other similar
events. These threats can arise from external parties, including
cyber criminals, cyber terrorists, hacktivists and nation state
actors, as well as insiders who knowingly or unknowingly
engage in or enable malicious cyber activities.
Third parties with which Citi does business, as well as
retailers and other third parties with which Citi’s customers do
business, may also be sources of cybersecurity risks,
particularly where activities of customers are beyond Citi’s
security and control systems. For example, Citi outsources
certain functions, such as processing customer credit card
transactions, uploading content on customer-facing websites
and developing software for new products and services. These
relationships allow for the storage and processing of customer
information by third-party hosting of or access to Citi
websites, which could lead to compromise or the potential to
introduce vulnerable or malicious code, resulting in security
breaches impacting Citi customers. Furthermore, because
financial institutions are becoming increasingly interconnected
with central agents, exchanges and clearing houses, including
as a result of derivatives reforms over the last few years, Citi
has increased exposure to cyber attacks through third parties.
While many of Citi’s agreements with third parties include
indemnification provisions, Citi may not be able to recover
sufficiently, or at all, under the provisions to adequately offset
any losses Citi may incur from third-party cyber incidents.
Citi has been subject to attempted and sometimes
successful cyber attacks from external sources over the last
several years, including (i) denial of service attacks, which
attempt to interrupt service to clients and customers, (ii)
hacking and malicious software installations, intended to gain
unauthorized access to information systems or to disrupt those
systems, (iii) data breaches due to unauthorized access to
customer account data and (iv) malicious software attacks on
client systems, in an attempt to gain unauthorized access to
Citi systems or client data under the guise of normal client
transactions. While Citi’s monitoring and protection services
were able to detect and respond to the incidents targeting its
systems before they became significant, they still resulted in
limited losses in some instances as well as increases in
expenditures to monitor against the threat of similar future
cyber incidents. There can be no assurance that such cyber
incidents will not occur again, and they could occur more
frequently and on a more significant scale.
Further, although Citi devotes significant resources to
implement, maintain, monitor and regularly upgrade its
systems and networks with measures such as intrusion
detection and prevention and firewalls to safeguard critical
business applications, there is no guarantee that these
measures or any other measures can provide absolute security.
Because the methods used to cause cyber attacks change
frequently or, in some cases, are not recognized until launched
or even later, Citi may be unable to implement effective
preventive measures or proactively address these methods
until they are discovered. In addition, given the evolving
nature of cyber threat actors and the frequency and
sophistication of the cyber activities they carry out, the
determination of the severity and potential impact of a cyber
incident may not become apparent for a substantial period of
time following discovery of the incident. Also, while Citi
engages in certain actions to reduce the exposure resulting
from outsourcing, such as performing security control
assessments of third-party vendors and limiting third-party
access to the least privileged level necessary to perform job
functions, these actions cannot prevent all third-party-related
cyber attacks or data breaches.
Cyber incidents can result in the disclosure of personal,
confidential or proprietary customer or client information,
damage to Citi’s reputation with its clients and the market,
customer dissatisfaction and additional costs to Citi, including
expenses such as repairing systems, replacing customer
payment cards, credit monitoring or adding new personnel or
protection technologies. Regulatory penalties, loss of
revenues, exposure to litigation and other financial losses,
including loss of funds, to both Citi and its clients and
customers and disruption to Citi’s operational systems could
also result from cyber incidents (for additional information on
56
the potential impact of operational disruptions, see the
operational processes and systems risk factor above).
Moreover, the increasing risk of cyber incidents has resulted in
increased legislative and regulatory scrutiny of firms’
cybersecurity protection services and calls for additional laws
and regulations to further enhance protection of consumers’
personal data.
While Citi maintains insurance coverage that may, subject
to policy terms and conditions including significant self-
insured deductibles, cover certain aspects of cyber risks, such
insurance coverage may be insufficient to cover all losses and
may not take into account reputational harm, the cost of which
could be immeasurable.
For additional information about Citi’s management of
cybersecurity risk, see “Managing Global Risk—Operational
Risk—Cybersecurity Risk” below.
Changes to or the Application of Incorrect Assumptions,
Judgments or Estimates in Citi’s Financial Statements
Could Cause Significant Unexpected Losses or Impacts in
the Future.
U.S. GAAP requires Citi to use certain assumptions,
judgments and estimates in preparing its financial statements,
including, among other items, the estimate of the ACL;
reserves related to litigation, regulatory and tax matters
exposures; valuation of DTAs; and the fair values of certain
assets and liabilities, such as goodwill or any other asset for
impairment. If Citi’s assumptions, judgments or estimates
underlying its financial statements are incorrect or differ from
actual or subsequent events, Citi could experience unexpected
losses or other adverse impacts, some of which could be
significant.
For example, the CECL methodology, adopted as of
January 1, 2020, requires that Citi provide reserves for a
current estimate of lifetime expected credit losses for its loan
portfolios and other financial assets, as applicable, at the time
those assets are originated or acquired. This estimate is
adjusted each period for changes in expected lifetime credit
losses. Citi’s ACL estimate depends upon its CECL models
and assumptions, forecasted macroeconomic conditions,
including, among other things, the U.S. unemployment rate
and the U.S. Real GDP, and the credit indicators, composition
and other characteristics of Citi’s loan and other applicable
portfolios. These model assumptions and forecasted
macroeconomic conditions will change over time, whether due
to the pandemic or otherwise, resulting in greater variability in
Citi’s ACL compared to its provision for loan losses under the
previous GAAP methodology, and, thus, impact its results of
operations, as well as regulatory capital, including as the
CECL phase-in begins as of January 1, 2022.
Moreover, Citi has incurred losses related to its foreign
operations that are reported in the foreign currency translation
adjustment (CTA) components of Accumulated other
comprehensive income (loss) (AOCI). In accordance with U.S.
GAAP, a sale or substantial liquidation of any foreign
operations, such as those related to Citi’s legacy businesses,
would result in reclassification of any foreign CTA component
of AOCI related to that foreign operation, including related
hedges and taxes, into Citi’s earnings. For additional
information on Citi’s accounting policy for foreign currency
translation and its foreign CTA components of AOCI, see
Notes 1 and 19 to the Consolidated Financial Statements.
For additional information on the key areas for which
assumptions and estimates are used in preparing Citi’s
financial statements, including those related to Citi’s ACL, see
“Significant Accounting Policies and Significant Estimates”
below and Notes 1 and 27 to the Consolidated Financial
Statements.
Changes to Financial Accounting and Reporting Standards
or Interpretations Could Have a Material Impact on How
Citi Records and Reports Its Financial Condition and
Results of Operations.
Periodically, the Financial Accounting Standards Board
(FASB) issues financial accounting and reporting standards
that govern key aspects of Citi’s financial statements or
interpretations thereof when those standards become effective,
including those areas where Citi is required to make
assumptions or estimates. Changes to financial accounting or
reporting standards or interpretations, whether promulgated or
required by the FASB or other regulators, could present
operational challenges and could also require Citi to change
certain of the assumptions or estimates it previously used in
preparing its financial statements, which could negatively
impact how it records and reports its financial condition and
results of operations generally and/or with respect to particular
businesses. For additional information on Citi’s accounting
policies, including the expected impacts on Citi’s results of
operations and financial condition, see Note 1 to the
Consolidated Financial Statements.
If Citi’s Risk Management Processes, Strategies or Models
Are Deficient or Ineffective, Citi May Incur Significant
Losses and Its Regulatory Capital and Capital Ratios Could
Be Negatively Impacted.
Citi utilizes a broad and diversified set of risk management
and mitigation processes and strategies, including the use of
risk models in analyzing and monitoring the various risks Citi
assumes in conducting its activities. For example, Citi uses
models as part of its comprehensive stress testing initiatives
across the Company. Citi also relies on data to aggregate,
assess and manage various risk exposures. Management of
these risks is made even more challenging within a global
financial institution such as Citi, particularly given the
complex, diverse and rapidly changing financial markets and
conditions in which Citi operates as well as that losses can
occur from untimely, inaccurate or incomplete processes
caused by unintentional human error.
In addition, in October 2020, Citigroup and Citibank
entered into consent orders with the FRB and OCC that
require Citigroup and Citibank to submit acceptable plans
relating principally to making improvements in various
aspects of enterprise-wide risk management, compliance, data
quality management and governance and internal controls (see
“Citi’s Consent Order Compliance” above and the legal and
regulatory proceedings risk factor below).
Citi’s risk management processes, strategies and models
are inherently limited because they involve techniques,
including the use of historical data in many circumstances,
assumptions and judgments that cannot anticipate every
57
economic and financial outcome in the markets in which Citi
operates, nor can they anticipate the specifics and timing of
such outcomes. Citi could incur significant losses, and its
regulatory capital and capital ratios could be negatively
impacted, if Citi’s risk management processes, including its
ability to manage and aggregate data in a timely and accurate
manner, strategies or models are deficient or ineffective. Such
deficiencies or ineffectiveness could also result in inaccurate
financial, regulatory or risk reporting.
Moreover, Citi’s Basel III regulatory capital models,
including its credit, market and operational risk models,
currently remain subject to ongoing regulatory review and
approval, which may result in refinements, modifications or
enhancements (required or otherwise) to these models.
Modifications or requirements resulting from these ongoing
reviews, as well as any future changes or guidance provided
by the U.S. banking agencies regarding the regulatory capital
framework applicable to Citi, have resulted in, and could
continue to result in, significant changes to Citi’s risk-
weighted assets. These changes can negatively impact Citi’s
capital ratios and its ability to achieve its regulatory capital
requirements.
CREDIT RISKS
Credit Risk and Concentrations of Risk Can Increase the
Potential for Citi to Incur Significant Losses.
Credit risk primarily arises from Citi’s lending and other
businesses in both GCB and ICG. Citi has credit exposures to
consumer, corporate and public sector borrowers and other
counterparties in the U.S. and various countries and
jurisdictions globally, including end-of-period consumer loans
of $289 billion and end-of-period corporate loans of $387
billion at year-end 2020.
A default by a borrower or other counterparty, or a
decline in the credit quality or value of any underlying
collateral, exposes Citi to credit risk. Despite Citi’s target
client strategy, various pandemic-related, macroeconomic,
geopolitical and other factors, among other things, can
increase Citi’s credit risk and credit costs (for additional
information, see the pandemic-related, co-branding and private
label credit card, macroeconomic challenges and uncertainties
and emerging markets risk factors above).
While Citi provides reserves for expected losses for its
credit exposures, as applicable, such reserves are subject to
judgments and estimates that could be incorrect or differ from
actual future events. Under the CECL accounting standard, the
ACL reflects expected losses, rather than incurred losses,
which has resulted in and could lead to additional volatility in
the allowance and the provision for credit losses as forecasts
of economic conditions change. In addition, Citi’s future
allowance may be affected by seasonality of its cards
portfolios based on historical evidence showing that (i) credit
card balances typically decrease during the first and second
quarters, as borrowers use tax refunds to pay down balances;
and (ii) balances increase during the third and fourth quarters
each year as payments are no longer impacted by tax refunds
and the holiday season approaches. However these seasonal
trends could be affected in 2021 due to the impacts of
the pandemic, government stimulus and expiration of
consumer and small business relief programs. For additional
information, see the incorrect assumptions or estimates and
changes to financial accounting and reporting standards risk
factors above. For additional information on Citi’s ACL, see
“Significant Accounting Policies and Significant Estimates”
below and Notes 1 and 15 to the Consolidated Financial
Statements. For additional information on Citi’s credit and
country risk, see each respective business’s results of
operations above and “Managing Global Risk—Credit Risk”
and “Managing Global Risk—Strategic Risk—Country Risk”
below and Notes 14 and 15 to the Consolidated Financial
Statements.
Concentrations of risk, particularly credit and market
risks, can also increase Citi’s risk of significant losses. As of
year-end 2020, Citi’s most significant concentration of credit
risk was with the U.S. government and its agencies, which
primarily results from trading assets and investments issued by
the U.S. government and its agencies (for additional
information, including concentrations of credit risk to other
public sector entities, see Note 23 to the Consolidated
Financial Statements). In addition, Citi routinely executes a
high volume of securities, trading, derivative and foreign
exchange transactions with non-U.S. sovereigns and with
counterparties in the financial services industry, including
banks, insurance companies, investment banks, governments,
central banks and other financial institutions. Moreover, Citi
has indemnification obligations in connection with various
transactions that expose it to concentrations of risk, including
credit risk from hedging or reinsurance arrangements related
to those obligations (for additional information about these
exposures, see Note 26 to the Consolidated Financial
Statements). A rapid deterioration of a large borrower or other
counterparty or within a sector or country where Citi has large
exposures or guarantees or unexpected market dislocations
could cause Citi to incur significant losses.
LIQUIDITY RISKS
The Maintenance of Adequate Liquidity and Funding
Depends on Numerous Factors, Including Those Outside of
Citi’s Control, Such as Market Disruptions and Increases in
Citi’s Credit Spreads.
As a large, global financial institution, adequate liquidity and
sources of funding are essential to Citi’s businesses. Citi’s
liquidity and sources of funding can be significantly and
negatively impacted by factors it cannot control, such as
general disruptions in the financial markets, governmental
fiscal and monetary policies, regulatory changes or negative
investor perceptions of Citi’s creditworthiness, unexpected
increases in cash or collateral requirements and the inability to
monetize available liquidity resources, whether due to the
pandemic or otherwise. Citi competes with other banks and
financial institutions for deposits, which represent Citi’s most
stable and lowest cost source of long-term funding. The
competition for retail banking deposits has increased in recent
years as a result of online banks and digital banking, among
others. Furthermore, although Citi’s has had robust deposit
growth since the onset of the pandemic, it remains unclear
how “sticky” (likely to remain at Citi) those deposits may be,
particularly in a less accommodating environment.
58
Moreover, Citi’s costs to obtain and access secured
funding and long-term unsecured funding are directly related
to its credit spreads. Changes in credit spreads are driven by
both external market factors and factors specific to Citi, and
can be highly volatile. For additional information on Citi’s
primary sources of funding, see “Managing Global Risk—
Liquidity Risk” below.
Citi’s ability to obtain funding may be impaired if other
market participants are seeking to access the markets at the
same time, or if market appetite declines, as is likely to occur
in a liquidity stress event or other market crisis. A sudden drop
in market liquidity could also cause a temporary or lengthier
dislocation of underwriting and capital markets activity. In
addition, clearing organizations, central banks, clients and
financial institutions with which Citi interacts may exercise
the right to require additional collateral based on their
perceptions or the market conditions, which could further
impair Citi’s access to and cost of funding.
Additionally, as a holding company, Citi relies on interest,
dividends, distributions and other payments from its
subsidiaries to fund dividends as well as to satisfy its debt and
other obligations. Several of Citi’s U.S. and non-U.S.
subsidiaries are or may be subject to capital adequacy or other
regulatory or contractual restrictions on their ability to provide
such payments, including any local regulatory stress test
requirements. Limitations on the payments that Citi receives
from its subsidiaries could also impact its liquidity.
The Credit Rating Agencies Continuously Review the Credit
Ratings of Citi and Certain of Its Subsidiaries, and a Ratings
Downgrade Could Have a Negative Impact on Citi’s
Funding and Liquidity Due to Reduced Funding Capacity
and Increased Funding Costs, Including Derivatives
Triggers That Could Require Cash Obligations or Collateral
Requirements.
The credit rating agencies, such as Fitch, Moody’s and S&P,
continuously evaluate Citi and certain of its subsidiaries. Their
ratings of Citi and its more significant subsidiaries’ long-term/
senior debt and short-term/commercial paper are based on a
number of factors, including standalone financial strength, as
well as factors that are not entirely within the control of Citi
and its subsidiaries, such as the agencies’ proprietary rating
methodologies and assumptions, and conditions affecting the
financial services industry and markets generally.
Citi and its subsidiaries may not be able to maintain their
current respective ratings. A ratings downgrade could
negatively impact Citi’s ability to access the capital markets
and other sources of funds as well as the costs of those funds,
and its ability to maintain certain deposits. A ratings
downgrade could also have a negative impact on Citi’s
funding and liquidity due to reduced funding capacity and the
impact from derivative triggers, which could require Citi to
meet cash obligations and collateral requirements. In addition,
a ratings downgrade could have a negative impact on other
funding sources such as secured financing and other margined
transactions for which there may be no explicit triggers, and
on contractual provisions and other credit requirements of
Citi’s counterparties and clients that may contain minimum
ratings thresholds in order for Citi to hold third-party funds.
Some entities could have ratings limitations on their
permissible counterparties, of which Citi may or may not be
aware.
Furthermore, a credit ratings downgrade could have
impacts that may not be currently known to Citi or are not
possible to quantify. Certain of Citi’s corporate customers and
trading counterparties, among other clients, could re-evaluate
their business relationships with Citi and limit the trading of
certain contracts or market instruments with Citi in response to
ratings downgrades. Changes in customer and counterparty
behavior could impact not only Citi’s funding and liquidity but
also the results of operations of certain Citi businesses. For
additional information on the potential impact of a reduction
in Citi’s or Citibank’s credit ratings, see “Managing Global
Risk—Liquidity Risk” below.
COMPLIANCE RISKS
Ongoing Interpretation and Implementation of Regulatory
and Legislative Requirements and Changes in the U.S. and
Globally Have Increased Citi’s Compliance, Regulatory and
Other Risks and Costs.
Citi is continually required to interpret and implement
extensive and frequently changing regulatory and legislative
requirements in the U.S. and other jurisdictions where it does
business, resulting in substantial compliance, regulatory and
other risks and costs. In addition, there are heightened
regulatory scrutiny and expectations in the U.S. and globally
for large financial institutions, as well as their employees and
agents, with respect to, among other things, governance,
infrastructure, data and risk management practices and
controls. A failure to comply with these requirements and
expectations or resolve any identified deficiencies could result
in increased regulatory oversight and restrictions, enforcement
proceedings, penalties and fines (for additional information,
see the legal and regulatory proceedings risk factor below).
Over the past several years, Citi has been required to
implement a significant number of regulatory and legislative
changes across all of its businesses and functions, and these
changes continue. The changes themselves may be complex
and subject to interpretation, and will require continued
investments in Citi’s global operations and technology
solutions. In some cases, Citi’s implementation of a regulatory
or legislative requirement is occurring simultaneously with
changing or conflicting regulatory guidance, legal challenges
or legislative action to modify or repeal existing rules or enact
new rules. Moreover, in some cases, there have been entirely
new regulatory or legislative requirements or regimes,
resulting in large volumes of regulation and potential
uncertainty regarding regulatory expectations as to what is
required in order to be in compliance.
Examples of regulatory or legislative changes that have
resulted in increased compliance risks and costs include (i) a
proliferation of laws relating to the limitation of cross-border
data movement and/or collection and use of customer
information, including data localization and protection and
privacy laws, which also can conflict with or increase
compliance complexity with respect to other laws, including
anti-money laundering laws; and (ii) the FRB’s “total loss
absorbing capacity” (TLAC) requirements. Additionally, the
banking industry generally is being called upon to do more on
the issues of social, economic and racial justice. This could
59
result in additional regulatory requirements regarding banking
services for underserved communities and individuals.
Increased and ongoing compliance requirements and
uncertainties have resulted in higher compliance costs for Citi,
in part due to an increase in risk, regulatory and compliance
staff over the last several years despite a reduction in the
overall employee population. Extensive and changing
compliance requirements can also result in increased
reputational and legal risks for Citi, as failure to comply with
regulations and requirements, or failure to comply with
regulatory expectations, can result in enforcement and/or
regulatory proceedings, penalties and fines.
Citi Is Subject to Extensive Legal and Regulatory
Proceedings, Examinations, Investigations, Consent Orders
and Related Compliance Efforts and Other Inquiries That
Could Result in Significant Monetary Penalties, Supervisory
or Enforcement Orders, Business Restrictions, Limitations
on Dividends, Changes to Directors and/or Officers and
Collateral Consequences Arising from Such Outcomes.
At any given time, Citi is a party to a significant number of
legal and regulatory proceedings and is subject to numerous
governmental and regulatory examinations, investigations,
consent orders and related compliance efforts, and other
inquiries. Citi can also be subject to enforcement proceedings
not only because of violations of laws and regulations, but also
due to failures, as determined by its regulators, to have
adequate policies and procedures, or to remedy deficiencies on
a timely basis.
The recent FRB and OCC consent orders require
Citigroup and Citibank to submit acceptable plans to the FRB
and OCC, on various timelines, relating principally to making
improvements in various aspects of enterprise-wide risk
management, compliance, data quality management and
governance and internal controls. The consent orders require
preparation of acceptable gap analyses that identify the
required improvements and related root causes, as well as
targeted action plans and quarterly progress reports detailing
the results and status of the improvements. These
improvements will result in significant investments by Citi
during 2021 and afterwards, as an essential part of Citi’s
broader transformation efforts to enhance its infrastructure,
governance, processes and risk and controls. Although there
are no restrictions on Citi’s ability to serve its clients, the
Citibank consent order requires prior approval of any
significant new acquisition, including any portfolio or business
acquisition, excluding ordinary course transactions. Moreover,
the Citibank consent order provides that the OCC has the right
to assess future civil monetary penalties or take other
supervisory and/or enforcement actions, including where the
OCC determines Citibank has not made sufficient and
sustainable progress to address the required improvements.
Such actions by the OCC could include imposing business
restrictions, including possible limitations on the declaration
or payment of dividends and changes in directors and/or senior
executive officers. More generally the OCC and/or the Federal
Reserve could take additional enforcement or other actions if
the regulatory agency believes that Citi has not met regulatory
expectations regarding compliance with the consent orders.
For additional information regarding the consent orders, see
“Citi’s Consent Order Compliance” above.
The global judicial, regulatory and political environment
has generally been challenging for large financial institutions.
The complexity of the federal and state regulatory and
enforcement regimes in the U.S., coupled with the global
scope of Citi’s operations, also means that a single event or
issue may give rise to a large number of overlapping
investigations and regulatory proceedings, either by multiple
federal and state agencies and authorities in the U.S. or by
multiple regulators and other governmental entities in different
jurisdictions, as well as multiple civil litigation claims in
multiple jurisdictions.
U.S. and non-U.S. regulators have been increasingly
focused on “conduct risk,” a term used to describe the risks
associated with behavior by employees and agents, including
third parties, that could harm clients, customers, employees or
the integrity of the markets, such as improperly creating,
selling, marketing or managing products and services or
improper incentive compensation programs with respect
thereto, failures to safeguard a party’s personal information, or
failures to identify and manage conflicts of interest. In
addition to the greater focus on conduct risk, the general
heightened scrutiny and expectations from regulators could
lead to investigations and other inquiries, as well as
remediation requirements, more regulatory or other
enforcement proceedings, civil litigation and higher
compliance and other risks and costs.
Further, while Citi takes numerous steps to prevent and
detect conduct by employees and agents that could potentially
harm clients, customers, employees or the integrity of the
markets, such behavior may not always be deterred or
prevented. Banking regulators have also focused on the overall
culture of financial services firms, including Citi.
In addition to regulatory restrictions or structural changes
that could result from perceived deficiencies in Citi’s culture,
such focus could also lead to additional regulatory
proceedings. Furthermore, the severity of the remedies sought
in legal and regulatory proceedings to which Citi is subject has
remained elevated. U.S. and certain international
governmental entities have increasingly brought criminal
actions against, or have sought criminal convictions from,
financial institutions and individual employees, and criminal
prosecutors in the U.S. have increasingly sought and obtained
criminal guilty pleas or deferred prosecution agreements
against corporate entities and individuals and other criminal
sanctions for those institutions and individuals. These types of
actions by U.S. and international governmental entities may,
in the future, have significant collateral consequences for a
financial institution, including loss of customers and business,
and the inability to offer certain products or services and/or
operate certain businesses. Citi may be required to accept or
be subject to similar types of criminal remedies, consent
orders, sanctions, substantial fines and penalties, remediation
and other financial costs or other requirements in the future,
including for matters or practices not yet known to Citi, any of
which could materially and negatively affect Citi’s businesses,
business practices, financial condition or results of operations,
require material changes in Citi’s operations or cause Citi
reputational harm.
60
Further, many large claims—both private civil and
regulatory—asserted against Citi are highly complex, slow to
develop and may involve novel or untested legal theories. The
outcome of such proceedings is difficult to predict or estimate
until late in the proceedings. Although Citi establishes
accruals for its legal and regulatory matters according to
accounting requirements, Citi’s estimates of, and changes to,
these accruals involve significant judgment and may be
subject to significant uncertainty, and the amount of loss
ultimately incurred in relation to those matters may be
substantially higher than the amounts accrued. In addition,
certain settlements are subject to court approval and may not
be approved.
For additional information relating to Citi’s legal and
regulatory proceedings and matters, including Citi’s policies
on establishing legal accruals, see Note 27 to the Consolidated
Financial Statements.
61

HUMAN CAPITAL RESOURCES AND
MANAGEMENT
Attracting and retaining a highly qualified and motivated
workforce is a strategic priority for Citi. Citi seeks to enhance
the competitive strength of its workforce through the
following efforts:
• Continuous innovation in recruiting, training,
compensation, promotion and engagement of colleagues
• Actively seeking and listening to diverse perspectives at
all levels of the organization
• Optimizing transparency concerning workforce goals, in
order to promote accountability, credibility and
effectiveness in achieving those goals
Workforce Size and Distribution
As of December 31, 2020, Citi employed 210,153 colleagues in nearly 100 countries. The following table shows the geographic
distribution of those colleagues by segment, region and gender:
Business segment
North
America EMEA
Latin
America Asia Total
(1)
Female Male
Global Consumer Banking 32,936 4,087 30,276 31,849 99,148 58 % 42 %
Institutional Clients Group 16,905 16,457 7,166 22,349 62,877 44 56
Corporate/Other 17,130 9,510 7,000 14,488 48,128 42 58
Total 66,971 30,054 44,442 68,686 210,153 51 % 49 %
(1) Part-time colleagues represented less than 1.5% of Citi’s global workforce.
Workforce Management
Citi devotes substantial resources to managing its workforce.
Citigroup’s Board of Directors provides strategic oversight
and direction to management regarding workforce policies and
practices, and includes many members with experience in
overseeing workforce issues. The chair of the Personnel and
Compensation Committee of the Board was formerly the
global head of human resources for PIMCO, a leading global
asset management firm, and later served as its president, with
oversight responsibility for human resources. In addition, the
Personnel and Compensation Committee regularly reviews
management’s achievements against human capital
management goals, such as addressing representation of
women and U.S. minorities in senior roles at Citi, as well as
talent recruitment and development initiatives.
Diversity
Citigroup’s Board is committed to ensuring that it and Citi’s
Executive Management Team are composed of individuals
whose backgrounds reflect the diversity represented by Citi’s
employees, customers and stakeholders.
Additionally, over the past several years, Citi has
increased its efforts to diversify its workforce. In furtherance
of that goal, Citi has focused on measuring and addressing pay
equity within the organization:
• In 2018, Citi was the first major U.S. financial institution
to publicly release the results of a pay equity review
comparing compensation of women to men and U.S.
minorities to U.S. non-minorities. Since then, Citi has
continued to be transparent about pay equity, also
disclosing its unadjusted or “raw” pay gap for both
women and U.S. minorities since 2019.
• Citi’s 2020 results found that, on an adjusted basis,
women globally are paid on average more than 99% of
what men are paid at Citi, and there was no statistically
significant difference in adjusted compensation for U.S.
minorities and non-minorities. Following the review,
appropriate pay adjustments were made as part of Citi’s
2020 compensation cycle.
• Citi’s 2020 raw gap analysis showed that the median pay
for women globally is better than 74% of the median for
men, up from 73% in 2019 and 71% in 2018, and that the
median pay for U.S. minorities is just under 94% of the
median for non-minorities, which is similar to 2019 and
up from 93% in 2018.
• To continue closing the pay gap, Citi has set goals to
increase representation at the assistant vice president
through managing director levels to at least 40% for
women globally and 8% for Black colleagues in the U.S.
by the end of 2021.
Citi also has a goal to:
• expand the use of diverse slates across the firm in 2021 to
include not one, but at least two women or racial/ethnic
minorities in Citi’s interviews for U.S. hires and at least
two women in interviews for global hires; and
62
• increase the analyst and associate programs to 50%
female colleagues globally and 30% Black and Hispanic/
Latino colleagues in the U.S.
In 2020, Citi also:
• expanded the standard for a diverse slate to include at
least one woman globally and one woman and/or U.S.
minority for U.S. hires at the assistant vice president, vice
president and senior vice president levels, in addition to
managing director and director level hires;
• included a diverse slate of candidates, with at least one
woman and/or U.S. minority, for 86% of roles that were
posted globally with a qualified slate;
• increased representation of underrepresented minorities in
its full-time U.S. campus recruitment program from 18%
in 2019 to 26% in 2020;
• increased female representation in its full-time U.S.
campus recruitment program from 45% in 2019 to 46% in
2020; and
• increased female representation in its summer internship
program from 47% in 2019 to 52% in 2020 in the U.S.
and from 48% in 2019 to 50% in 2020 globally, while
Black and Hispanic/Latino representation in its summer
class increased from 26% to 27% over the same
timeframe. This was Citi’s most diverse intern class to
date.
Workforce Development
Citi highly values a workplace environment where its
colleagues can bring their whole selves to work and where
diverse perspectives and ideas are embraced. Citi encourages
career growth and development by offering broad and diverse
opportunities to colleagues. Highlights of these opportunities
include the following:
• Citi provides a range of internal development and
rotational programs to colleagues at all levels, including
various training programs and events to assist high-
performing colleagues in building the skills needed to
transition to manager and supervisory roles.
• Citi has a focus on internal talent development and aims
to provide colleagues with career growth opportunities,
with 33% of open positions filled internally. This
emphasis is particularly important as Citi focuses on
providing career paths for its diverse talent base as part of
its efforts to increase diverse representation at more senior
levels of the organization.
• In order to assist colleagues in a rapidly changing world,
Citi offers an online platform that delivers information on
various topics of interest to colleagues, such as leadership,
data analytics, artificial intelligence and cybersecurity,
among others.
For information about Citi’s reliance on a highly qualified
and motivated workforce, see “Risk Factors” above. For
additional information about Citi’s human capital management
initiatives and goals, see Citi’s 2021 Annual Meeting Proxy
Statement to be filed with the SEC in March 2021 as well as
its 2019 Environmental, Social and Governance Report
available at www.citigroup.com.
For information about Citi’s proactive measures to
preserve the health and safety of its workforce during the
pandemic, see “COVID-19 Pandemic Overview” above.
63
This page intentionally left blank.
64

Managing Global Risk Table of Contents
MANAGING GLOBAL RISK 66
Overview 66
CREDIT RISK
(1)
68
Overview 68
Consumer Credit 69
Corporate Credit 76
Additional Consumer and Corporate Credit Details 82
Loans Outstanding 82
Details of Credit Loss Experience 83
Allowance for Credit Losses on Loans (ACLL) 85
Non-Accrual Loans and Assets and Renegotiated Loans 87
Forgone Interest Revenue on Loans 90
LIQUIDITY RISK 91
Overview 91
Liquidity Monitoring and Measurement 91
High-Quality Liquid Assets (HQLA) 92
Loans 93
Deposits 93
Long-Term Debt 94
Secured Funding Transactions and Short-Term Borrowings 97
Credit Ratings 98
MARKET RISK
(1)
100
Overview 100
Market Risk of Non-Trading Portfolios 100
Net Interest Revenue at Risk 100
Interest Rate Risk of Investment Portfolios—Impact on AOCI 100
Changes in Foreign Exchange Rates—Impacts on AOCI and Capital 102
Interest Revenue/Expense and Net Interest Margin (NIM) 103
Additional Interest Rate Details 106
Market Risk of Trading Portfolios 110
Factor Sensitivities 111
Value at Risk (VAR) 111
Stress Testing 114
OPERATIONAL RISK 115
Overview 115
Erroneous Revlon-Related Payment 115
Cybersecurity Risk 116
COMPLIANCE RISK 116
REPUTATION RISK 117
STRATEGIC RISK 117
Overview 117
U.K.’s Future Relationship with the EU 117
LIBOR Transition Risk 118
Climate Risk 118
Country Risk 120
Top 25 Country Exposures 120
Argentina 121
FFIEC—Cross-Border Claims on Third Parties and Local Country Assets 121
(1) For additional information regarding certain credit risk, market risk and other quantitative and qualitative information, refer to Citi’s Pillar 3 Basel III Advanced
Approaches Disclosures, as required by the rules of the Federal Reserve Board, on Citi’s Investor Relations website.
65
MANAGING GLOBAL RISK
Overview
For Citi, effective risk management is of primary importance
to its overall operations. Accordingly, Citi’s risk management
process has been designed to monitor, evaluate and manage
the principal risks it assumes in conducting its activities.
Specifically, the activities that Citi engages in, and the risks
those activities generate, must be consistent with Citi’s
mission and value proposition, the key principles that guide it
and Citi's risk appetite. As discussed above, Citi is continuing
its efforts to comply with the Federal Reserve Board and OCC
consent orders, relating principally to various aspects of risk
management, compliance, data quality management and
governance, and internal controls, see “Citi’s Consent Order
Compliance” and “Risk Factors—Compliance Risks” above.
Risk management must be built on a foundation of ethical
culture. Under Citi’s mission and value proposition, which
was developed by its senior leadership and distributed
throughout the Company, Citi strives to serve its clients as a
trusted partner by responsibly providing financial services that
enable growth and economic progress while earning and
maintaining the public’s trust by constantly adhering to the
highest ethical standards. As such, Citi asks all colleagues to
ensure that their decisions pass three tests: they are in Citi’s
clients’ interests, create economic value and are always
systemically responsible. In addition, Citi evaluates
colleagues’ performance against behavioral expectations set
out in Citi’s leadership standards, which were designed in part
to effectuate Citi’s mission and value proposition. Other
culture-related efforts in connection with conduct risk, ethics
and leadership, escalation and treating customers fairly help
Citi to execute its mission and value proposition.
Citi’s Company-wide risk governance framework consists
of the risk management practices that include a risk
governance structure and the firm’s key policies, processes,
personnel and control systems through which Citi identifies,
measures, monitors, and controls risks such that the
Company’s risk taking is consistent with its strategy and risk
appetite. It also emphasizes Citi’s risk culture and lays out
standards, procedures and programs that are designed to set,
reinforce and enhance the Company’s risk culture, integrate its
values and conduct expectations into the organization,
providing colleagues with tools to assist them with making
prudent and ethical risk decisions and to escalate issues
appropriately.
Citi selectively takes risks in support of its underlying
customer-centric strategy. Citi’s objective is to ensure that
those risks are consistent with its mission and value
proposition, including its commitment to responsible finance.
Citi’s risk mission is taking intelligent risk with shared
responsibility, without forsaking individual accountability.
Citi’s risk appetite framework sets boundaries for risk
taking and consists of a set of risk appetite statements that
articulate the aggregate level and types of risk that Citi is
willing to accept in order to achieve its strategic objectives and
business plan and includes governance processes through
which the risk appetite is established, communicated and
monitored, and its breaches are escalated and resolved. It is
built on quantitative boundaries, which include goals, risk
limits and thresholds, and on qualitative principles that guide
behavior. Citi’s risk appetite framework is enterprise-wide and
applicable across products, functions and geographies and
comprehensively covers the major categories of risk facing the
firm.
Citi’s risks are generally categorized and summarized as
follows:
• Credit risk is the risk of loss resulting from the decline in
credit quality (or downgrade risk) or failure of a borrower,
counterparty, third party or issuer to honor its financial or
contractual obligations.
• Liquidity risk is the risk that the firm will not be able to
efficiently meet both expected and unexpected current and
future cash flow and collateral needs without adversely
affecting either daily operations or financial conditions of
the firm. This risk may be exacerbated by the inability of
the firm to access funding sources or monetize assets and
the composition of liability funding and liquid assets.
• Market risk (including price risk and interest rate risk) is
the risk of loss arising from changes in the value of Citi’s
assets and liabilities or reduced net interest revenues
resulting from changes in market variables, such as
interest rates, exchange rates, equity and commodity
prices or credit spreads. Losses can be exacerbated by the
negative convexity of positions, as well as the presence of
basis or correlation risks.
• Operational risk is the risk of loss resulting from
inadequate or failed internal processes, people and
systems, or from external events. It includes legal risk,
which is the risk of loss (including litigation costs,
settlements and regulatory fines) resulting from the failure
of the firm to comply with laws, regulations, prudent
ethical standards and contractual obligations in any aspect
of the firm’s business, but excludes strategic and
reputation risks (see below).
• Compliance risk is the risk to current or projected
financial conditions and resilience arising from violations
of laws, rules or regulations, or from non-conformance
with prescribed practices, internal policies and procedures
or ethical standards. It also includes the exposure to
litigation (known as legal risk) from all aspects of
banking, traditional and non-traditional.
• Reputation risk is the risk to current or projected financial
conditions and resilience arising from negative public
opinion. This risk may impair Citi’s competitiveness by
affecting its ability to establish new relationships or
services or continue servicing existing relationships.
• Strategic risk is the risk to current or anticipated earnings,
capital, or franchise or enterprise value arising from poor,
but authorized, business decisions (in compliance with
regulations, policies and procedures), an inability to adapt
to changes in the operating environment, or other external
factors that may impair the ability to carry out a business
strategy. Strategic risk also includes:
◦ Country risk, which is the risk that conditions in a
country (which may be precipitated by developments
within or external to a country) will impair the value
of Citi’s franchise or will adversely affect the ability
of obligors within that country to honor their
66
obligations to Citi. Country risk includes sovereign
defaults, banking crises, currency crises, currency
convertibility and/or transferability restrictions or
political developments.
Citi uses a lines of defense construct to manage its risks.
The construct comprises units that create risks (first line of
defense), those that independently assess risk (second line of
defense), units that provide independent assurance (third line
of defense) and units tasked with maintaining a strong control
environment (control and support functions). The lines of
defense, which include control and support functions,
coordinate with each other in the risk management system in
support of the common goal of identifying, measuring,
monitoring and controlling risk-taking activities so they
remain consistent with the firm’s strategy and risk appetite.
First Line of Defense: Front Line Units and Front Line
Unit Activities
Citi’s first line of defense owns the risks inherent in or arising
from their business and is responsible for identifying,
assessing and controlling those risks so that they are within
Citi’s risk appetite.
Front line units are responsible and held accountable for
managing the risks associated with their activities within the
boundaries set by independent risk management. They are also
responsible for designing and implementing effective internal
controls and maintaining processes for managing their risk
profile, including through risk mitigation, so that it remains
consistent with Citi’s established risk appetite.
Front line unit activities are considered part of the first
line of defense and are subject to the oversight and challenge
of independent risk management, whether they are conducted
by a front line unit or another line of defense designation. Note
that front line units may also conduct control and support
activities which are subject to the relevant firm-wide
independent oversight processes specific to the risk category
that they generate (e.g., operational risk, compliance risk,
reputation risk).
The first line of defense is composed of Citi’s Business
Management (Global Consumer Bank (GCB) and Institutional
Clients Group (ICG)), Regional and Country Management,
certain Corporate Functions (Enterprise Infrastructure,
Operations and Technology (EIO&T) and Finance), as well as
other front line unit activities.
Second Line of Defense: Independent risk management
Independent risk management units are independent of front
line units. They are responsible for overseeing the risk-taking
activities of the first line of defense and challenging the first
line of defense in the execution of their risk management
responsibilities. They are also responsible for independently
identifying, measuring, monitoring and controlling aggregate
risks and for setting standards for the management and
oversight of risk. At Citi, the second line of defense is defined
to include Independent Risk Management and Independent
Compliance Risk Management (ICRM). Independent Risk
Management and ICRM report to Citi’s Chief Risk Officer
and Chief Compliance Officer (CCO), respectively, both of
whom report directly to the Citigroup CEO and have
unrestricted access to the Citigroup Board of Directors or its
committees.
Independent Risk Management
The Independent Risk Management organization sets risk and
control standards for the first line of defense and actively
manages and oversees aggregate credit, market (price and
interest rate), liquidity, strategic, operational, compliance and
reputation risks across the firm, including risks that span
categories, such as concentration risk.
Independent Risk Management is organized to align to
businesses, regions, types of risk and to firm-wide, cross-risk
functions or processes. There are teams that report to an
independent Chief Risk Officer (CRO) for Citi’s businesses
(Business CROs, including Finance Chief Risk Officers) and
regions / legal entities (Regional / Legal Entity CROs). In
addition, there are risk-category-aligned teams that report to a
Risk Category Head (e.g., Market Risk, Operational Risk,
Model Risk) and foundational teams that report to a
Foundational Risk Management Head (e.g., Risk Governance,
Enterprise Concentration Risk Management, Global Risk
Review). All of the above Risk Heads, together with the
Business and Regional / Legal Entity CROs, report to the
Citigroup CRO.
Independent Compliance Risk Management
The Independent Compliance Risk Management organization
is designed to oversee and challenge products, functions,
jurisdictional activities and legal entities in managing
compliance risk, as well as promoting business conduct and
activity that is consistent with Citi’s mission and value
proposition and the compliance risk appetite. Citi’s objective
is to embed an enterprise-wide compliance risk management
framework and culture that identifies, measures, monitors,
controls and escalates compliance risk across the firm.
Product Line, Function and Country ICRM provide
compliance risk management advice and credible challenge on
day-to-day matters and strategic decision-making for key
initiatives. Additionally, Country ICRM provides advisory and
challenge on regulatory and enterprise wide matters such as
regulatory changes in a country. ICRM has program-level
Enterprise Compliance units whose Heads are responsible for
coordinating and managing their respective horizontal,
enterprise-wide compliance programs, setting standards and
establishing priorities for program-related compliance efforts.
Third Line of Defense: Internal Audit
Internal audit is independent of front line units and
independent risk management units. Internal audit provides
independent assurance to the Citigroup Board of Directors on
the effectiveness of governance, risk management and internal
controls. Internal audit reports to a chief audit executive (i.e.,
Citi’s Chief Auditor) who has unrestricted access to the Board
or its audit committee to facilitate the ability to execute
specific responsibilities pertaining to escalation of risks and
issues.
The Internal Audit function has designated Chief Auditors
responsible for assessing the design and effectiveness of
controls within the various business units, functions,
geographies and legal entities in which Citi operates.
67
The Citigroup Chief Auditor manages Internal Audit and
maintains its independence from the front line units,
Independent Risk Management, ICRM and control and
support functions by reporting functionally to the Chairman of
the Citigroup Audit Committee and administratively to the
Citigroup CEO.
Control and Support Functions
Control and support functions do not meet the definition of
front line unit, independent risk management or internal audit.
While they do not report into the CRO or CCO, they are
expected to design, implement and maintain an effective
control environment with respect to the risks they generate,
and also support safety and soundness.
At Citi, the control and support functions are defined to
include the following organizational units: Chief
Administrative Office, Global Public Affairs, Human
Resources, International Franchise Management, Legal
(including Citi Security & Investigative Services) and the
Office of the CBNA CEO.
Board and Executive Management
The Citigroup Board of Directors, both directly or through its
committees, actively oversees Citi’s risk taking activities and
holds management accountable for adhering to the risk
governance framework. The primary responsibility of the
Citigroup Board is to provide effective governance over Citi’s
affairs for the benefit of its stakeholders. Directors have full
and free access to management.
The standing committees of the Citigroup Board are the
Risk Management Committee, Audit Committee, Personnel
and Compensation Committee, Ethics, Conduct and Culture
Committee and Nomination, Governance and Public Affairs
Committee.
The Board delegates authority to the Executive
Management Team, which consists of the Citigroup CEO and
certain direct reports of the CEO, for directing and overseeing
day-to-day management of the firm. The Executive
Management Team is responsible for developing and
implementing policies, procedures and processes that translate
the Board’s goals, strategic objectives and risk appetite and
limits into prudent standards for the safe and sound operation
of the firm.
The Executive Management Team reports to the Board on
the firm’s overall risk profile, including aggregate and
emerging risks, and provides the Board with information about
current and potential risk exposures and their potential impact
on earnings, capital and strategic objectives.
Executive Management committees have been designed
to cover all primary risks to which Citi is exposed. These
Executive Management committees escalate to standing
committees of the Board. The standing Executive
Management committees are the Group Risk Management
Committee, Group Strategic Risk Committee, Citigroup Asset
& Liability Committee, Group Business, Risk and Control
Committee and Group Reputation Risk Committee.
CREDIT RISK
Overview
Credit risk is the risk of loss resulting from the decline in
credit quality of a client, customer or counterparty (or
downgrade risk) or the failure of a borrower, counterparty,
third party or issuer to honor its financial or contractual
obligations. Credit risk arises in many of Citigroup’s business
activities, including:
• consumer, commercial and corporate lending;
• capital markets derivative transactions;
• structured finance; and
• securities financing transactions (repurchase and reverse
repurchase agreements, and securities loaned and
borrowed).
Credit risk also arises from clearing and settlement
activities, when Citi transfers an asset in advance of receiving
its counter-value or advances funds to settle a transaction on
behalf of a client. Concentration risk, within credit risk, is the
risk associated with having credit exposure concentrated
within a specific client, industry, region or other category.
Credit risk is one of the most significant risks Citi faces as
an institution. For additional information, see “Risk Factors—
Credit Risk” above. As a result, Citi has a well-established
framework in place for managing credit risk across all
businesses. This includes a defined risk appetite, credit limits
and credit policies, both at the business level as well as at the
Company-wide level. Citi’s credit risk management also
includes processes and policies with respect to problem
recognition, including “watch lists,” portfolio reviews, stress
tests, updated risk ratings and classification triggers.
With respect to Citi’s clearing and settlement activities,
intraday client usage of clearing lines is monitored against
limits, as well as against usage patterns with settlement
activity monitored daily and intraday for select products. To
the extent that a problem develops, Citi typically moves the
client to a secured (collateralized) operating model. Generally,
Citi’s intraday clearing and settlement lines are uncommitted
and cancelable at any time.
To manage concentration of risk within credit risk, Citi
has in place a framework consisting of industry limits, an
idiosyncratic framework consisting of single name
concentrations for each business and across Citigroup and a
specialized framework consisting of product limits.
Credit exposures are generally reported in notional terms
for accrual loans, reflecting the value at which the loans as
well as other off-balance sheet commitments are carried on the
Consolidated Balance Sheet. Credit exposure arising from
capital markets activities is generally expressed as the current
mark-to-market, net of margin, reflecting the net value owed
to Citi by a given counterparty.
The credit risk associated with these credit exposures is a
function of the idiosyncratic creditworthiness of the obligor, as
well as the terms and conditions of the specific obligation. Citi
assesses the credit risk associated with its credit exposures on
a regular basis through its ACL process (see “Significant
Accounting Policies and Significant Estimates—Allowance
for Credit Losses” below and Notes 1 and 15 to the
68
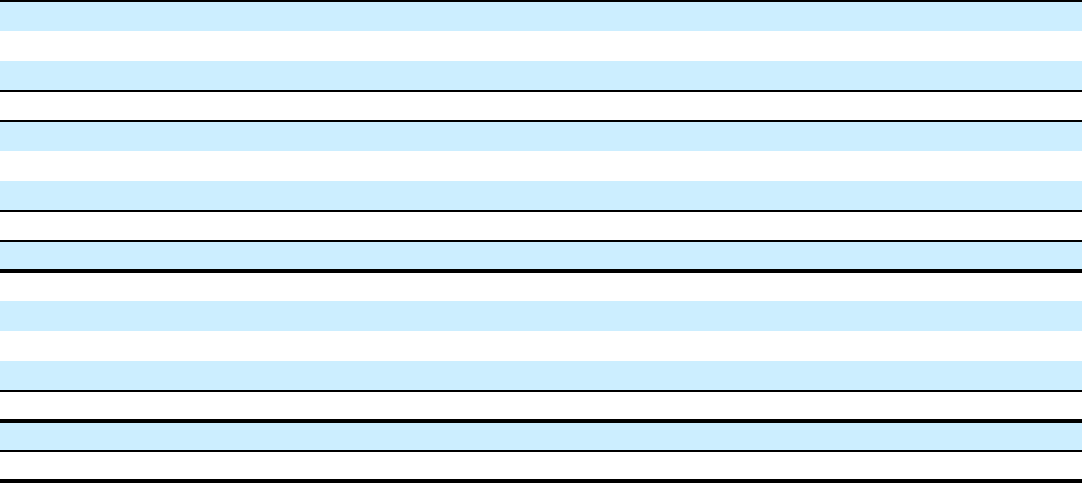
Consolidated Financial Statements), as well as through regular
stress testing at the company, business, geography and product
levels. These stress-testing processes typically estimate
potential incremental credit costs that would occur as a result
of either downgrades in the credit quality or defaults of the
obligors or counterparties.
For additional information on Citi’s credit risk
management, see Note 14 to the Consolidated Financial
Statements.
CONSUMER CREDIT
Citi provides traditional retail banking, including small
business banking, and credit card products in 19 countries and
jurisdictions through North America GCB, Latin America
GCB and Asia GCB. The retail banking products include
consumer mortgages, home equity, personal and small
business loans and lines of credit and similar related products
with a focus on lending to prime customers. Citi uses its risk
appetite framework to define its lending parameters. In
addition, Citi uses proprietary and/or industry scoring models
for new customer approvals.
As stated in “Global Consumer Banking” above, GCB’s
strategy is to leverage its global footprint and digital
capabilities to develop multiproduct relationships with
customers, both in and out of Citi’s branch footprint.
Consumer Credit Portfolio
The following table shows Citi’s quarterly end-of-period consumer loans:
(1)
In billions of dollars
4Q’19 1Q’20 2Q’20 3Q’20 4Q’20
Retail banking:
Mortgages $ 85.5 $ 83.6 $ 86.0 $ 87.5 $ 88.9
Personal, small business and other 39.3 36.6 37.6 38.3 40.1
Total retail banking $ 124.8 $ 120.2 $ 123.6 $ 125.8 $ 129.0
Cards:
Citi-branded cards $ 122.2 $ 110.2 $ 103.6 $ 102.2 $ 106.7
Citi retail services 52.9 48.9 45.4 44.4 46.4
Total cards $ 175.1 $ 159.1 $ 149.0 $ 146.6 $ 153.1
Total GCB $ 299.9 $ 279.3 $ 272.6 $ 272.4 $ 282.1
GCB regional distribution:
North America 66 % 67 % 66 % 66 % 65 %
Latin America 6 5 5 5 5
Asia
(2)
28 28 29 29 30
Total GCB 100 % 100 % 100 % 100 % 100 %
Corporate/Other
(3)
$ 9.6 $ 9.1 $ 8.5 $ 7.6 $ 6.7
Total consumer loans $ 309.5 $ 288.4 $ 281.1 $ 280.0 $ 288.8
(1) End-of-period loans include interest and fees on credit cards.
(2) Asia includes loans and leases in certain EMEA countries for all periods presented.
(3) Primarily consists of legacy assets, principally North America consumer mortgages.
For information on changes to Citi’s consumer loans, see
“Liquidity Risk—Loans” below.
69
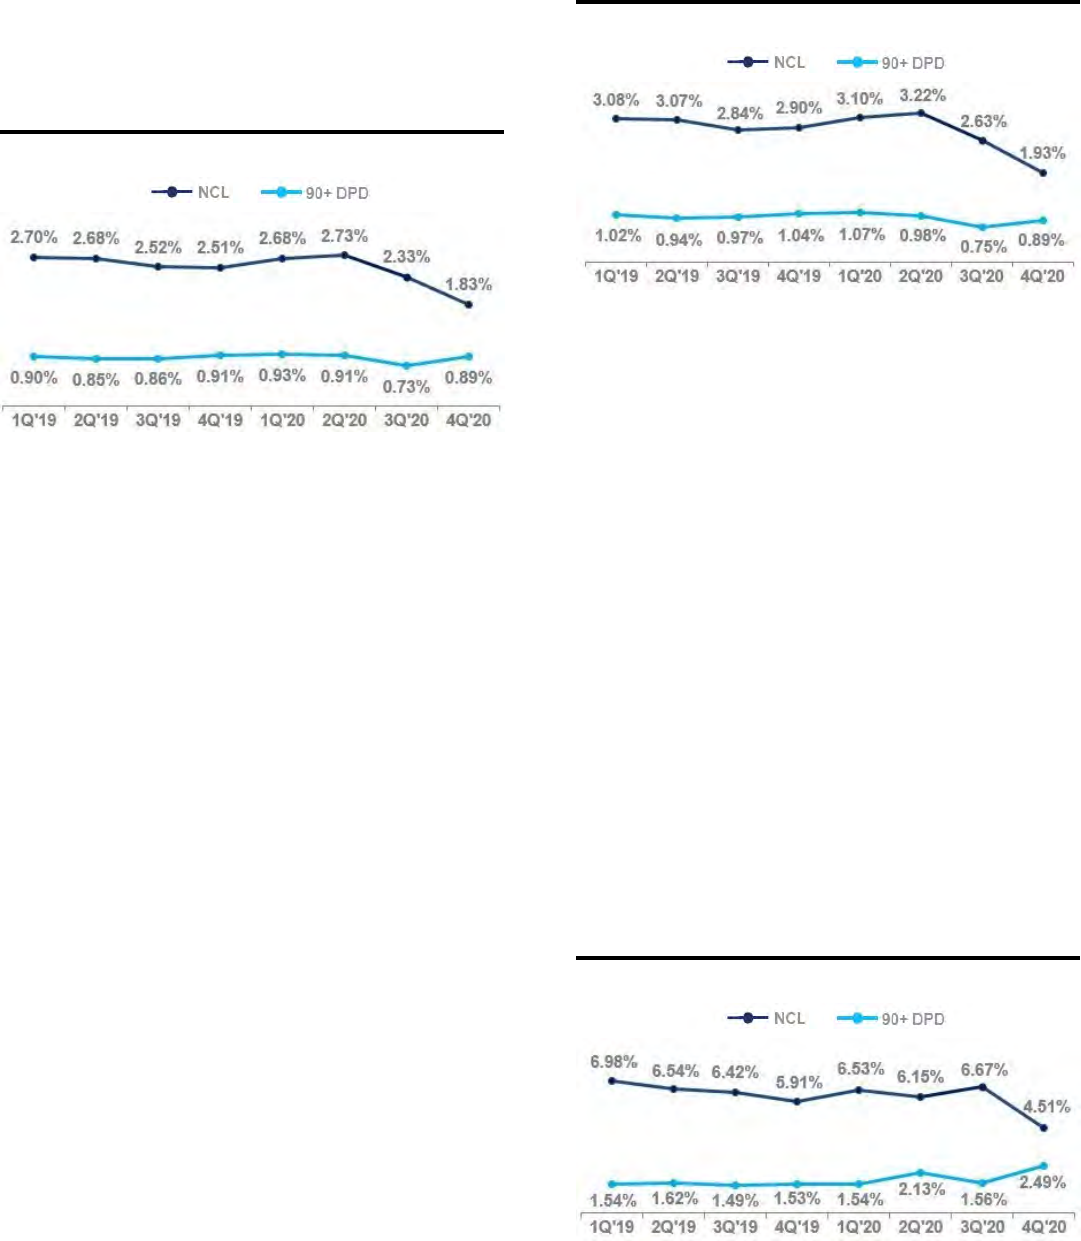
Overall Consumer Credit Trends
The following charts show the quarterly trends in delinquency
rates (90+ days past due (90+ DPD) ratio) and the net credit
loss (NCL) rates across both retail banking and cards for total
GCB and by region.
Global Consumer Banking
As shown in the chart above, GCB’s net credit loss rates
decreased significantly year-over-year and quarter-over-
quarter as of the fourth quarter of 2020, primarily due to the
impacts of the consumer relief programs Citi implemented
since the beginning of the pandemic, combined with the
benefit of reduced customer spending and significant
government stimulus and assistance, as well as other banks’
consumer relief programs.
The 90+ days past due delinquency rate increased quarter-
over-quarter, largely due to the expiration of the pandemic
relief programs in certain countries. The 90+ days past due
delinquency rate was largely unchanged year-over-year.
As discussed above, loans modified under Citi’s
consumer relief programs continue to be reported in the same
delinquency bucket they were in at the time of modification
and, thus, would not be reported as 90+ days past due or
written off for the duration of the programs (which have
various durations, and certain of which may be renewed by the
customer). As a result of the significant and steady decline in
program enrollment, Citi ended its consumer relief programs
as of December 31, 2020 for the majority of countries and
products.
Citi expects to experience higher consumer net credit loss
and 90+ days past due delinquency rates across regions, with
sharper losses in Latin America GCB and Asia GCB starting in
the near term. The losses will likely vary by business and
region and be dependent on evolving macroeconomic and
market conditions. These conditions include the severity and
duration of the impact from the pandemic and the impacts of
government stimulus programs, as well as the timing of
expiration of consumer relief programs and when loans move
into later delinquency buckets. Citi believes that these losses
are adequately reserved for under the CECL standard at
December 31, 2020. For additional information, see
“COVID-19 Pandemic Overview—Pandemic and Other
Impacts” above.
North America GCB
North America GCB provides mortgage, home equity,
small business and personal loans through Citi’s retail banking
network and card products through Citi-branded cards and Citi
retail services businesses. The retail bank is concentrated in
six major metropolitan cities in the U.S. (for additional
information on the U.S. retail bank, see “North America GCB”
above).
As of December 31, 2020, approximately 71% of North
America GCB consumer loans consisted of Citi-branded and
Citi retail services cards, which generally drives the overall
credit performance of North America GCB (for additional
information on North America GCB’s cards portfolios,
including delinquency and net credit loss rates, see “Credit
Card Trends” below).
As shown in the chart above, the net credit loss rate in
North America GCB decreased significantly quarter-over-
quarter and year-over-year as of the fourth quarter of 2020,
driven by the impacts of the consumer relief programs
described above, unemployment benefits and government
stimulus.
The 90+ days past due delinquency rate increased quarter-
over-quarter, primarily due to seasonality in cards and the
impact of customers rolling off the consumer relief programs.
The 90+ days past due delinquency rate modestly
decreased year-over-year, primarily driven by the impacts of
the consumer relief programs described above, unemployment
benefits and government stimulus.
Latin America GCB
Latin America GCB operates in Mexico through
Citibanamex, one of Mexico’s largest banks, and provides
credit cards, consumer mortgages and small business and
personal loans. Latin America GCB serves a more mass-
market segment in Mexico and focuses on developing
multiproduct relationships with customers.
70
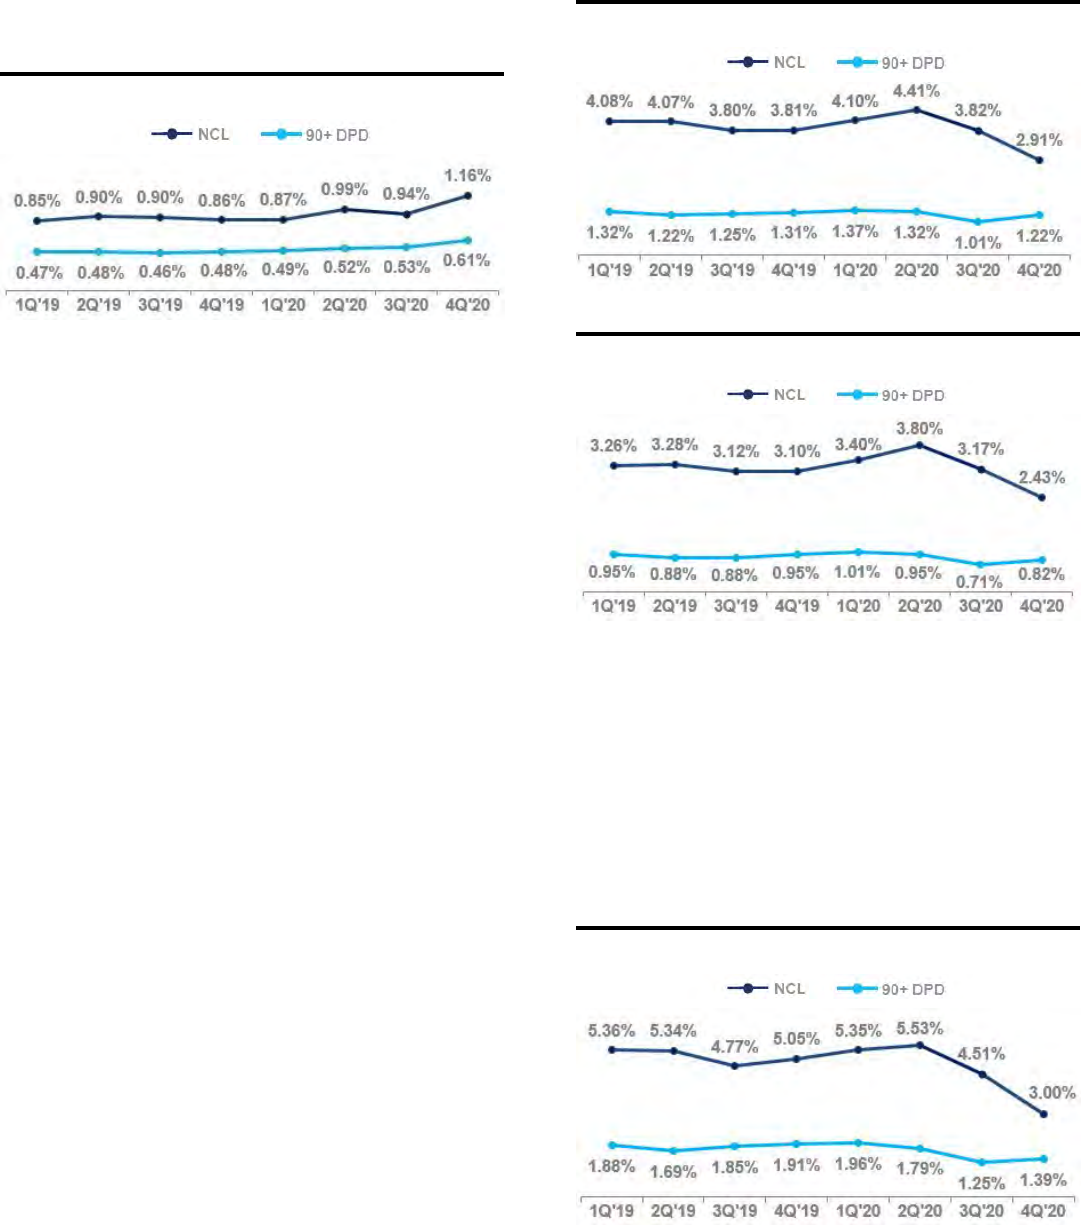
As shown in the chart above, the net credit loss rate in
Latin America GCB decreased significantly quarter-over-
quarter and year-over-year as of the fourth quarter of 2020,
largely driven by the impact of the consumer relief programs
described above. The 90+ days past due delinquency rate
increased significantly quarter-over-quarter and year-over-
year, due to the adverse pandemic-related macroeconomic
impacts, as well as the expiration of most consumer relief
programs in Mexico by September 2020.
Asia
(1)
GCB
(1) Asia includes GCB activities in certain EMEA countries for all periods
presented.
Asia GCB operates in 17 countries and jurisdictions in
Asia and EMEA and provides credit cards, consumer
mortgages and small business and personal loans.
As shown in the chart above, the net credit loss and 90+
days past due delinquency rates in Asia GCB increased
quarter-over-quarter and year-over-year as of the fourth
quarter of 2020, driven by the adverse pandemic-related
macroeconomic impacts in the region as well as the expiration
of consumer relief programs, which generally have ended
earlier than in Mexico and North America.
The performance of Asia GCB’s portfolios, with a 1.16%
net credit loss rate, continues to reflect the strong credit
profiles in the region’s target customer segments. Regulatory
changes in many markets in Asia over the past few years have
also resulted in improved credit quality.
For additional information on cost of credit, loan
delinquency and other information for Citi’s consumer loan
portfolios, see each respective business’s results of operations
above and Notes 14 and 15 to the Consolidated Financial
Statements.
Credit Card Trends
The following charts show the quarterly trends in
delinquencies and net credit losses for total GCB cards, North
America Citi-branded cards and Citi retail services portfolios,
as well as for Citi’s Latin America and Asia Citi-branded cards
portfolios.
Global Cards
North America Citi-Branded Cards
North America GCB’s Citi-branded cards portfolio issues
proprietary and co-branded cards.
As shown in the chart above, the net credit loss rate in
Citi-branded cards decreased quarter-over-quarter and year-
over-year as of the fourth quarter of 2020, driven by the
impact of the consumer relief programs described above,
unemployment benefits and government stimulus. The 90+
days past due delinquency rate decreased year-over-year for
the same reasons, while it increased quarter-over-quarter as a
result of seasonality and the impact of customers rolling off
the consumer relief programs described above.
North America Citi Retail Services
71
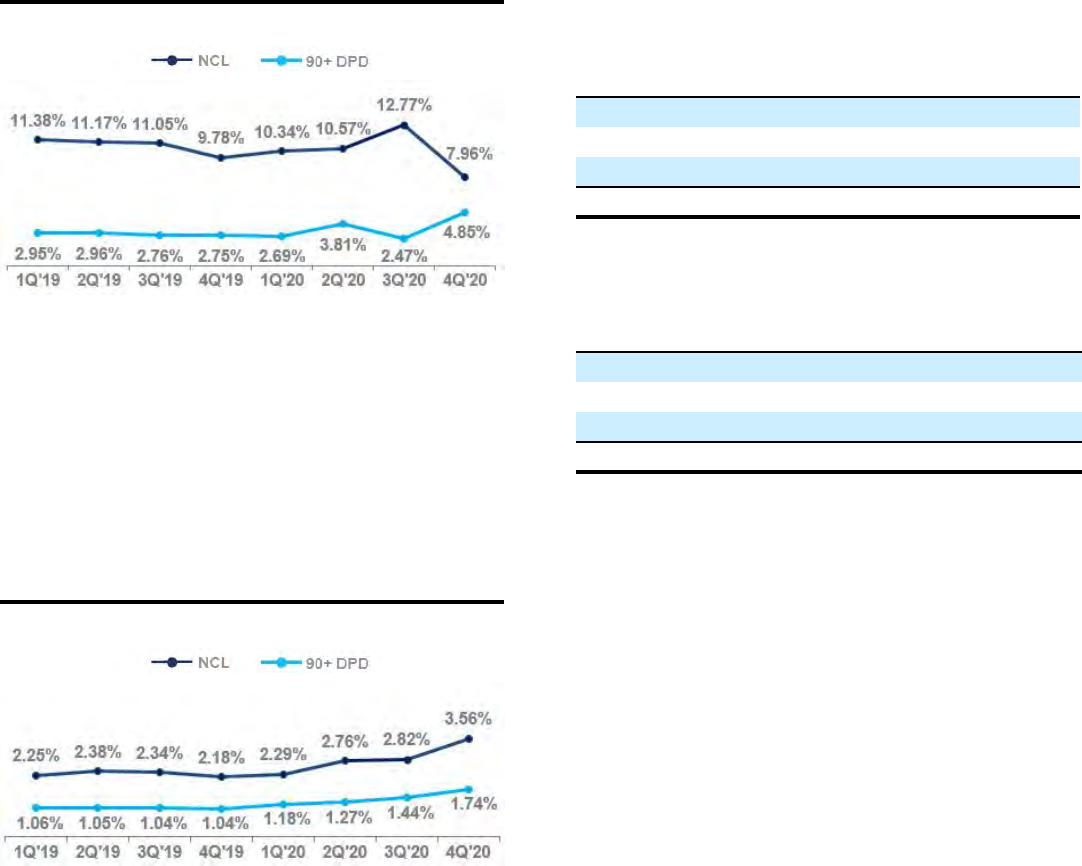
Citi retail services partners directly with more than 20
retailers and dealers to offer private label and co-branded
cards. Citi retail services’ target market focuses on select
industry segments such as home improvement, specialty retail,
consumer electronics and fuel.
Citi retail services continually evaluates opportunities to
add partners within target industries that have strong loyalty,
lending or payment programs and growth potential.
As shown in the chart above, the net credit loss rate in Citi
retail services decreased quarter-over-quarter and year-over-
year as of the fourth quarter of 2020, driven by the impact of
the consumer relief programs described above, unemployment
benefits and government stimulus. The 90+ days past due
delinquency rate decreased year-over-year for the same
reasons, while it increased quarter-over-quarter as a result of
seasonality and the impact of customers rolling off the
consumer relief programs.
Latin America Citi-Branded Cards
Latin America GCB issues proprietary and co-branded
cards.
As shown in the chart above, the net credit loss rate in
Latin America Citi-branded cards decreased significantly
quarter-over-quarter and year-over-year as of the fourth
quarter of 2020, largely driven by the impact of the consumer
relief programs described above, while the 90+ days past due
delinquency rate increased due to the adverse pandemic-
related macroeconomic impact, as well as the expiration of the
cards consumer relief program.
Asia Citi-Branded Cards
(1)
(1) Asia includes loans and leases in certain EMEA countries for all periods
presented.
Asia GCB issues proprietary and co-branded cards.
As shown in the chart above, the net credit loss and 90+
days past due delinquency rates in Asia Citi-branded cards
increased quarter-over-quarter and year-over-year as of the
fourth quarter of 2020, driven by the adverse pandemic-related
macroeconomic impacts as well as the expiration of the
consumer relief programs described above.
For additional information on cost of credit, delinquency
and other information for Citi’s cards portfolios, see each
respective business’s results of operations above and Note 14
to the Consolidated Financial Statements.
North America Cards FICO Distribution
The following tables show the current FICO score
distributions for Citi’s North America cards portfolios based
on end-of-period receivables. FICO scores are updated
monthly for substantially all of the portfolio and on a quarterly
basis for the remaining portfolio.
Citi-Branded Cards
FICO distribution
(1)
Dec. 31,
2020
Sept. 30,
2020
Dec. 31,
2019
> 760 46 % 43 % 42 %
680–760 39 41 40
< 680 15 16 18
Total 100 % 100 % 100 %
Citi Retail Services
FICO distribution
(1)
Dec. 31,
2020
Sept. 30,
2020
Dec. 31,
2019
> 760 27 % 26 % 25 %
680–760 44 44 42
< 680 29 30 33
Total 100 % 100 % 100 %
(1) The FICO bands in the tables are consistent with general industry peer
presentations.
In 2020, FICO distributions improved in both Citi‑
branded cards and Citi retail services, primarily due to the
impacts of the consumer relief programs and significant
government stimulus and assistance, as well as lower credit
utilization due to reduced customer spending. For additional
information on FICO scores, see Note 14 to the Consolidated
Financial Statements.
72

Additional Consumer Credit Details
Consumer Loan Delinquencies Amounts and Ratios
(1)
EOP
loans
(2)
90+ days past due
(3)
30–89 days past due
(3)
December
31, December 31, December 31,
In millions of dollars, except EOP loan
amounts in billions
2020 2020 2019 2018 2020 2019 2018
Global Consumer Banking
(4)(5)
Total $ 282.1 $ 2,507 $ 2,737 $ 2,550 $ 2,517 $ 3,001 $ 2,864
Ratio 0.89 % 0.91 % 0.89 % 0.89 % 1.00 % 1.00 %
Retail banking
Total $ 129.0 $ 632 $ 438 $ 416 $ 860 $ 816 $ 752
Ratio 0.49 % 0.35 % 0.36 % 0.67 % 0.66 % 0.64 %
North America 52.7 299 146 135 328 334 265
Ratio 0.58 % 0.29 % 0.29 % 0.63 % 0.67 % 0.56 %
Latin America 9.8 130 106 108 220 180 185
Ratio 1.33 % 0.91 % 0.95 % 2.24 % 1.54 % 1.62 %
Asia
(6)
66.5 203 186 173 312 302 302
Ratio 0.31 % 0.30 % 0.30 % 0.47 % 0.48 % 0.52 %
Cards
Total $ 153.1 $ 1,875 $ 2,299 $ 2,134 $ 1,657 $ 2,185 $ 2,112
Ratio 1.22 % 1.31 % 1.26 % 1.08 % 1.25 % 1.25 %
North America—Citi-branded 84.0 686 915 812 589 814 755
Ratio 0.82 % 0.95 % 0.88 % 0.70 % 0.85 % 0.82 %
North America—Citi retail services 46.4 644 1,012 952 639 945 932
Ratio 1.39 % 1.91 % 1.81 % 1.38 % 1.79 % 1.77 %
Latin America 4.8 233 165 171 170 159 170
Ratio 4.85 % 2.75 % 3.00 % 3.54 % 2.65 % 2.98 %
Asia
(6)
17.9 312 207 199 259 267 255
Ratio 1.74 % 1.04 % 1.03 % 1.45 % 1.34 % 1.32 %
Corporate/Other—Consumer
(7)
Total $ 6.7 $ 313 $ 278 $ 382 $ 179 $ 295 $ 362
Ratio 5.13 % 3.02 % 2.63 % 2.93 % 3.21 % 2.50 %
Total Citigroup 288.8 $ 2,820 $ 3,015 $ 2,932 $ 2,696 $ 3,296 $ 3,226
Ratio 0.98 % 0.98 % 0.97 % 0.94 % 1.07 % 1.07 %
(1) As discussed above, loans modified under Citi’s consumer relief programs continue to be reported in the same delinquency bucket they were in at the time of
modification (which have various durations, and certain of which may be renewed by the customer).
(2) End-of-period (EOP) loans include interest and fees on credit cards.
(3) The ratios of 90+ days past due and 30–89 days past due are calculated based on EOP loans, net of unearned income.
(4) The 90+ days past due balances for North America—Citi-branded and North America—Citi retail services are generally still accruing interest. Citigroup’s policy is
generally to accrue interest on credit card loans until 180 days past due, unless notification of bankruptcy filing has been received earlier.
(5) The 90+ days past due and 30–89 days past due and related ratios for North America GCB exclude U.S. mortgage loans that are guaranteed by U.S. government-
sponsored agencies, since the potential loss predominantly resides within the agencies. The amounts excluded for loans 90+ days past due and (EOP loans) were
$171 million ($0.7 billion), $135 million ($0.5 billion) and $211 million ($0.7 billion) at December 31, 2020, 2019 and 2018, respectively. The amounts excluded
for loans 30–89 days past due (the 30—89 days past due EOP loans have the same adjustments as the 90+ days past due EOP loans) were $98 million, $72 million
and $86 million at December 31, 2020, 2019 and 2018, respectively.
(6) Asia includes delinquencies and loans in certain EMEA countries for all periods presented.
(7) The 90+ days past due and 30–89 days past due and related ratios exclude U.S. mortgage loans that are guaranteed by U.S. government-sponsored agencies, since
the potential loss predominantly resides within the agencies. The amounts excluded for loans 90+ days past due and (EOP loans) were $183 million ($0.5 billion),
$172 million ($0.4 billion) and $367 million ($.8 billion) at December 31, 2020, 2019 and 2018, respectively. The amounts excluded for loans 30–89 days past
due (the 30—89 days past due EOP loans have the same adjustments as the 90+ days past due EOP loans) were $73 million, $55 million and $122 million at
December 31, 2020, 2019 and 2018, respectively.
73
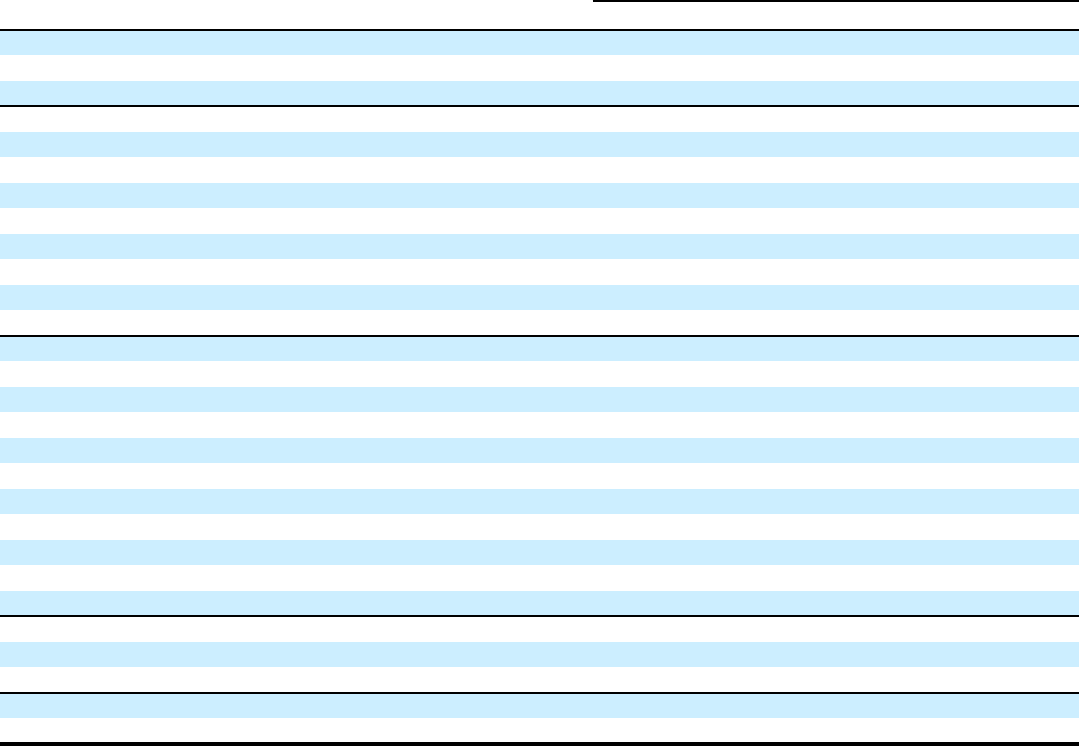
Consumer Loan Net Credit Losses and Ratios
Average
loans
(1)
Net credit losses
(2)
In millions of dollars, except average loan amounts in billions
2020 2020 2019 2018
Global Consumer Banking
Total $ 277.6 $ 6,646 $ 7,382 $ 6,884
Ratio 2.39 % 2.60 % 2.48 %
Retail banking
Total $ 124.5 $ 805 $ 910 $ 913
Ratio 0.65 % 0.76 % 0.78 %
North America 52.2 132 161 126
Ratio 0.25 % 0.33 % 0.27 %
Latin America 9.8 377 494 545
Ratio 3.85 % 4.30 % 4.58 %
Asia
(3)
62.5 296 255 242
Ratio 0.47 % 0.43 % 0.41 %
Cards
Total $ 153.1 $ 5,841 $ 6,472 $ 5,971
Ratio 3.82 % 3.94 % 3.72 %
North America—Citi-branded 84.5 2,708 2,864 2,602
Ratio 3.20 % 3.19 % 2.97 %
North America—Citi retail services 46.5 2,150 2,558 2,357
Ratio 4.62 % 5.13 % 4.88 %
Latin America 4.7 489 615 586
Ratio 10.40 % 10.79 % 10.65 %
Asia
(3)
17.4 494 435 426
Ratio 2.84 % 2.29 % 2.25 %
Corporate/Other—Consumer
Total $ 8.5 $ (21) $ (6) $ 24
Ratio (0.25) % (0.05) % 0.14 %
Total Citigroup $ 286.1 $ 6,625 $ 7,376 $ 6,908
Ratio 2.32 % 2.49 % 2.33 %
(1) Average loans include interest and fees on credit cards.
(2) The ratios of net credit losses are calculated based on average loans, net of unearned income.
(3) Asia includes NCLs and average loans in certain EMEA countries for all periods presented.
74
Loan Maturities and Fixed/Variable Pricing of
U.S. Consumer Mortgages
In millions of dollars at
December 31, 2020
Due
within
1 year
Greater
than 1
year
but within
5 years
Greater
than 5
years Total
U.S. consumer
mortgage loan
portfolio
Residential first
mortgages $ 3 $ 109 $ 47,666 $ 47,778
Home equity loans 116 103 6,909 7,128
Total $ 119 $ 212 $ 54,575 $ 54,906
Fixed/variable
pricing of U.S.
consumer mortgage
loans with maturities
due after one year
Loans at fixed interest
rates $ 194 $ 33,456
Loans at floating or
adjustable interest rates 18 21,119
Total $ 212 $ 54,575
75
CORPORATE CREDIT
Consistent with its overall strategy, Citi’s corporate clients are
typically large, multinational corporations that value the depth
and breadth of Citi’s global network. Citi aims to establish
relationships with these clients that, consistent with client
needs, encompass multiple products, including cash
management and trade services, foreign exchange, lending,
capital markets and M&A advisory. Citi’s corporate credit
exposures also include exposures in the private bank,
excluding certain loans managed on a delinquency basis.
Corporate Credit Portfolio
The following table details Citi’s corporate credit portfolio
within ICG (excluding certain loans in the private bank, which
are managed on a delinquency basis), and before consideration
of collateral or hedges, by remaining tenor for the periods
indicated:
December 31, 2020 September 30, 2020 December 31, 2019
In billions of dollars
Due
within
1 year
Greater
than
1 year
but
within
5 years
Greater
than
5 years
Total
exposure
Due
within
1 year
Greater
than
1 year
but
within
5 years
Greater
than
5 years
Total
exposure
Due
within
1 year
Greater
than
1 year
but
within
5 years
Greater
than
5 years
Total
exposure
Direct outstandings
(on-balance sheet)
(1)
$ 177 $ 142 $ 25 $ 344 $ 175 $ 145 $ 24 $ 344 $ 184 $ 142 $ 25 $ 351
Unfunded lending
commitments
(off-balance sheet)
(2)
158 272 11 441 154 264 12 430 161 266 17 444
Total exposure $ 335 $ 414 $ 36 $ 785 $ 329 $ 409 $ 36 $ 774 $ 345 $ 408 $ 42 $ 795
(1) Includes drawn loans, overdrafts, bankers’ acceptances and leases.
(2) Includes unused commitments to lend, letters of credit and financial guarantees.
Portfolio Mix—Geography and Counterparty
Citi’s corporate credit portfolio is diverse across geography
and counterparty. The following table shows the percentage of
this portfolio by region (excluding the delinquency-managed
private bank portfolio) based on Citi’s internal management
geography:
December 31,
2020
September 30,
2020
December 31,
2019
North America 56 % 57 % 57 %
EMEA 25 25 24
Asia 13 12 12
Latin America 6 6 7
Total 100 % 100 % 100 %
The maintenance of accurate and consistent risk ratings
across the corporate credit portfolio facilitates the comparison
of credit exposure across all lines of business, geographic
regions and products. Counterparty risk ratings reflect an
estimated probability of default for a counterparty and are
derived by leveraging validated statistical models, scorecard
models and external agency ratings (under defined
circumstances), in combination with consideration of factors
specific to the obligor or market, such as management
experience, competitive position, regulatory environment and
commodity prices. Facility risk ratings are assigned that reflect
the probability of default of the obligor and factors that affect
the loss given default of the facility, such as support or
collateral. Internal obligor ratings that generally correspond to
BBB and above are considered investment grade, while those
below are considered non-investment grade.
The following table presents the corporate credit portfolio
(excluding the delinquency-managed private bank portfolio)
by facility risk rating as a percentage of the total corporate
credit portfolio:
Total exposure
December 31,
2020
September 30,
2020
December 31,
2019
AAA/AA/A 49 % 48 % 50 %
BBB 31 31 33
BB/B 17 17 15
CCC or below 3 4 2
Total 100 % 100 % 100 %
Note: Total exposure includes direct outstandings and unfunded lending
commitments.
76
In addition to the obligor and facility risk ratings assigned
to all exposures, Citi may classify exposures in the corporate
credit portfolio. These classifications are consistent with Citi’s
interpretation of the U.S. banking regulators’ definition of
criticized exposures, which may categorize exposures as
special mention, substandard, doubtful, or loss.
Risk ratings and classifications are reviewed regularly,
and adjusted as appropriate. The credit review process
incorporates quantitative and qualitative factors, including
financial and non-financial disclosures or metrics,
idiosyncratic events or changes to the competitive, regulatory
or macroeconomic environment. This includes but is not
limited to exposures in those sectors significantly impacted by
the pandemic (including energy and energy-related, consumer
retail, commercial real estate and transportation).
Citigroup believes the corporate credit portfolio to be
appropriately rated and classified as of December 31, 2020.
During the year and since the onset of the COVID-19
pandemic, Citigroup has taken action to adjust internal ratings
and classifications of exposures as both the macroeconomic
environment and obligor-specific factors have changed,
particularly where additional stress has been seen.
As obligor risk ratings are downgraded, the probability of
default increases. Downgrades of obligor risk ratings tend to
result in a higher provision for credit losses. In addition,
downgrades may result in the purchase of additional credit
derivatives or other risk mitigants to hedge the incremental
credit risk, or may result in Citi seeking to reduce exposure to
an obligor or an industry sector. Citi will continue to review
exposures to ensure the appropriate probability of default is
incorporated into all risk assessments.
For additional information on Citi’s corporate credit
portfolio, see Note 14 to the Consolidated Financial
Statements.
Portfolio Mix—Industry
Citi’s corporate credit portfolio is diversified by industry. The
following table details the allocation of Citi’s total corporate
credit portfolio by industry (excluding the delinquency-
managed private bank portfolio):
Total exposure
December 31,
2020
September 30,
2020
December 31,
2019
Transportation and
industrials 19 % 19 % 19 %
Private bank 14 14 13
Consumer retail 10 11 10
Technology, media
and telecom 11 10 11
Real estate 8 8 7
Power, chemicals,
metals and mining 8 8 9
Banks and finance
companies 7 7 7
Energy and
commodities 6 7 7
Health 5 4 4
Public sector 3 3 3
Insurance 3 3 3
Asset managers
and funds 3 3 3
Financial markets
infrastructure 2 2 2
Securities firms — — —
Other industries 1 1 2
Total 100 % 100 % 100 %
77
The following table details Citi’s corporate credit portfolio by industry as of December 31, 2020:
Non-investment grade Selected metrics
In millions of dollars
Total credit
exposure Funded
(1)
Unfunded
(1)
Investment
grade
Non-
criticized
Criticized
performing
Criticized
non-
performing
(2)
30 days or
more past
due and
accruing
(3)
Net charge-
offs
(recoveries)
(4)
Credit
derivative
hedges
(5)
Transportation and
industrials $ 147,218 $ 60,122 $ 87,096 $ 106,041 $ 17,452 $ 21,927 $ 1,798 $ 136 $ 239 $ (8,110)
Autos
(6)
53,874 25,310 28,564 43,059 4,374 6,167 274 8 45 (3,220)
Transportation 27,693 14,107 13,586 16,410 2,993 6,872 1,418 17 144 (1,166)
Industrials 65,651 20,705 44,946 46,572 10,085 8,888 106 111 50 (3,724)
Private bank 109,397 75,693 33,704 104,244 2,395 2,510 248 963 78 (1,080)
Consumer retail 82,129 34,809 47,320 60,741 11,653 9,418 317 146 64 (5,493)
Technology, media
and telecom 82,657 30,880 51,777 61,296 15,924 5,214 223 107 74 (7,237)
Real estate 65,392 43,285 22,107 54,413 5,342 5,453 184 334 18 (642)
Power, chemicals,
metals and mining 63,926 20,810 43,116 47,923 11,554 4,257 192 59 70 (5,341)
Power 26,916 6,379 20,537 22,665 3,336 761 154 14 57 (2,637)
Chemicals 22,356 7,969 14,387 16,665 3,804 1,882 5 32 8 (2,102)
Metals and mining 14,654 6,462 8,192 8,593 4,414 1,614 33 13 5 (602)
Banks and finance
companies 52,925 29,856 23,069 43,831 4,648 4,387 59 27 79 (765)
Energy and
commodities
(7)
49,524 15,086 34,438 34,636 7,345 6,546 997 70 285 (4,199)
Health 35,504 8,658 26,846 29,164 4,354 1,749 237 17 17 (1,964)
Public sector 26,887 13,599 13,288 22,276 1,887 2,708 16 45 9 (1,089)
Insurance 26,576 1,925 24,651 25,864 575 136 1 27 1 (2,682)
Asset managers and
funds 19,745 4,491 15,254 18,528 1,013 191 13 41 (1) (84)
Financial markets
infrastructure 12,610 229 12,381 12,590 20 — — — — (9)
Securities firms 976 430 546 573 298 97 8 — — (6)
Other industries 9,307 4,545 4,762 4,980 2,702 1,442 183 10 43 (138)
Total $ 784,773 $ 344,418 $ 440,355 $ 627,100 $ 87,162 $ 66,035 $ 4,476 $ 1,982 $ 976 $ (38,839)
(1) Excludes $42.6 billion and $4.4 billion of funded and unfunded exposure at December 31, 2020, respectively, primarily related to the delinquency-managed credit
portfolio of the private bank.
(2) Includes non-accrual loan exposures and criticized unfunded exposures.
(3) Excludes $162 million of past due loans primarily related to the delinquency-managed credit portfolio of the private bank.
(4) Net charge-offs (recoveries) are for the year ended December 31, 2020 and exclude delinquency-managed private bank charge-offs of $10 million.
(5) Represents the amount of purchased credit protection in the form of derivatives to economically hedge funded and unfunded exposures. Of the $38.8 billion of
purchased credit protection, $36.8 billion represents the total notional of purchased credit derivatives on individual reference entities. The remaining $2.0 billion
represents the first loss tranche of portfolios of purchased credit derivatives with a total notional of $16.1 billion, where the protection seller absorbs the first loss
on the referenced loan portfolios.
(6) Autos total credit exposure includes securitization financing facilities secured by auto loans and leases, extended mainly to the finance company subsidiaries of
global auto manufacturers, bank subsidiaries and independent auto finance companies, of approximately $20.2 billion ($10.3 billion in funded, with more than
99% rated investment grade) as of December 31, 2020.
(7) In addition to this exposure, Citi has energy-related exposure within the public sector (e.g., energy-related state-owned entities) and the transportation and
industrials sector (e.g., off-shore drilling entities) included in the table above. As of December 31, 2020, Citi’s total exposure to these energy-related entities was
approximately $7.0 billion, of which approximately $3.8 billion consisted of direct outstanding funded loans.
78
Exposure to Commercial Real Estate
As of December 31, 2020, ICG’s total corporate credit
exposure to commercial real estate (CRE) was $58 billion,
with $41 billion consisting of direct outstanding funded loans
(mainly included in the real estate and private bank categories
in the above table), or 6% of Citi’s total outstanding loans. In
addition, as of December 31, 2020, more than 70% of ICG’s
total corporate CRE exposure was to borrowers in the United
States. Also as of December 31, 2020, approximately 77% of
ICG’s total corporate CRE exposure was rated investment
grade.
As of December 31, 2020, the ACLL was 1.8% of funded
CRE exposure, including 5.1% of funded non-investment
grade exposure.
Of the total CRE exposure:
• $20 billion of the exposure ($13 billion of direct
outstanding funded loans) relates to Community
Reinvestment Act-related lending provided pursuant to
Citi’s regulatory requirements to meet the credit needs of
borrowers in low and moderate income neighborhoods.
• $13 billion of the exposure ($12 billion of direct
outstanding funded loans) relates to exposure secured by
mortgages on underlying properties or in well-rated
securitization exposures.
• $13 billion of the exposure ($5 billion of direct
outstanding funded loans) relates to unsecured loans to
large REITs, with nearly 75% of the exposure rated
investment grade.
• $12 billion of the exposure ($11 billion of direct
outstanding funded loans) relates to CRE exposure in the
private bank, of which 100% is secured by mortgages. In
addition, 45% of the exposure is also full recourse to the
client. As of December 31, 2020, 77% of the exposure
was rated investment grade.
79
The following table details Citi’s corporate credit portfolio by industry as of December 31, 2019:
Non-investment grade Selected metrics
In millions of dollars
Total credit
exposure Funded
(1)
Unfunded
(1)
Investment
grade
Non-
criticized
Criticized
performing
Criticized
non-
performing
(2)
30 days or
more past
due and
accruing
(3)
Net charge-
offs
(recoveries)
(4)
Credit
derivative
hedges
(5)
Transportation and
industrials $ 146,643 $ 59,726 $ 86,917 $ 120,777 $ 19,433 $ 5,725 $ 706 $ 161 $ 67 $ (7,134)
Autos
(6)
48,604 21,564 27,040 43,570 3,582 1,311 140 8 5 (2,982)
Transportation 29,984 14,550 15,434 23,021 4,886 1,652 425 21 21 (725)
Industrials 68,055 23,612 44,443 54,186 10,965 2,762 141 132 41 (3,427)
Private bank
(1)
102,463 68,798 33,665 100,017 2,244 171 31 1,094 36 (1,080)
Consumer retail 81,338 36,117 45,221 62,993 15,131 2,773 441 209 38 (4,105)
Technology, media and
telecom 83,199 31,333 51,866 63,845 15,846 3,305 203 81 14 (6,181)
Real estate 55,518 38,058 17,460 49,461 5,495 525 37 97 (3) (573)
Power, chemicals, metals
and mining 73,961 24,377 49,584 58,670 11,997 2,963 331 50 24 (4,763)
Power 34,349 7,683 26,666 29,317 4,051 679 302 37 19 (2,111)
Chemicals 23,721 9,152 14,569 18,790 3,905 1,014 12 12 1 (2,079)
Metals and mining 15,891 7,542 8,349 10,563 4,041 1,270 17 1 4 (573)
Banks and finance
companies 52,036 32,571 19,465 43,663 4,661 3,345 39 15 12 (755)
Energy and commodities
(7)
53,317 17,428 35,889 42,996 5,780 3,627 914 51 99 (2,808)
Health 35,008 8,790 26,218 27,791 5,932 1,180 105 25 14 (1,588)
Public sector 27,194 14,226 12,968 23,294 1,637 2,558 33 107 1 (944)
Insurance 24,305 1,658 22,647 23,370 866 69 — 7 1 (2,218)
Asset managers and funds 24,763 6,942 17,821 22,357 2,276 130 — 1 31 (32)
Financial markets
infrastructure 16,838 22 16,816 16,838 — — — — — (2)
Securities firms 1,151 423 728 801 304 38 8 — 13 —
Other industries 16,842 9,718 7,214 8,299 7,383 1,080 80 48 42 65
Total $ 794,576 $ 350,187 $ 444,479 $ 665,172 $ 98,985 $ 27,489 $ 2,928 $ 1,946 $ 389 $ (32,118)
(1) Excludes $39.7 billion and $3.4 billion of funded and unfunded exposure at December 31, 2019, respectively, primarily related to the delinquency-managed credit
portfolio of the private bank.
(2) Includes non-accrual loan exposures and criticized unfunded exposures.
(3) Excludes $434 million of past due loans primarily related to the delinquency-managed credit portfolio of the private bank.
(4) Net charge-offs (recoveries) are for the year ended December 31, 2019 and exclude delinquency-managed private bank charge-offs of $6 million.
(5) Represents the amount of purchased credit protection in the form of derivatives to economically hedge funded and unfunded exposures. Of the $32.1 billion of
purchased credit protection, $30.5 billion represents the total notional of purchased credit derivatives on individual reference entities. The remaining $1.6 billion
represents the first loss tranche of portfolios of purchased credit derivatives with a total notional of $13.8 billion, where the protection seller absorbs the first loss
on the referenced loan portfolios.
(6) Autos total credit exposure includes securitization financing facilities secured by auto loans and leases, extended mainly to the finance company subsidiaries of
global auto manufacturers, bank subsidiaries and independent auto finance companies, of approximately $17.9 billion ($7.7 billion in funded, with more than 99%
rated investment grade) at December 31, 2019.
(7) In addition to this exposure, Citi has energy-related exposure within the public sector (e.g., energy-related state-owned entities) and the transportation and
industrials sector (e.g., off-shore drilling entities) included in the table above. As of December 31, 2019, Citi’s total exposure to these energy-related entities was
approximately $5.5 billion, of which approximately $3.2 billion consisted of direct outstanding funded loans.
80

Credit Risk Mitigation
As part of its overall risk management activities, Citigroup
uses credit derivatives and other risk mitigants to hedge
portions of the credit risk in its corporate credit portfolio, in
addition to outright asset sales. Citi may enter into partial-term
hedges as well as full-term hedges. In advance of the
expiration of partial-term hedges, Citi will determine, among
other factors, the economic feasibility of hedging the
remaining life of the instrument. The results of the mark-to-
market and any realized gains or losses on credit derivatives
are reflected primarily in Principal transactions in the
Consolidated Statement of Income.
At December 31, 2020, September 30, 2020 and
December 31, 2019, ICG (excluding the delinquency-managed
private bank portfolio) had economic hedges on the corporate
credit portfolio of $38.8 billion, $38.4 billion and
$32.1 billion, respectively. Citigroup’s expected credit loss
model used in the calculation of its ACL does not include the
favorable impact of credit derivatives and other mitigants that
are marked to market. In addition, the reported amounts of
direct outstandings and unfunded lending commitments in the
tables above do not reflect the impact of these hedging
transactions. The credit protection was economically hedging
underlying ICG (excluding the delinquency-managed private
bank portfolio) corporate credit portfolio exposures with the
following risk rating distribution:
Rating of Hedged Exposure
December 31,
2020
September 30,
2020
December 31,
2019
AAA/AA/A 30 % 29 % 36 %
BBB 48 52 51
BB/B 19 16 12
CCC or below 3 3 1
Total 100 % 100 % 100 %
Loan Maturities and Fixed/Variable Pricing of Corporate
Loans
In millions of dollars at
December 31, 2020
Due
within
1 year
Over 1
year
but
within
5 years
Over 5
years Total
Corporate loans
In U.S. offices
Commercial and
industrial loans $ 27,175 $ 16,073 $ 14,483 $ 57,731
Financial institutions 26,270 15,538 14,001 55,809
Mortgage and real
estate 28,560 16,893 15,222 60,675
Installment, revolving
credit and other 12,589 7,446 6,709 26,744
Lease financing 317 187 169 673
In offices outside the
U.S. 126,273 49,708 9,431 185,412
Total corporate
loans $ 221,184 $ 105,845 $ 60,015 $ 387,044
Fixed/variable
pricing of corporate
loans with
maturities due after
one year
(1)
Loans at fixed
interest rates $ 16,514 $ 21,346
Loans at floating or
adjustable interest
rates 89,331 38,669
Total $ 105,845 $ 60,015
(1) Based on contractual terms. Repricing characteristics may effectively be
modified from time to time using derivative contracts. See Note 22 to
the Consolidated Financial Statements.
81

ADDITIONAL CONSUMER AND CORPORATE CREDIT DETAILS
Loans Outstanding
December 31,
In millions of dollars
2020 2019 2018 2017 2016
Consumer loans
In North America offices
(1)
Residential first mortgages
(2)
$ 47,778 $ 47,008 $ 47,412 $ 49,375 $ 53,131
Home equity loans
(2)
7,128 9,223 11,543 14,827 19,454
Credit cards 130,385 149,163 144,542 139,718 133,297
Personal, small business and other 4,509 3,699 4,046 4,140 5,290
Total $ 189,800 $ 209,093 $ 207,543 $ 208,060 $ 211,172
In offices outside North America
(1)
Residential first mortgages
(2)
$ 39,969 $ 38,024 $ 36,388 $ 37,870 $ 35,523
Credit cards 22,692 25,909 24,951 25,727 23,055
Personal, small business and other 36,378 36,522 33,478 34,157 30,966
Total $ 99,039 $ 100,455 $ 94,817 $ 97,754 $ 89,544
Consumer loans, net of unearned income
(3)
$ 288,839 $ 309,548 $ 302,360 $ 305,814 $ 300,716
Corporate loans
In North America offices
(1)
Commercial and industrial $ 57,731 $ 55,929 $ 60,861 $ 60,219 $ 57,886
Financial institutions 55,809 53,922 48,447 39,128 35,517
Mortgage and real estate
(2)
60,675 53,371 50,124 44,683 38,691
Installment and other 26,744 31,238 32,425 31,932 31,194
Lease financing 673 1,290 1,429 1,470 1,518
Total $ 201,632 $ 195,750 $ 193,286 $ 177,432 $ 164,806
In offices outside North America
(1)
Commercial and industrial $ 104,072 $ 112,668 $ 114,029 $ 113,178 $ 100,532
Financial institutions 32,334 40,211 36,837 35,273 26,886
Mortgage and real estate
(2)
11,371 9,780 7,376 7,309 5,363
Installment and other 33,759 27,303 25,685 22,638 19,965
Lease financing 65 95 103 190 251
Governments and official institutions 3,811 4,128 4,520 5,200 5,850
Total $ 185,412 $ 194,185 $ 188,550 $ 183,788 $ 158,847
Corporate loans, net of unearned income
(4)
$ 387,044 $ 389,935 $ 381,836 $ 361,220 $ 323,653
Total loans—net of unearned income $ 675,883 $ 699,483 $ 684,196 $ 667,034 $ 624,369
Allowance for credit losses on loans (ACLL) (24,956) (12,783) (12,315) (12,355) (12,060)
Total loans—net of unearned income
and ACLL $ 650,927 $ 686,700 $ 671,881 $ 654,679 $ 612,309
ACLL as a percentage of total loans—
net of unearned income
(5)
3.73 % 1.84 % 1.81 % 1.86 % 1.94 %
ACLL for consumer loan losses as a percentage of
total consumer loans—net of unearned income
(5)
6.77 % 3.20 % 3.14 % 3.08 % 2.94 %
ACLL for corporate loan losses as a percentage of
total corporate loans—net of unearned income
(5)
1.42 % 0.75 % 0.74 % 0.82 % 1.01 %
(1) North America includes the U.S., Canada and Puerto Rico. Mexico is included in offices outside North America. The classification of corporate loans between
offices in North America and outside North America is based on the domicile of the booking unit. The difference between the domicile of the booking unit and the
domicile of the managing unit is not material.
(2) Loans secured primarily by real estate.
(3) Consumer loans are net of unearned income of $749 million, $783 million, $742 million, $768 million and $803 million at December 31, 2020, 2019, 2018, 2017
and 2016, respectively. Unearned income on consumer loans primarily represents unamortized origination fees and costs, premiums and discounts.
(4) Corporate loans include private bank loans and are net of unearned income of $(844) million, $(814) million, $(855) million, $(794) million and $(730) million at
December 31, 2020, 2019, 2018, 2017 and 2016, respectively. Unearned income on corporate loans primarily represents interest received in advance, but not yet
earned, on loans originated on a discounted basis.
(5) Because loans carried at fair value do not have an ACLL, they are excluded from the ACLL ratio calculation.
82

Details of Credit Loss Experience
In millions of dollars
2020 2019 2018 2017 2016
Allowance for credit losses on loans (ACLL) at beginning of year $ 12,783 $ 12,315 $ 12,355 $ 12,060 $ 12,626
Adjustments to opening balance:
Financial instruments—credit losses (CECL)
(1)
4,201 — — — —
Variable post-charge-off third-party collection costs
(2)
(443) — — — —
Adjusted ACLL at beginning of year $ 16,541 $ 12,315 $ 12,355 $ 12,060 $ 12,626
Provision for credit losses on loans (PCLL)
Consumer
(2)
$ 11,765 $ 7,751 $ 7,258 $ 7,329 $ 6,207
Corporate 4,157 467 96 174 542
Total $ 15,922 $ 8,218 $ 7,354 $ 7,503 $ 6,749
Gross credit losses on loans
Consumer
In U.S. offices $ 6,047 $ 6,538 $ 5,971 $ 5,664 $ 4,874
In offices outside the U.S. 2,144 2,316 2,351 2,377 2,594
Corporate
Commercial and industrial, and other
In U.S. offices 562 265 121 223 370
In offices outside the U.S. 409 196 208 401 334
Loans to financial institutions
In U.S. offices 14 — 3 3 5
In offices outside the U.S. 12 3 7 1 5
Mortgage and real estate
In U.S. offices 71 23 2 2 34
In offices outside the U.S. 4 — 2 2 6
Total $ 9,263 $ 9,341 $ 8,665 $ 8,673 $ 8,222
Credit recoveries on loans
(2)
Consumer
In U.S. offices $ 1,106 $ 975 $ 912 $ 892 $ 972
In offices outside the U.S. 460 503 502 552 576
Corporate
Commercial and industrial, and other
In U.S. offices 43 28 47 31 31
In offices outside the U.S. 28 59 78 117 79
Loans to financial institutions
In U.S. offices — — — 1 1
In offices outside the U.S. 14 — 3 1 1
Mortgage and real estate
In U.S. offices — 8 6 2 1
In offices outside the U.S. 1 — 4 1 —
Total $ 1,652 $ 1,573 $ 1,552 $ 1,597 $ 1,661
Net credit losses on loans (NCLs)
In U.S. offices $ 5,545 $ 5,815 $ 5,132 $ 4,966 $ 4,278
In offices outside the U.S. 2,066 1,953 1,981 2,110 2,283
Total $ 7,611 $ 7,768 $ 7,113 $ 7,076 $ 6,561
Other—net
(3)(4)(5)(6)(7)(8)
$ 104 $ 18 $ (281) $ (132) $ (754)
Allowance for credit losses on loans (ACLL) at end of year $ 24,956 $ 12,783 $ 12,315 $ 12,355 $ 12,060
ACLL as a percentage of EOP loans
(9)
3.73 % 1.84 % 1.81 % 1.86 % 1.94 %
Allowance for credit losses on unfunded lending commitments
(ACLUC)
(10)(11)
$ 2,655 $ 1,456 $ 1,367 $ 1,258 $ 1,418
83
Total ACLL and ACLUC $ 27,611 $ 14,239 $ 13,682 $ 13,613 $ 13,478
Net consumer credit losses on loans $ 6,625 $ 7,376 $ 6,908 $ 6,597 $ 5,920
As a percentage of average consumer loans 2.32 % 2.49 % 2.33 % 2.22 % 2.00 %
Net corporate credit losses on loans $ 986 $ 392 $ 205 $ 479 $ 641
As a percentage of average corporate loans 0.25 % 0.10 % 0.05 % 0.14 % 0.20 %
ACLL by type at end of year
(12)
Consumer $ 19,554 $ 9,897 $ 9,504 $ 9,412 $ 8,842
Corporate 5,402 2,886 2,811 2,943 3,218
Total $ 24,956 $ 12,783 $ 12,315 $ 12,355 $ 12,060
(1) On January 1, 2020, Citi adopted Accounting Standards Codification (ASC) 326, Financial Instruments—Credit Losses (CECL). The ASC introduces a new credit
loss methodology requiring earlier recognition of credit losses while also providing additional disclosure about credit risk. On January 1, 2020, Citi recorded a
$4.1 billion, or an approximate 29%, pretax increase in the Allowance for credit losses, along with a $3.1 billion after-tax decrease in Retained earnings and a
deferred tax asset increase of $1.0 billion. This transition impact reflects (i) a $4.9 billion build to the Consumer ACL due to longer estimated tenors than under
the incurred loss methodology under prior U.S. GAAP, net of recoveries; and (ii) a $0.8 billion decrease to the Corporate ACL due to shorter remaining tenors,
incorporation of recoveries and use of more specific historical loss data based on an increase in portfolio segmentation across industries and geographies. See Note
1 to the Consolidated Financial Statements for further discussion on the impact of Citi’s adoption of CECL.
(2) Citi had a change in accounting related to its variable post-charge-off third-party collection costs which was recorded as an adjustment to its January 1, 2020
opening allowance for credit losses on loans of $443 million. See Note 1 to the Consolidated Financial Statements.
(3) Includes all adjustments to the ACL, such as changes in the allowance from acquisitions, dispositions, securitizations, FX translation, purchase accounting
adjustments, etc.
(4) 2020 includes reductions of approximately $4 million related to the transfer to HFS of various real estate loan portfolios. In addition, 2020 includes an increase of
approximately $97 million related to FX translation.
(5) 2019 includes reductions of approximately $42 million related to the transfer to HFS of various real estate loan portfolios. In addition, 2019 includes an increase
of approximately $60 million related to FX translation.
(6) 2018 includes reductions of approximately $201 million related to the sale or transfer to HFS of various loan portfolios, which include approximately $91 million
related to the transfer of various real estate loan portfolios to HFS. In addition, 2018 includes a reduction of approximately $60 million related to FX translation.
(7) 2017 includes reductions of approximately $261 million related to the sale or transfer to HFS of various loan portfolios, which include approximately $106 million
related to the transfer of various real estate loan portfolios to HFS. In addition, 2017 includes an increase of approximately $115 million related to FX translation.
(8) 2016 includes reductions of approximately $574 million related to the sale or transfer to HFS of various loan portfolios, which include approximately $106 million
related to the transfer of various real estate loan portfolios to HFS. In addition, 2016 includes a reduction of approximately $199 million related to FX translation.
(9) December 31, 2020, 2019, 2018, 2017 and 2016 exclude $6.9 billion, $4.1 billion, $3.2 billion, $4.4 billion and $3.5 billion, respectively, of loans which are
carried at fair value.
(10) 2020 corporate ACLUC includes a non-provision transfer of $68 million, representing reserves on performance guarantees. The reserves on these contracts were
reclassified out of the ACL on unfunded lending commitments and into other liabilities.
(11) Represents additional credit reserves recorded as Other liabilities on the Consolidated Balance Sheet.
(12) Beginning in 2020, under CECL, the ACLL represents management’s estimate of expected credit losses in the portfolio.and troubled debt restructurings. See
“Significant Accounting Policies and Significant Estimates” and Note 1 to the Consolidated Financial Statements below. Attribution of the ACLL is made for
analytical purposes only and the entire ACLL is available to absorb credit losses in the overall portfolio. Prior to 2020, the ACLL represented management’s
estimate of probable losses inherent in the portfolio, as well as probable losses related to large individually evaluated impaired loans and TDRs. See “Superseded
Accounting Principles” in Note 1 to the Consolidated Financial Statements.
84
Allowance for Credit Losses on Loans (ACLL)
The following tables detail information on Citi’s ACLL, loans and coverage ratios. The December 31, 2020 table reflects the impact
from the January 1, 2020 CECL adoption and the impact from the pandemic. The December 31, 2019 table is presented under the
previous accounting standard (see “Superseded Accounting Principles” in Note 1 to the Consolidated Financial Statements).
December 31, 2020
In billions of dollars
ACLL
EOP loans, net of
unearned income
ACLL as a
percentage of EOP
loans
(1)
North America cards
(2)
$ 14.7 $ 130.4 11.3 %
North America mortgages
(3)
0.7 54.9 1.3
North America other 0.3 4.5 6.7
International cards 2.1 22.7 9.3
International other
(4)
1.8 76.3 2.4
Total consumer $ 19.6 $ 288.8 6.8 %
Total corporate 5.4 387.1 1.4
Total Citigroup $ 25.0 $ 675.9 3.7 %
(1) Loans carried at fair value do not have an ACLL and are excluded from the ACLL ratio calculation.
(2) Includes both Citi-branded cards and Citi retail services. The $14.7 billion of loan loss reserves represented approximately 53 months of coincident net credit loss
coverage. As of December 31, 2020, the North America Citi-branded cards ACLL as a percentage of EOP loans was 10.0% and the North America Citi retail
services ACLL as a percentage of EOP loans was 13.6%.
(3) Of the $0.7 billion, approximately $0.3 billion was allocated to North America mortgages in Corporate/Other, including $0.5 billion and $0.2 billion determined
in accordance with ASC 450-20 and ASC 310-10-35 (troubled debt restructurings), respectively. Of the $54.9 billion in loans, approximately $53.0 billion and
$1.9 billion of the loans were evaluated in accordance with ASC 450-20 and ASC 310-10-35 (troubled debt restructurings), respectively. For additional
information, see Note 15 to the Consolidated Financial Statements.
(4) Includes mortgages and other retail loans.
December 31, 2019
In billions of dollars
ACLL
EOP loans, net of
unearned income
ACLL as a
percentage of EOP
loans
(1)
North America cards
(2)
$ 7.0 $ 149.2 4.7 %
North America mortgages
(3)
0.3 56.2 0.5
North America other 0.1 3.7 2.7
International cards 1.4 25.9 5.4
International other
(4)
1.1 74.6 1.5
Total consumer $ 9.9 $ 309.6 3.2 %
Total corporate 2.9 389.9 0.7
Total Citigroup $ 12.8 $ 699.5 1.8 %
(1) Loans carried at fair value do not have an ACLL and are excluded from the ACLL ratio calculation.
(2) Includes both Citi-branded cards and Citi retail services. The $7.0 billion of loan loss reserves represented approximately 15 months of coincident net credit loss
coverage.
(3) Of the $0.3 billion, nearly all was allocated to North America mortgages in Corporate/Other, including $0.1 billion and $0.2 billion determined in accordance with
ASC 450-20 and ASC 310-10-35 (troubled debt restructurings), respectively. Of the $56.2 billion in loans, approximately $54.2 billion and $2.0 billion of the
loans were evaluated in accordance with ASC 450-20 and ASC 310-10-35 (troubled debt restructurings), respectively. For additional information, see Note 15 to
the Consolidated Financial Statements.
(4) Includes mortgages and other retail loans.
85
The following table details Citi’s corporate credit allowance for credit losses on loans (ACLL) by industry exposure:
December 31, 2020
In millions of dollars, except percentages
Funded
exposure
(1)
ACLL
(2)(3)
ACLL as a % of
funded exposure
Transportation and industrials $ 58,352 $ 1,558 2.67 %
Private bank 75,693 224 0.30
Consumer retail 34,621 563 1.63
Technology, media and telecom 29,821 407 1.36
Real estate 42,711 718 1.68
Power, chemicals, metals and mining 20,156 312 1.55
Banks and finance companies 29,570 219 0.74
Energy and commodities 14,009 523 3.73
Health 8,575 144 1.68
Public sector 13,416 172 1.28
Insurance 1,925 7 0.36
Asset managers and funds 4,491 22 0.49
Financial markets infrastructure 229 — —
Securities firms 430 10 2.33
Other industries 3,579 122 3.41
Total $ 337,578 $ 5,001 1.48 %
(1) Funded exposure excludes $6,840 million of loans at fair value that are not subject to ACLL under the CECL standard.
(2) As of December 31, 2020, the ACLL shown above reflects coverage of 0.5% of funded investment grade exposure and 4.4% of funded non-investment grade
exposure.
(3) Excludes $401 million of ACLL associated with approximately $43 billion of funded delinquency-managed private bank exposures at December 31, 2020.
Including those reserves and exposures, the total ACLL is 1.42% of total funded exposure, including 0.5% of funded investment grade exposure and 4.4% of
funded non-investment grade exposure.
86
Non-Accrual Loans and Assets and Renegotiated Loans
There is a certain amount of overlap among non-accrual loans
and assets and renegotiated loans. The following summary
provides a general description of each category.
Non-Accrual Loans and Assets:
• Corporate and consumer (including commercial banking)
non-accrual status is based on the determination that
payment of interest or principal is doubtful.
• A corporate loan may be classified as non-accrual and still
be performing under the terms of the loan structure. Non-
accrual loans may still be current on interest payments.
Approximately 59%, 58% and 44% of Citi’s corporate
non-accrual loans were performing at December 31, 2020,
September 30, 2020 and December 31, 2019, respectively.
• Consumer non-accrual status is generally based on aging,
i.e., the borrower has fallen behind on payments.
• Consumer mortgage loans, other than Federal Housing
Administration (FHA) insured loans, are classified as
non-accrual within 60 days of notification that the
borrower has filed for bankruptcy. In addition, home
equity loans are classified as non-accrual if the related
residential first mortgage loan is 90 days or more past
due.
• North America Citi-branded cards and Citi retail services
are not included because, under industry standards, credit
card loans accrue interest until such loans are charged off,
which typically occurs at 180 days of contractual
delinquency.
Renegotiated Loans:
• Includes both corporate and consumer loans whose terms
have been modified in a troubled debt restructuring
(TDR).
• Includes both accrual and non-accrual TDRs.
87
Non-Accrual Loans
The table below summarizes Citigroup’s non-accrual loans as
of the periods indicated. Non-accrual loans may still be current
on interest payments. In situations where Citi reasonably
expects that only a portion of the principal owed will
ultimately be collected, all payments received are reflected as
a reduction of principal and not as interest income. For all
other non-accrual loans, cash interest receipts are generally
recorded as revenue.
December 31,
In millions of dollars
2020 2019 2018 2017 2016
Corporate non-accrual loans
(1)
North America $ 1,928 $ 1,214 $ 586 $ 966 $ 1,291
EMEA 661 430 375 849 904
Latin America 719 473 307 348 441
Asia 219 71 243 70 220
Total corporate non-accrual loans $ 3,527 $ 2,188 $ 1,511 $ 2,233 $ 2,856
Consumer non-accrual loans
(1)
North America $ 1,059 $ 905 $ 1,138 $ 1,468 $ 1,854
Latin America 774 632 638 688 648
Asia
(2)
308 279 250 243 221
Total consumer non-accrual loans $ 2,141 $ 1,816 $ 2,026 $ 2,399 $ 2,723
Total non-accrual loans $ 5,668 $ 4,004 $ 3,537 $ 4,632 $ 5,579
(1) For years prior to 2020, excludes purchased credit-deteriorated loans, as they are generally accreting interest. The carrying value of these loans was $128 million
at December 31, 2019, $128 million at December 31, 2018, $167 million at December 31, 2017 and $187 million at December 31, 2016.
(2) Asia includes balances in certain EMEA countries for all periods presented.
The changes in Citigroup’s non-accrual loans were as follows:
Year ended Year ended
December 31, 2020 December 31, 2019
In millions of dollars
Corporate Consumer Total Corporate Consumer Total
Non-accrual loans at beginning of year $ 2,188 $ 1,816 $ 4,004 $ 1,511 $ 2,026 $ 3,537
Additions 5,103 2,829 7,932 3,407 2,954 6,361
Sales and transfers to HFS (2) (95) (97) (23) (171) (194)
Returned to performing (157) (389) (546) (68) (431) (499)
Paydowns/settlements (3,117) (677) (3,794) (2,496) (902) (3,398)
Charge-offs (446) (1,132) (1,578) (268) (1,444) (1,712)
Other (42) (211) (253) 125 (216) (91)
Ending balance $ 3,527 $ 2,141 $ 5,668 $ 2,188 $ 1,816 $ 4,004
88
Non-Accrual Assets
The table below summarizes Citigroup’s other real estate
owned (OREO) assets. OREO is recorded on the Consolidated
Balance Sheet within Other assets. This represents the
carrying value of all real estate property acquired by
foreclosure or other legal proceedings when Citi has taken
possession of the collateral:
December 31,
In millions of dollars
2020 2019 2018 2017 2016
OREO
North America $ 19 $ 39 $ 64 $ 89 $ 161
EMEA — 1 1 2 —
Latin America 7 14 12 35 18
Asia 17 7 22 18 7
Total OREO $ 43 $ 61 $ 99 $ 144 $ 186
Non-accrual assets
Corporate non-accrual loans $ 3,527 $ 2,188 $ 1,511 $ 2,233 $ 2,856
Consumer non-accrual loans 2,141 1,816 2,026 2,399 2,723
Non-accrual loans (NAL) $ 5,668 $ 4,004 $ 3,537 $ 4,632 $ 5,579
OREO $ 43 $ 61 $ 99 $ 144 $ 186
Non-accrual assets (NAA) $ 5,711 $ 4,065 $ 3,636 $ 4,776 $ 5,765
NAL as a percentage of total loans 0.84 % 0.57 % 0.52 % 0.69 % 0.89 %
NAA as a percentage of total assets 0.25 0.21 0.19 0.26 0.32
ACLL as a percentage of NAL
(1)
440 319 348 267 216
(1) The ACLL includes the allowance for Citi’s credit card portfolios and purchased distressed loans, while the non-accrual loans exclude credit card balances (with
the exception of certain international portfolios) and, prior to 2020, include purchased credit-deteriorated loans as these continue to accrue interest until charge-off.
89

Renegotiated Loans
The following table presents Citi’s loans modified in TDRs:
In millions of dollars
Dec. 31,
2020
Dec. 31,
2019
Corporate renegotiated loans
(1)
In U.S. offices
Commercial and industrial
(2)
$ 193 $ 226
Mortgage and real estate 60 57
Financial institutions — —
Other 30 4
Total $ 283 $ 287
In offices outside the U.S.
Commercial and industrial
(2)
$ 132 $ 200
Mortgage and real estate 32 22
Financial institutions — —
Other 3 40
Total $ 167 $ 262
Total corporate renegotiated loans $ 450 $ 549
Consumer renegotiated loans
(3)
In U.S. offices
Mortgage and real estate $ 1,904 $ 1,956
Cards 1,449 1,464
Installment and other 33 17
Total $ 3,386 $ 3,437
In offices outside the U.S.
Mortgage and real estate $ 361 $ 305
Cards 533 466
Installment and other 519 400
Total $ 1,413 $ 1,171
Total consumer renegotiated loans $ 4,799 $ 4,608
(1) Includes $415 million and $472 million of non-accrual loans included in
the non-accrual loans table above at December 31, 2020 and 2019,
respectively. The remaining loans are accruing interest.
(2) In addition to modifications reflected as TDRs at December 31, 2020
and 2019, Citi also modified $47 million and $26 million, respectively,
of commercial loans risk rated “Substandard Non-Performing” or worse
(asset category defined by banking regulators) in offices outside the U.S.
These modifications were not considered TDRs because they did not
involve a concession or because they qualified for exemptions from
TDR accounting provided by the CARES Act or Interagency Guidance.
(3) Includes $873 million and $814 million of non-accrual loans included in
the non-accrual loans table above at December 31, 2020 and 2019,
respectively. The remaining loans are accruing interest.
Forgone Interest Revenue on Loans
(1)
In millions of dollars
In U.S.
offices
In non-
U.S.
offices
2020
total
Interest revenue that
would have been accrued
at original contractual
rates
(2)
$ 428 $ 365 $ 793
Amount recognized as
interest revenue
(2)
177 134 311
Forgone interest
revenue $ 251 $ 231 $ 482
(1) Relates to corporate non-accrual loans, renegotiated loans and consumer
loans on which accrual of interest has been suspended.
(2) Interest revenue in offices outside the U.S. may reflect prevailing local
interest rates, including the effects of inflation and monetary correction
in certain countries.
90
LIQUIDITY RISK
Overview
Adequate and diverse sources of funding and liquidity are
essential to Citi’s businesses. Funding and liquidity risks arise
from several factors, many of which are mostly or entirely
outside Citi’s control, such as disruptions in the financial
markets, changes in key funding sources, credit spreads,
changes in Citi’s credit ratings and macroeconomic,
geopolitical and other conditions. For additional information,
see “Risk Factors—Liquidity Risks” above.
Citi’s funding and liquidity management objectives are
aimed at (i) funding its existing asset base, (ii) growing its
core businesses, (iii) maintaining sufficient liquidity,
structured appropriately, so that Citi can operate under a
variety of adverse circumstances, including potential
Company-specific and/or market liquidity events in varying
durations and severity, and (iv) satisfying regulatory
requirements, including, among other things, those related to
resolution planning (for additional information, see
“Resolution Plan” and “Total Loss-Absorbing Capacity
(TLAC)” below). Citigroup’s primary liquidity objectives are
established by entity, and in aggregate, across two major
categories:
• Citibank (including Citibank Europe plc, Citibank
Singapore Ltd. and Citibank (Hong Kong) Ltd.); and
• Citi’s non-bank and other entities, including the parent
holding company (Citigroup Inc.), Citi’s primary
intermediate holding company (Citicorp LLC), Citi’s
broker-dealer subsidiaries (including Citigroup Global
Markets Inc., Citigroup Global Markets Ltd. and
Citigroup Global Markets Japan Inc.) and other bank and
non-bank subsidiaries that are consolidated into Citigroup
(including Citibanamex).
At an aggregate Citigroup level, Citi’s goal is to maintain
sufficient funding in amount and tenor to fully fund customer
assets and to provide an appropriate amount of cash and high-
quality liquid assets (as discussed below), even in times of
stress, in order to meet its payment obligations as they come
due. The liquidity risk management framework provides that
in addition to the aggregate requirements, certain entities be
self-sufficient or net providers of liquidity, including in
conditions established under their designated stress tests.
Citi’s primary sources of funding include (i) deposits via
Citi’s bank subsidiaries, which are Citi’s most stable and
lowest cost source of long-term funding, (ii) long-term debt
(primarily senior and subordinated debt) primarily issued at
the parent and certain bank subsidiaries, and (iii) stockholders’
equity. These sources may be supplemented by short-term
borrowings, primarily in the form of secured funding
transactions.
As referenced above, Citi’s funding and liquidity
framework ensures that the tenor of these funding sources is of
sufficient term in relation to the tenor of its asset base. The
goal of Citi’s asset/liability management is to ensure that there
is sufficient liquidity and tenor in the liability structure relative
to the liquidity profile of the assets. This reduces the risk that
liabilities will become due before assets mature or are
monetized. This excess liquidity is held primarily in the form
of high-quality liquid assets (HQLA), as set forth in the table
below.
Citi’s liquidity is managed via a centralized treasury
model by Treasury, in conjunction with regional and in-
country treasurers with oversight provided by Independent
Risk Management and various Asset & Liability Committees
(ALCOs) at the Citigroup, region, country and business levels.
Pursuant to this approach, Citi’s HQLA is managed with
emphasis on asset-liability management and entity-level
liquidity adequacy throughout Citi.
The Chief Risk Officer and Citi’s CFO co-chair
Citigroup’s ALCO, which includes Citi’s Treasurer and other
senior executives. ALCOs, among other things, set the
strategy of the liquidity portfolio and monitor its performance.
Significant changes to portfolio asset allocations need to be
approved by the ALCOs.
Liquidity Monitoring and Measurement
Stress Testing
Liquidity stress testing is performed for each of Citi’s major
entities, operating subsidiaries and/or countries. Stress testing
and scenario analyses are intended to quantify the potential
impact of an adverse liquidity event on the balance sheet and
liquidity position, and to identify viable funding alternatives
that can be utilized. These scenarios include assumptions
about significant changes in key funding sources, market
triggers (such as credit ratings), potential uses of funding and
macroeconomic, geopolitical and other conditions. These
conditions include expected and stressed market conditions as
well as Company-specific events.
Liquidity stress tests are performed to ascertain potential
mismatches between liquidity sources and uses over a variety
of time horizons and over different stressed conditions. To
monitor the liquidity of an entity, these stress tests and
potential mismatches are calculated with varying frequencies,
with several tests performed daily.
Given the range of potential stresses, Citi maintains
contingency funding plans on a consolidated basis and for
individual entities. These plans specify a wide range of readily
available actions for a variety of adverse market conditions or
idiosyncratic stresses.
91

High-Quality Liquid Assets (HQLA)
Citibank Citi non-bank and other entities Total
In billions of dollars
Dec. 31,
2020
Sept. 30,
2020
Dec. 31,
2019
Dec. 31,
2020
Sept. 30,
2020
Dec. 31,
2019
Dec. 31,
2020
Sept. 30,
2020
Dec. 31,
2019
Available cash $ 304.3 $ 279.3 $ 158.7 $ 2.1 $ 2.0 $ 2.1 $ 306.4 $ 281.3 $ 160.8
U.S. sovereign 77.8 80.6 100.2 64.8 56.0 29.6 142.6 136.6 129.8
U.S. agency/agency MBS 31.8 34.6 56.9 6.5 5.8 4.4 38.3 40.4 61.3
Foreign government debt
(1)
39.6 44.5 66.4 16.2 17.0 16.5 55.8 61.5 82.9
Other investment grade 1.2 1.5 2.4 0.5 0.7 0.5 1.7 2.2 2.8
Total HQLA (AVG) $ 454.7 $ 440.5 $ 384.6 $ 90.1 $ 81.5 $ 53.1 $ 544.8 $ 522.0 $ 437.6
Note: The amounts set forth in the table above are presented on an average basis. For securities, the amounts represent the liquidity value that potentially could be
realized and, therefore, exclude any securities that are encumbered and incorporate any haircuts applicable under the U.S. LCR rule. The table above incorporates
various restrictions that could limit the transferability of liquidity between legal entities, including Section 23A of the Federal Reserve Act.
(1) Foreign government debt includes securities issued or guaranteed by foreign sovereigns, agencies and multilateral development banks. Foreign government debt
securities are held largely to support local liquidity requirements and Citi’s local franchises and principally include government bonds from Japan, Mexico,
Singapore, South Korea and Hong Kong.
The table above includes average amounts of HQLA held at
Citigroup’s operating entities that are eligible for inclusion in
the calculation of Citigroup’s consolidated Liquidity Coverage
ratio (LCR), pursuant to the U.S. LCR rules. These amounts
include the HQLA needed to meet the minimum requirements
at these entities and any amounts in excess of these minimums
that are assumed to be transferable to other entities within
Citigroup.
Citigroup’s HQLA increased quarter-over-quarter as of
the fourth quarter of 2020, primarily reflecting an increase in
average long-term non-bank debt. While deposit growth and a
decline in loans increased liquidity at Citibank, a significant
amount of this liquidity was assumed not to be transferable to
other entities within Citigroup and therefore not included in
Citi’s consolidated HQLA.
As of December 31, 2020, Citigroup had $972 billion of
available liquidity resources to support client and business
needs, including end-of-period HQLA assets; additional
unencumbered securities, including excess liquidity held at
bank entities that is non-transferable to other entities within
Citigroup; and available assets not already accounted for
within Citi’s HQLA to support Federal Home Loan Bank
(FHLB) and Federal Reserve Bank discount window
borrowing capacity.
Short-Term Liquidity Measurement: Liquidity Coverage
Ratio (LCR)
In addition to internal 30-day liquidity stress testing performed
for Citi’s major entities, operating subsidiaries and countries,
Citi also monitors its liquidity by reference to the LCR.
Generally, the LCR is designed to ensure that banks
maintain an adequate level of HQLA to meet liquidity needs
under an acute 30-day stress scenario. The LCR is calculated
by dividing HQLA by estimated net outflows over a stressed
30-day period, with the net outflows determined by applying
prescribed outflow factors to various categories of liabilities,
such as deposits, unsecured and secured wholesale
borrowings, unused lending commitments and derivatives-
related exposures, partially offset by inflows from assets
maturing within 30 days. Banks are required to calculate an
add-on to address potential maturity mismatches between
contractual cash outflows and inflows within the 30-day
period in determining the total amount of net outflows. The
minimum LCR requirement is 100%.
The table below details the components of Citi’s LCR
calculation and HQLA in excess of net outflows for the
periods indicated:
In billions of dollars
Dec. 31,
2020
Sept. 30,
2020
Dec. 31,
2019
HQLA $ 544.8 $ 522.0 $ 437.6
Net outflows 460.7 442.6 382.0
LCR 118 % 118 % 115 %
HQLA in excess of net outflows
$ 84.1 $ 79.4 $ 55.6
Note: The amounts are presented on an average basis.
As of December 31, 2020, Citi’s average LCR was
unchanged sequentially, as Citi’s average HQLA and net
outflows increased proportionately.
92

Long-Term Liquidity Measurement: Net Stable Funding
Ratio (NSFR)
On October 20, 2020, the U.S. banking agencies adopted a
final rule to assess the availability of a bank’s stable funding
against a required level. The intended purpose of the final rule
is to support the ability of financial institutions to provide
financial intermediation to businesses and households across a
range of market conditions and reduce the possibility of
funding shocks compromising a financial institution’s liquidity
position.
In general, a bank’s available stable funding will include
portions of equity, deposits and long-term debt, while its
required stable funding will be based on the liquidity
characteristics of its assets, derivatives and commitments.
Standardized weightings will be required to be applied to the
various asset and liabilities classes. The ratio of available
stable funding to required stable funding will be required to be
greater than 100%.
The final rule becomes effective beginning July 1, 2021
while public disclosure requirements to report the ratio will
occur on a semi-annual basis beginning June 30, 2023. Citi
expects to be in compliance with the final rule when the rule is
effective.
Loans
As part of its funding and liquidity objectives, Citi seeks to
fund its existing asset base appropriately as well as maintain
sufficient liquidity to grow its GCB and ICG businesses,
including its loan portfolio. Citi maintains a diversified
portfolio of loans to its consumer and institutional clients. The
table below details the average loans, by business and/or
segment, and the total end-of-period loans for each of the
periods indicated:
In billions of dollars
Dec. 31,
2020
Sept. 30,
2020
Dec. 31,
2019
Global Consumer Banking
North America $ 179.4 $ 179.1 $ 192.7
Latin America 14.3 13.6 17.4
Asia
(1)
82.4 79.7 80.9
Total $ 276.1 $ 272.4 $ 291.0
Institutional Clients Group
Corporate lending $ 146.2 $ 166.1 $ 154.2
Treasury and trade solutions
(TTS) 67.1 67.1 74.5
Private bank 113.3 110.3 106.6
Markets and securities services
and other 56.1 53.1 56.0
Total $ 382.7 $ 396.6 $ 391.3
Total Corporate/Other $ 7.4 $ 8.2 $ 10.3
Total Citigroup loans (AVG) $ 666.2 $ 677.2 $ 692.6
Total Citigroup loans (EOP) $ 676.1 $ 666.9 $ 699.5
(1) Includes loans in certain EMEA countries for all periods presented.
As of the fourth quarter of 2020, end-of period loans
declined 3% year-over-year and increased 1% quarter-over-
quarter.
On an average basis, loans declined 4% year-over-year
and 2% quarter-over-quarter. Excluding the impact of FX
translation, average loans also declined 4% year-over-year and
2% sequentially. On this basis, average GCB loans declined
6% year-over-year, primarily reflecting the impact of lower
consumer spending in Citi’s cards businesses and higher
payments by customers given high levels of liquidity due to
fiscal stimulus.
Excluding the impact of FX translation, average ICG
loans declined 3% year-over-year. Treasury and trade
solutions (TTS) loans declined 10% year-over-year, reflecting
softness in underlying trade flows and the continued low level
of spend in commercial cards driven by the impact of the
pandemic. Average corporate lending loans declined 6%,
reflecting net repayments as Citi continued to assist its clients
in accessing the capital markets, as well as lower loan demand
given more muted economic activity. Average private bank
loans increased 6%, largely driven by secured lending to high-
net-worth clients, including residential real estate lending.
Average Corporate/Other loans continued to decline
(down 29%), driven by the wind-down of legacy assets.
Deposits
The table below details the average deposits, by business and/
or segment, and the total end-of-period deposits for each of the
periods indicated:
In billions of dollars
Dec. 31,
2020
Sept. 30,
2020
Dec. 31,
2019
Global Consumer Banking
(1)
North America $ 188.9 $ 182.1 $ 156.2
Latin America 24.3 22.5 23.0
Asia
(2)
120.0 115.2 103.4
Total $ 333.2 $ 319.8 $ 282.6
Institutional Clients Group
Treasury and trade solutions
(TTS) $ 686.5 $ 678.6 $ 558.7
Banking ex-TTS 163.2 150.1 140.7
Markets and securities services 109.3 107.9 95.0
Total $ 959.0 $ 936.6 $ 794.4
Corporate/Other $ 13.1 $ 11.4 $ 12.5
Total Citigroup deposits (AVG) $ 1,305.3 $ 1,267.8 $ 1,089.5
Total Citigroup deposits (EOP) $ 1,280.7 $ 1,262.6 $ 1,070.6
(1) Reflects deposits within retail banking.
(2) Includes deposits in certain EMEA countries for all periods presented.
End-of-period deposits increased 20% year-over-year and
1% sequentially.
As of the fourth quarter of 2020, on an average basis,
deposits increased 20% year-over-year and 3% sequentially.
Excluding the impact of FX translation, average deposits grew
19% from the prior-year period and 2% sequentially,
reflecting continued client engagement as well as the elevated
level of liquidity in the financial system. On this basis, average
deposits in GCB increased 18%, with strong growth across all
regions.
Excluding the impact of FX translation, average deposits
in ICG grew 20% year-over-year, primarily driven by 22%
93
growth in TTS, as well as continued growth in the private
bank and securities services.
Long-Term Debt
Long-term debt (generally defined as debt with original
maturities of one year or more) represents the most significant
component of Citi’s funding for the Citigroup parent company
and Citi’s non-bank subsidiaries and is a supplementary source
of funding for the bank entities.
Long-term debt is an important funding source due in part
to its multiyear contractual maturity structure. The weighted-
average maturity of unsecured long-term debt issued by
Citigroup and its affiliates (including Citibank) with a
remaining life greater than one year was approximately
8.6 years as of December 31, 2020, unchanged from
September 30, 2020 and an increase from the prior year. The
weighted-average maturity is calculated based on the
contractual maturity of each security. For securities that are
redeemable prior to maturity at the option of the holder, the
weighted-average maturity is calculated based on the earliest
date an option becomes exercisable.
Citi’s long-term debt outstanding at the Citigroup parent
company includes benchmark senior and subordinated debt
and what Citi refers to as customer-related debt, consisting of
structured notes, such as equity- and credit-linked notes, as
well as non-structured notes. Citi’s issuance of customer-
related debt is generally driven by customer demand and
complements benchmark debt issuance as a source of funding
for Citi’s non-bank entities. Citi’s long-term debt at the bank
includes bank notes, FHLB advances and securitizations.
Long-Term Debt Outstanding
The following table sets forth Citi’s end-of-period total long-
term debt outstanding for each of the dates indicated:
In billions of dollars
Dec. 31,
2020
Sept. 30,
2020
Dec. 31,
2019
Non-bank
(1)
Benchmark debt:
Senior debt $ 126.2 $ 126.3 $ 106.6
Subordinated debt 27.1 27.4 25.5
Trust preferred 1.7 1.7 1.7
Customer-related debt 65.2 61.0 53.8
Local country and other
(2)
6.7 8.1 7.9
Total non-bank $ 226.9 $ 224.5 $ 195.5
Bank
FHLB borrowings $ 10.9 $ 14.7 $ 5.5
Securitizations
(3)
16.6 16.4 20.7
Citibank benchmark senior debt 13.6 14.2 23.1
Local country and other
(2)
3.7 3.5 4.0
Total bank $ 44.8 $ 48.8 $ 53.3
Total long-term debt $ 271.7 $ 273.3 $ 248.8
Note: Amounts represent the current value of long-term debt on Citi’s
Consolidated Balance Sheet that, for certain debt instruments, includes
consideration of fair value, hedging impacts and unamortized discounts and
premiums.
(1) Non-bank includes long-term debt issued to third parties by the parent
holding company (Citigroup) and Citi’s non-bank subsidiaries (including
broker-dealer subsidiaries) that are consolidated into Citigroup. As of
December 31, 2020, non-bank included $56.4 billion of long-term debt
issued by Citi’s broker-dealer and other subsidiaries, as well as certain
Citigroup consolidated hedging activities.
(2) Local country and other includes debt issued by Citi’s affiliates in
support of their local operations. Within non-bank, certain secured
financing is also included. Within bank, borrowings under certain U.S.
government-sponsored liquidity programs are also included.
(3) Predominantly credit card securitizations, primarily backed by Citi-
branded credit card receivables.
As of the fourth quarter of 2020, Citi’s total long-term
debt outstanding increased year-over-year, primarily driven by
the issuance of unsecured benchmark senior debt and
customer-related debt at the non-bank entities, as well as an
increase in FHLB borrowings at the bank, partially offset by
declines in unsecured benchmark senior debt and
securitizations at the bank. Sequentially, long-term debt
outstanding decreased, driven primarily by a decline in FHLB
borrowings at the bank and local country and other debt at the
non-bank, partially offset by higher customer-related debt at
the non-bank.
As part of its liability management, Citi has considered,
and may continue to consider, opportunities to redeem or
repurchase its long-term debt pursuant to open market
purchases, tender offers or other means. Such redemptions and
repurchases help reduce Citi’s overall funding costs. During
2020, Citi redeemed or repurchased $28.9 billion of its
outstanding long-term debt.
94

Long-Term Debt Issuances and Maturities
The table below details Citi’s long-term debt issuances and maturities (including repurchases and redemptions) during the periods
presented:
2020 2019 2018
In billions of dollars
Maturities Issuances Maturities Issuances Maturities Issuances
Non-bank
Benchmark debt:
Senior debt $ 6.5 $ 20.4 $ 16.5 $ 16.2 $ 18.5 $ 14.8
Subordinated debt — — — — 2.9 0.6
Trust preferred — — — — — —
Customer-related debt 27.7 36.8 12.7 25.1 6.6 16.9
Local country and other 2.4 1.4 1.1 5.4 1.2 2.3
Total non-bank $ 36.6 $ 58.6 $ 30.3 $ 46.7 $ 29.2 $ 34.6
Bank
FHLB borrowings $ 7.5 $ 12.9 $ 7.1 $ 2.1 $ 15.8 $ 7.9
Securitizations 4.6 0.3 7.9 0.1 8.6 6.8
Citibank benchmark senior debt 9.8 — 4.8 8.8 2.3 8.5
Local country and other 4.9 4.6 0.9 1.4 2.2 2.9
Total bank $ 26.8 $ 17.8 $ 20.7 $ 12.4 $ 28.9 $ 26.1
Total $ 63.4 $ 76.4 $ 51.0 $ 59.1 $ 58.1 $ 60.7
The table below shows Citi’s aggregate long-term debt maturities (including repurchases and redemptions) in 2020, as well as its
aggregate expected remaining long-term debt maturities by year as of December 31, 2020:
Maturities
In billions of dollars
2020 2021 2022 2023 2024 2025 Thereafter Total
Non-bank
Benchmark debt:
Senior debt $ 6.5 $ 14.7 $ 11.5 $ 13.0 $ 11.3 $ 7.7 $ 67.9 $ 126.2
Subordinated debt — — 0.8 1.3 1.1 5.3 18.6 27.1
Trust preferred — — — — — — 1.7 1.7
Customer-related debt 27.7 8.4 8.5 6.8 4.0 5.4 32.1 65.2
Local country and other 2.4 1.6 1.3 2.2 — — 1.6 6.7
Total non-bank $ 36.6 $ 24.7 $ 22.1 $ 23.3 $ 16.4 $ 18.4 $ 121.9 $ 226.9
Bank
FHLB borrowings $ 7.5 $ 5.7 $ 5.3 $ — $ — $ — $ — $ 10.9
Securitizations 4.6 7.2 2.1 2.4 1.1 0.4 3.3 16.6
Citibank benchmark senior debt 9.8 5.1 5.7 — 2.8 — — 13.6
Local country and other 4.9 0.6 1.5 0.3 0.7 0.1 0.5 3.7
Total bank $ 26.8 $ 18.6 $ 14.6 $ 2.7 $ 4.6 $ 0.5 $ 3.8 $ 44.8
Total long-term debt $ 63.4 $ 43.3 $ 36.7 $ 26.0 $ 21.0 $ 18.9 $ 125.7 $ 271.7
95
Resolution Plan
Citi is required under Title I of the Dodd-Frank Wall Street
Reform and Consumer Protection Act of 2010 (Dodd-Frank
Act) and the rules promulgated by the FDIC and FRB to
periodically submit a plan for Citi’s rapid and orderly
resolution under the U.S. Bankruptcy Code in the event of
material financial distress or failure. For additional
information on Citi’s resolution plan submissions, see “Risk
Factors—Strategic Risks” above. Citigroup’s preferred
resolution strategy is “single point of entry” under the U.S.
Bankruptcy Code.
Under Citi’s preferred “single point of entry” resolution
plan strategy, only Citigroup, the parent holding company,
would enter into bankruptcy, while Citigroup’s material legal
entities (as defined in the public section of its 2019 resolution
plan, which can be found on the FRB’s and FDIC’s websites)
would remain operational outside of any resolution or
insolvency proceedings. Citigroup’s resolution plan has been
designed to minimize the risk of systemic impact to the U.S.
and global financial systems, while maximizing the value of
the bankruptcy estate for the benefit of Citigroup’s creditors,
including its unsecured long-term debt holders.
In addition, in line with the Federal Reserve’s final total
loss-absorbing capacity (TLAC) rule, Citigroup believes it has
developed the resolution plan so that Citigroup’s shareholders
and unsecured creditors—including its unsecured long-term
debt holders—bear any losses resulting from Citigroup’s
bankruptcy. Accordingly, any value realized by holders of its
unsecured long-term debt may not be sufficient to repay the
amounts owed to such debt holders in the event of a
bankruptcy or other resolution proceeding of Citigroup.
The FDIC has also indicated that it was developing a
single point of entry strategy to implement the Orderly
Liquidation Authority under Title II of the Dodd-Frank Act,
which provides the FDIC with the ability to resolve a firm
when it is determined that bankruptcy would have serious
adverse effects on financial stability in the U.S.
As previously disclosed, in response to feedback received
from the Federal Reserve and FDIC, Citigroup took the
following actions:
(i) Citicorp LLC (Citicorp), an existing wholly owned
subsidiary of Citigroup, was established as an
intermediate holding company (an IHC) for certain of
Citigroup’s operating material legal entities;
(ii) Citigroup executed an inter-affiliate agreement with
Citicorp, Citigroup’s operating material legal entities
and certain other affiliated entities pursuant to which
Citicorp is required to provide liquidity and capital
support to Citigroup’s operating material legal entities
in the event Citigroup were to enter bankruptcy
proceedings (Citi Support Agreement);
(iii) pursuant to the Citi Support Agreement:
• Citigroup made an initial contribution of assets,
including certain high-quality liquid assets and
inter-affiliate loans (Contributable Assets), to
Citicorp, and Citicorp became the business-as-
usual funding vehicle for Citigroup’s operating
material legal entities;
• Citigroup will be obligated to continue to transfer
Contributable Assets to Citicorp over time, subject
to certain amounts retained by Citigroup to, among
other things, meet Citigroup’s near-term cash
needs;
• in the event of a Citigroup bankruptcy, Citigroup
will be required to contribute most of its remaining
assets to Citicorp; and
(iv) the obligations of both Citigroup and Citicorp under the
Citi Support Agreement, as well as the Contributable
Assets, are secured pursuant to a security agreement.
The Citi Support Agreement provides two mechanisms,
besides Citicorp’s issuing of dividends to Citigroup, pursuant
to which Citicorp will be required to transfer cash to Citigroup
during business as usual so that Citigroup can fund its debt
service as well as other operating needs: (i) one or more
funding notes issued by Citicorp to Citigroup and (ii) a
committed line of credit under which Citicorp may make loans
to Citigroup.
On December 17, 2019, the FRB and FDIC issued
feedback on the resolution plans filed on July 1, 2019 by the
eight U.S. GSIBs, including Citi. The FRB and FDIC
identified one shortcoming, but no deficiencies, in Citi’s
resolution plan relating to governance mechanisms. On July 1,
2020, the FRB and FDIC provided information to the eight
largest domestic banking organizations, including Citi,
required to be included in the targeted resolution plans due on
July 1, 2021.
Total Loss-Absorbing Capacity (TLAC)
U.S. GSIBs are required to maintain minimum levels of TLAC
and eligible LTD, each set by reference to the GSIB’s
consolidated risk-weighted assets (RWA) and total leverage
exposure. The intended purpose of the requirements is to
facilitate the orderly resolution of U.S. GSIBs under the U.S.
Bankruptcy Code and Title II of the Dodd-Frank Act. For
additional information, including Citi’s TLAC and LTD
amounts and ratios, see “Capital Resources—Current
Regulatory Capital Standards” and “Risk Factors—
Compliance Risks” above.
96

SECURED FUNDING TRANSACTIONS AND SHORT-
TERM BORROWINGS
Citi supplements its primary sources of funding with short-
term financings that generally include (i) secured funding
transactions consisting of securities loaned or sold under
agreements to repurchase, i.e., repos, and (ii) to a lesser extent,
short-term borrowings consisting of commercial paper and
borrowings from the FHLB and other market participants.
Secured Funding Transactions
Secured funding is primarily accessed through Citi’s broker-
dealer subsidiaries to fund efficiently both (i) secured lending
activity and (ii) a portion of the securities inventory held in the
context of market making and customer activities. Citi also
executes a smaller portion of its secured funding transactions
through its bank entities, which are typically collateralized by
government debt securities. Generally, daily changes in the
level of Citi’s secured funding are primarily due to
fluctuations in secured lending activity in the matched book
(as described below) and securities inventory.
Secured funding of $200 billion as of December 31, 2020
increased 20% from the prior year and declined 4% from the
prior quarter. Excluding the impact of FX translation, secured
funding decreased 16% from the prior year and declined 7%
sequentially, both driven by normal business activity. Average
balances for secured funding were $227 billion for the quarter
ended December 31, 2020.
The portion of secured funding in the broker-dealer
subsidiaries that funds secured lending is commonly referred
to as “matched book” activity. The majority of this activity is
secured by high-quality liquid securities such as U.S. Treasury
securities, U.S. agency securities and foreign government debt
securities. Other secured funding is secured by less liquid
securities, including equity securities, corporate bonds and
asset-backed securities, the tenor of which is generally equal
to or longer than the tenor of the corresponding matched book
assets.
The remainder of the secured funding activity in the
broker-dealer subsidiaries serves to fund securities inventory
held in the context of market making and customer activities.
To maintain reliable funding under a wide range of market
conditions, including under periods of stress, Citi manages
these activities by taking into consideration the quality of the
underlying collateral and establishing minimum required
funding tenors. The weighted average maturity of Citi’s
secured funding of less liquid securities inventory was greater
than 110 days as of December 31, 2020.
Citi manages the risks in its secured funding by
conducting daily stress tests to account for changes in
capacity, tenor, haircut, collateral profile and client actions. In
addition, Citi maintains counterparty diversification by
establishing concentration triggers and assessing counterparty
reliability and stability under stress. Citi generally sources
secured funding from more than 150 counterparties.
Short-Term Borrowings
Citi’s short-term borrowings of $30 billion as of the fourth
quarter of 2020 decreased 34% year-over-year and 21%
sequentially, primarily driven by a decline in FHLB advances
(see Note 17 to the Consolidated Financial Statements for
further information on Citigroup’s and its affiliates’
outstanding short-term borrowings).
Overall Short-Term Borrowings
The following table contains the year-end, average and maximum month-end amounts for the following respective short-term
borrowings categories at the end of each of the three prior years:
Securities sold under
agreements to repurchase Other borrowings
(1)(2)
In billions of dollars
2020 2019 2018 2020 2019 2018
Amounts outstanding at year end $ 199.5 $ 166.3 $ 177.8 $ 80.0 $ 93.7 $ 96.9
Average outstanding during the year
(3)(4)(5)
216.8 190.2 172.1 102.4 98.8 108.4
Maximum month-end outstanding 225.3 196.8 191.2 129.3 112.3 113.5
Weighted average interest rate during the year
(3)(4)(5)(6)
0.96 % 3.29 % 2.84 % 0.62 % 2.49 % 2.04 %
(1) Original maturities of less than one year.
(2) Other borrowings include commercial paper, brokerage payables and borrowings from the FHLB and other market participants. See “Average Balances and
Interest Rates” below.
(3) Interest rates and amounts include the effects of risk management activities associated with the respective liability categories.
(4) Average volumes of securities sold under agreements to repurchase are reported net pursuant to ASC 210-20-45; average rates exclude the impact of ASC
210-20-45.
(5) Monthly or quarterly averages have been used by certain subsidiaries where daily averages are unavailable.
(6) Average rates reflect prevailing local interest rates, including inflationary effects and monetary correction in certain countries.
97

CREDIT RATINGS
Citigroup’s funding and liquidity, funding capacity, ability to
access capital markets and other sources of funds, the cost of
these funds and its ability to maintain certain deposits are
partially dependent on its credit ratings.
The table below shows the ratings for Citigroup and
Citibank as of December 31, 2020. While not included in the
table below, the long-term and short-term ratings of Citigroup
Global Markets Holding Inc. (CGMHI) were BBB+/A-2 at
Standard & Poor’s and A/F1 at Fitch as of December 31,
2020.
Ratings as of December 31, 2020
Citigroup Inc. Citibank, N.A.
Senior
debt
Commercial
paper Outlook
Long-
term
Short-
term Outlook
Fitch Ratings (Fitch) A F1 Negative A+ F1 Negative
Moody’s Investors Service (Moody’s) A3 P-2 Stable Aa3 P-1 Stable
Standard & Poor’s (S&P)
BBB+ A-2 Stable A+ A-1 Stable
Potential Impacts of Ratings Downgrades
Ratings downgrades by Moody’s, Fitch or S&P could
negatively impact Citigroup’s and/or Citibank’s funding and
liquidity due to reduced funding capacity, including derivative
triggers, which could take the form of cash obligations and
collateral requirements.
The following information is provided for the purpose of
analyzing the potential funding and liquidity impact to
Citigroup and Citibank of a hypothetical simultaneous
ratings downgrade across all three major rating agencies. This
analysis is subject to certain estimates, estimation
methodologies, judgments and uncertainties. Uncertainties
include potential ratings limitations that certain entities may
have with respect to permissible counterparties, as well as
general subjective counterparty behavior. For example, certain
corporate customers and markets counterparties could re-
evaluate their business relationships with Citi and limit
transactions in certain contracts or market instruments with
Citi. Changes in counterparty behavior could impact Citi’s
funding and liquidity, as well as the results of operations of
certain of its businesses. The actual impact to Citigroup or
Citibank is unpredictable and may differ materially from the
potential funding and liquidity impacts described below. For
additional information on the impact of credit rating changes
on Citi and its applicable subsidiaries, see “Risk Factors—
Liquidity Risks” above.
Citigroup Inc. and Citibank—Potential Derivative Triggers
As of December 31, 2020, Citi estimates that a hypothetical
one-notch downgrade of the senior debt/long-term rating of
Citigroup Inc. across all three major rating agencies could
impact Citigroup’s funding and liquidity due to derivative
triggers by approximately $0.6 billion, unchanged from
September 30, 2020. Other funding sources, such as secured
financing transactions and other margin requirements, for
which there are no explicit triggers, could also be adversely
affected.
As of December 31, 2020, Citi estimates that a
hypothetical one-notch downgrade of the senior debt/long-
term rating of Citibank across all three major rating agencies
could impact Citibank’s funding and liquidity due to
derivative triggers by approximately $0.4 billion, unchanged
from September 30, 2020. Other funding sources, such as
secured financing transactions and other margin requirements,
for which there are no explicit triggers, could also be
adversely affected.
In total, as of December 31, 2020, Citi estimates that a
one-notch downgrade of Citigroup and Citibank across all
three major rating agencies could result in increased aggregate
cash obligations and collateral requirements of approximately
$1.0 billion, unchanged from September 30, 2020 (see also
Note 22 to the Consolidated Financial Statements). As detailed
under “High-Quality Liquid Assets” above, Citigroup has
various liquidity resources available to its bank and non-bank
entities in part as a contingency for the potential events
described above.
In addition, a broad range of mitigating actions are
currently included in Citigroup’s and Citibank’s contingency
funding plans. For Citigroup, these mitigating factors include,
but are not limited to, accessing surplus funding capacity from
existing clients, tailoring levels of secured lending and
adjusting the size of select trading books and collateralized
borrowings at certain Citibank subsidiaries. Mitigating actions
available to Citibank include, but are not limited to, selling or
financing highly liquid government securities, tailoring levels
of secured lending, adjusting the size of select trading assets,
reducing loan originations and renewals, raising additional
deposits or borrowing from the FHLB or central banks. Citi
believes these mitigating actions could substantially reduce the
funding and liquidity risk, if any, of the potential downgrades
described above.
98

Citibank—Additional Potential Impacts
In addition to the above derivative triggers, Citi believes that a
potential downgrade of Citibank’s senior debt/long-term rating
across any of the three major rating agencies could also have
an adverse impact on the commercial paper/short-term rating
of Citibank. Citibank has provided liquidity commitments to
consolidated asset-backed commercial paper conduits,
primarily in the form of asset purchase agreements. As of
December 31, 2020, Citibank had liquidity commitments of
approximately $10.0 billion to consolidated asset-backed
commercial paper conduits, compared to $11.4 billion as of
September 30, 2020 (for additional information, see Note 21
to the Consolidated Financial Statements).
In addition to the above-referenced liquidity resources of
certain Citibank entities, Citibank could reduce the funding
and liquidity risk, if any, of the potential downgrades
described above through mitigating actions, including
repricing or reducing certain commitments to commercial
paper conduits. In the event of the potential downgrades
described above, Citi believes that certain corporate customers
could re-evaluate their deposit relationships with Citibank.
This re-evaluation could result in clients adjusting their
discretionary deposit levels or changing their depository
institution, which could potentially reduce certain deposit
levels at Citibank. However, Citi could choose to adjust
pricing, offer alternative deposit products to its existing
customers or seek to attract deposits from new customers, in
addition to the mitigating actions referenced above.
99
MARKET RISK
OVERVIEW
Market risk is the potential for losses arising from changes in
the value of Citi’s assets and liabilities resulting from changes
in market variables such as interest rates, foreign exchange
rates, equity prices, commodity prices and credit spreads, as
well as their implied volatilities. Market risk emanates from
both Citi’s trading and non-trading portfolios. For additional
information on market risk and market risk management, see
“Risk Factors” above.
Each business is required to establish, with approval from
Citi’s market risk management, a market risk limit framework
for identified risk factors that clearly defines approved risk
profiles and is within the parameters of Citi’s overall risk
appetite. These limits are monitored by the Risk organization,
including various regional, legal entity and business Risk
Management committees, Citi’s country and business Asset &
Liability Committees and the Citigroup Risk Management and
Asset & Liability Committees. In all cases, the businesses are
ultimately responsible for the market risks taken and for
remaining within their defined limits.
MARKET RISK OF NON-TRADING PORTFOLIOS
Market risk from non-trading portfolios stems from the
potential impact of changes in interest rates and foreign
exchange rates on Citi’s net interest revenues, the changes in
Accumulated other comprehensive income (loss) (AOCI) from
its debt securities portfolios and capital invested in foreign
currencies.
Net Interest Revenue at Risk
Net interest revenue, for interest rate exposure purposes, is the
difference between the yield earned on the non-trading
portfolio assets (including customer loans) and the rate paid on
the liabilities (including customer deposits or company
borrowings). Net interest revenue is affected by changes in the
level of interest rates, as well as the amounts and mix of assets
and liabilities, and the timing of contractual and assumed
repricing of assets and liabilities to reflect market rates.
Citi’s principal measure of risk to net interest revenue is
interest rate exposure (IRE). IRE measures the change in
expected net interest revenue in each currency resulting solely
from unanticipated changes in forward interest rates.
Citi’s estimated IRE incorporates various assumptions
including prepayment rates on loans, customer behavior and
the impact of pricing decisions. For example, in rising interest
rate scenarios, portions of the deposit portfolio may be
assumed to experience rate increases that are less than the
change in market interest rates. In declining interest rate
scenarios, it is assumed that mortgage portfolios experience
higher prepayment rates. Citi’s estimated IRE below assumes
that its businesses and/or Citi Treasury make no additional
changes in balances or positioning in response to the
unanticipated rate changes.
In order to manage changes in interest rates effectively,
Citi may modify pricing on new customer loans and deposits,
purchase fixed-rate securities, issue debt that is either fixed or
floating or enter into derivative transactions that have the
opposite risk exposures. Citi regularly assesses the viability of
these and other strategies to reduce its interest rate risks and
implements such strategies when it believes those actions are
prudent.
Citi manages interest rate risk as a consolidated
Company-wide position. Citi’s client-facing businesses create
interest rate-sensitive positions, including loans and deposits,
as part of their ongoing activities. Citi Treasury aggregates
these risk positions and manages them centrally. Operating
within established limits, Citi Treasury makes positioning
decisions and uses tools, such as Citi’s investment securities
portfolio, company-issued debt and interest rate derivatives, to
target the desired risk profile. Changes in Citi’s interest rate
risk position reflect the accumulated changes in all non-trading
assets and liabilities, with potentially large and offsetting
impacts, as well as in Citi Treasury’s positioning decisions.
Citigroup employs additional measurements, including
stress testing the impact of non-linear interest rate movements
on the value of the balance sheet, and the analysis of portfolio
duration and volatility, particularly as they relate to mortgage
loans and mortgage-backed securities and the potential impact
of the change in the spread between different market indices.
Interest Rate Risk of Investment Portfolios—Impact
on AOCI
Citi also measures the potential impacts of changes in interest
rates on the value of its AOCI, which can in turn impact Citi’s
common equity and tangible common equity. This will impact
Citi’s Common Equity Tier 1 and other regulatory capital
ratios. Citi’s goal is to benefit from an increase in the market
level of interest rates, while limiting the impact of changes in
AOCI on its regulatory capital position.
AOCI at risk is managed as part of the Company-wide
interest rate risk position. AOCI at risk considers potential
changes in AOCI (and the corresponding impact on the
Common Equity Tier 1 Capital ratio) relative to Citi’s capital
generation capacity.
100

The following table sets forth the estimated impact to Citi’s net interest revenue, AOCI and the Common Equity Tier 1 Capital ratio
(on a fully implemented basis), each assuming an unanticipated parallel instantaneous 100 basis point (bps) increase in interest rates:
In millions of dollars, except as otherwise noted
Dec. 31, 2020 Sept. 30, 2020 Dec. 31, 2019
Estimated annualized impact to net interest revenue
U.S. dollar
(1)
$ 373 $ 65 $ 20
All other currencies 683 702 606
Total $ 1,056 $ 767 $ 626
As a percentage of average interest-earning assets 0.05 % 0.04 % 0.03 %
Estimated initial negative impact to AOCI (after-tax)
(2)
$ (5,645) $ (5,757) $ (5,002)
Estimated initial impact on Common Equity Tier 1 Capital ratio (bps) (34) (36) (31)
(1) Certain trading-oriented businesses within Citi have accrual-accounted positions that are excluded from the estimated impact to net interest revenue in the table,
since these exposures are managed economically in combination with mark-to-market positions. The U.S. dollar interest rate exposure associated with these
businesses was $(89) million for a 100 bps instantaneous increase in interest rates as of December 31, 2020.
(2) Includes the effect of changes in interest rates on AOCI related to investment securities, cash flow hedges and pension liability adjustments.
The year-over-year increase in the estimated impact to net
interest revenue primarily reflected changes in Citi’s balance
sheet composition and Citi Treasury positioning. The year-
over-year changes in the estimated impact to AOCI and the
Common Equity Tier 1 Capital ratio primarily reflected the
impact of the composition of Citi Treasury’s investment and
derivatives portfolio.
In the event of a parallel instantaneous 100 bps increase in
interest rates, Citi expects that the negative impact to AOCI
would be offset in shareholders’ equity through the expected
recovery of the impact on AOCI through accretion of Citi’s
investment portfolio over a period of time. As of
December 31, 2020, Citi expects that the negative $5.6 billion
impact to AOCI in such a scenario could potentially be offset
over approximately 31 months.
The following table sets forth the estimated impact to
Citi’s net interest revenue, AOCI and the Common Equity
Tier 1 Capital ratio (on a fully implemented basis) under five
different changes in interest rate scenarios for the U.S. dollar
and Citi’s other currencies. The 100 bps downward rate
scenarios are impacted by the low level of interest rates in
several countries and the assumption that market interest rates,
as well as rates paid to depositors and charged to borrowers,
do not fall below zero (i.e., the “flooring assumption”). The
rate scenarios are also impacted by convexity related to
mortgage products.
In addition, in the table below, the magnitude of the
impact to Citi’s net interest revenue and AOCI is greater under
Scenario 2 as compared to Scenario 3. This is because the
combination of changes to Citi’s investment portfolio,
partially offset by changes related to Citi’s pension liabilities,
results in a net position that is more sensitive to rates at
shorter- and intermediate-term maturities.
In millions of dollars, except as otherwise noted
Scenario 1 Scenario 2 Scenario 3 Scenario 4 Scenario 5
Overnight rate change (bps) 100 100 — — (100)
10-year rate change (bps) 100 — 100 (100) (100)
Estimated annualized impact to net interest revenue
U.S. dollar $ 373 $ 348 $ 141 $ (113) $ (217)
All other currencies 683 489 42 (42) (342)
Total $ 1,056 $ 837 $ 183 $ (155) $ (559)
Estimated initial impact to AOCI (after-tax)
(1)
$ (5,645) $ (3,837) $ (1,987) $ 1,391 $ 2,472
Estimated initial impact to Common Equity Tier 1 Capital ratio (bps) (34) (24) (12) 7 9
Note: Each scenario assumes that the rate change will occur instantaneously. Changes in interest rates for maturities between the overnight rate and the 10-year rate are
interpolated.
(1) Includes the effect of changes in interest rates on AOCI related to investment securities, cash flow hedges and pension liability adjustments.
101

Changes in Foreign Exchange Rates—Impacts on AOCI
and Capital
As of December 31, 2020, Citi estimates that an unanticipated
parallel instantaneous 5% appreciation of the U.S. dollar
against all of the other currencies in which Citi has invested
capital could reduce Citi’s tangible common equity (TCE) by
approximately $1.7 billion, or 1.0%, as a result of changes to
Citi’s foreign currency translation adjustment in AOCI, net of
hedges. This impact would be primarily due to changes in the
value of the Mexican peso, Euro, Australian dollar and
Singapore dollar.
This impact is also before any mitigating actions Citi may
take, including ongoing management of its foreign currency
translation exposure. Specifically, as currency movements
change the value of Citi’s net investments in foreign currency-
denominated capital, these movements also change the value
of Citi’s risk-weighted assets denominated in those currencies.
This, coupled with Citi’s foreign currency hedging strategies,
such as foreign currency borrowings, foreign currency
forwards and other currency hedging instruments, lessens the
impact of foreign currency movements on Citi’s Common
Equity Tier 1 Capital ratio. Changes in these hedging
strategies, as well as hedging costs, divestitures and tax
impacts, can further affect the actual impact of changes in
foreign exchange rates on Citi’s capital as compared to an
unanticipated parallel shock, as described above.
The effect of Citi’s ongoing management strategies with
respect to changes in foreign exchange rates, and the impact of
these changes on Citi’s TCE and Common Equity Tier 1
Capital ratio, are shown in the table below. For additional
information on the changes in AOCI, see Note 19 to the
Consolidated Financial Statements.
For the quarter ended
In millions of dollars, except as otherwise noted
Dec. 31, 2020 Sept. 30, 2020 Dec. 31, 2019
Change in FX spot rate
(1)
5.5 % 2.6 % 2.8 %
Change in TCE due to FX translation, net of hedges $ 1,829 $ 655 $ 659
As a percentage of TCE 1.2 % 0.4 % 0.4 %
Estimated impact to Common Equity Tier 1 Capital ratio (on a fully implemented basis) due
to changes in FX translation, net of hedges (bps) 2 (1) (3)
(1) FX spot rate change is a weighted average based on Citi’s quarterly average GAAP capital exposure to foreign countries.
102
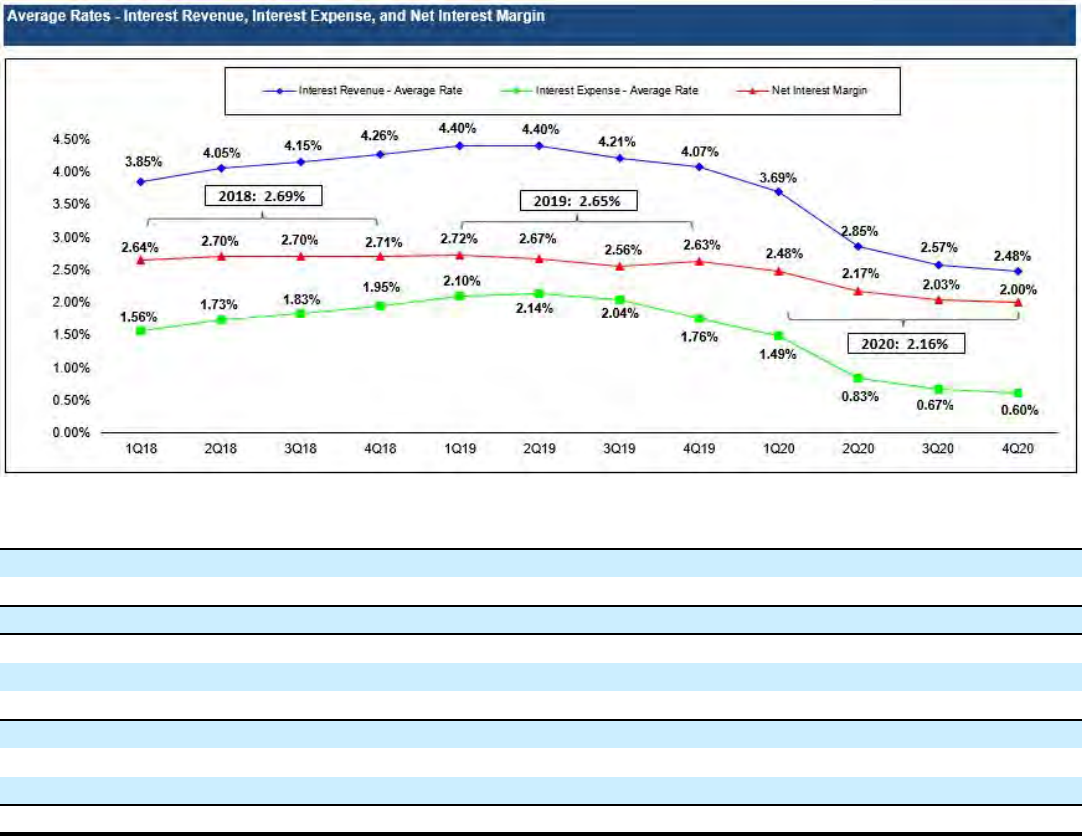
Interest Revenue/Expense and Net Interest Margin (NIM)
In millions of dollars, except as otherwise noted
2020 2019 2018
Change
2020 vs. 2019
Change
2019 vs. 2018
Interest revenue
(1)
$ 58,285 $ 76,718 $ 71,082 (24) % 8 %
Interest expense
(2)
14,541 29,163 24,266 (50) 20
Net interest revenue, taxable equivalent basis $ 43,744 $ 47,555 $ 46,816 (8) % 2 %
Interest revenue—average rate
(3)
2.88 % 4.27 % 4.08 % (139) bps 19 bps
Interest expense—average rate 0.88 2.01 1.77 (113) bps 24 bps
Net interest margin
(3)(4)
2.16 2.65 2.69 (49) bps (4) bps
Interest rate benchmarks
Two-year U.S. Treasury note—average rate 0.39 % 1.97 % 2.53 % (158) bps (56) bps
10-year U.S. Treasury note—average rate 0.89 2.14 2.91 (125) bps (77) bps
10-year vs. two-year spread 50 bps 17 bps 38 bps
Note: All interest expense amounts include FDIC, as well as other similar deposit insurance assessments outside of the U.S.
(1) Net interest revenue includes the taxable equivalent adjustments related to the tax-exempt bond portfolio (based on the U.S. federal statutory tax rate of 21%) of
$196 million, $208 million and $254 for 2020, 2019 and 2018, respectively.
(2) Interest expense associated with certain hybrid financial instruments, which are classified as Long-term debt and accounted for at fair value, is reported together
with any changes in fair value as part of Principal transactions in the Consolidated Statement of Income and is therefore not reflected in Interest expense in the
table above.
(3) The average rate on interest revenue and net interest margin reflects the taxable equivalent gross-up adjustment. See footnote 1 above.
(4) Citi’s net interest margin (NIM) is calculated by dividing net interest revenue by average interest-earning assets.
103

Non-ICG Markets Net Interest Revenue
In millions of dollars
2020 2019 2018
Net interest revenue (NIR)—taxable equivalent basis
(1)
per above $ 43,744 $ 47,555 $ 46,816
ICG Markets NIR—taxable equivalent basis
(1)
5,454 4,372 4,506
Non-ICG Markets NIR—taxable equivalent basis
(1)
$ 38,290 $ 43,183 $ 42,310
(1) Net interest revenue includes the taxable equivalent adjustments related to the tax-exempt bond portfolio (based on the U.S. federal statutory tax rate of 21%) of
$196 million, $208 million and $254 million for 2020, 2019 and 2018, respectively.
Citi’s net interest revenue (NIR) in the fourth quarter of 2020
decreased 13% to $10.5 billion (also $10.5 billion on a taxable
equivalent basis) versus the prior-year period. Excluding the
impact of FX translation, NIR decreased year-over-year by
approximately $1.3 billion. The decrease was primarily related
to a decline of approximately $1.5 billion in non-ICG Markets
NIR, partially offset by an approximate $130 million increase
in ICG Markets (fixed income markets and equity markets)
NIR. The decrease in non-ICG Markets NIR primarily
reflected lower interest rates and lower loan balances across
institutional and consumer businesses (for additional
information, see “Liquidity Risk—Loans” above). Citi’s NIM
was 2.00% on a taxable equivalent basis in the fourth quarter
of 2020, a decrease of three basis points from the prior quarter,
reflecting lower NIR and balance sheet expansion due to
strong deposit growth.
Citi’s NIR for the full year 2020 decreased 8% to $43.5
billion ($43.7 billion on a taxable equivalent basis) versus the
prior year. Excluding the impact of FX translation, NIR
decreased 6%, or approximately $3.0 billion. The decrease
was primarily related to a decline of $4.1 billion in non-ICG
Markets NIR, partially offset by an increase of $1.1 billion in
ICG Markets NIR. The decrease in non-ICG Markets NIR was
primarily driven by lower interest rates, as well as lower loan
balances. On a full-year basis, Citi’s NIM was 2.16% on a
taxable equivalent basis, compared to 2.65% in 2019.
Citi’s ICG Markets NIR and non-ICG Markets NIR are
non-GAAP financial measures. Citi believes presentation of
these measures provides a meaningful depiction of the
underlying fundamentals of its lending, investing and deposit-
raising businesses.
104
This page intentionally left blank.
105

Additional Interest Rate Details
Average Balances and Interest Rates—Assets
(1)(2)(3)
Taxable Equivalent Basis
Average volume Interest revenue % Average rate
In millions of dollars, except rates
2020 2019 2018 2020 2019 2018 2020 2019 2018
Assets
Deposits with banks
(4)
$ 288,629 $ 188,523 $ 177,294 $ 928 $ 2,682 $ 2,203 0.32 % 1.42 % 1.24 %
Securities borrowed and
purchased under agreements to
resell
(5)
In U.S. offices $ 149,076 $ 146,030 $ 149,879 $ 1,202 $ 4,752 $ 3,818 0.81 % 3.25 % 2.55 %
In offices outside the U.S.
(4)
138,074 119,550 117,695 1,081 2,133 1,674 0.78 1.78 1.42
Total $ 287,150 $ 265,580 $ 267,574 $ 2,283 $ 6,885 $ 5,492 0.80 % 2.59 % 2.05 %
Trading account assets
(6)(7)
In U.S. offices $ 144,130 $ 109,064 $ 94,065 $ 3,624 $ 4,099 $ 3,706 2.51 % 3.76 % 3.94 %
In offices outside the U.S.
(4)
134,078 131,217 115,601 2,509 3,589 2,615 1.87 2.74 2.26
Total $ 278,208 $ 240,281 $ 209,666 $ 6,133 $ 7,688 $ 6,321 2.20 % 3.20 % 3.01 %
Investments
In U.S. offices
Taxable $ 265,833 $ 221,895 $ 228,686 $ 3,860 $ 5,162 $ 5,331 1.45 % 2.33 % 2.33 %
Exempt from U.S. income tax 14,084 15,227 17,199 452 577 706 3.21 3.79 4.10
In offices outside the U.S.
(4)
139,400 117,529 104,033 3,781 4,222 3,600 2.71 3.59 3.46
Total $ 419,317 $ 354,651 $ 349,918 $ 8,093 $ 9,961 $ 9,637 1.93 % 2.81 % 2.75 %
Loans (net of unearned income)
(8)
In U.S. offices $ 396,846 $ 395,792 $ 385,350 $ 26,700 $ 30,563 $ 28,627 6.73 % 7.72 % 7.43 %
In offices outside the U.S.
(4)
288,379 288,319 285,505 13,569 17,266 17,129 4.71 5.99 6.00
Total $ 685,225 $ 684,111 $ 670,855 $ 40,269 $ 47,829 $ 45,756 5.88 % 6.99 % 6.82 %
Other interest-earning assets
(9)
$ 67,531 $ 64,322 $ 67,269 $ 579 $ 1,673 $ 1,673 0.86 % 2.60 % 2.49 %
Total interest-earning assets $ 2,026,060 $ 1,797,468 $ 1,742,576 $ 58,285 $ 76,718 $ 71,082 2.88 % 4.27 % 4.08 %
Non-interest-earning assets
(6)
$ 200,196 $ 181,341 $ 177,654
Total assets $ 2,226,256 $ 1,978,809 $ 1,920,230
(1) Net interest revenue includes the taxable equivalent adjustments related to the tax-exempt bond portfolio (based on the U.S. federal statutory tax rate of 21%) of
$196 million, $208 million and $254 million for 2020, 2019 and 2018, respectively.
(2) Interest rates and amounts include the effects of risk management activities associated with the respective asset categories.
(3) Monthly or quarterly averages have been used by certain subsidiaries where daily averages are unavailable.
(4) Average rates reflect prevailing local interest rates, including inflationary effects and monetary corrections in certain countries.
(5) Average volumes of securities borrowed or purchased under agreements to resell are reported net pursuant to ASC 210-20-45. However, Interest revenue excludes
the impact of ASC 210-20-45.
(6) The fair value carrying amounts of derivative contracts are reported net, pursuant to ASC 815-10-45, in Non-interest-earning assets and Other non-interest-
bearing liabilities.
(7) Interest expense on Trading account liabilities of ICG is reported as a reduction of Interest revenue. Interest revenue and Interest expense on cash collateral
positions are reported in interest on Trading account assets and Trading account liabilities, respectively.
(8) Includes cash-basis loans.
(9) Includes Brokerage receivables.
106

Average Balances and Interest Rates—Liabilities and Equity, and Net Interest Revenue
(1)(2)(3)
Taxable Equivalent Basis
Average volume Interest expense % Average rate
In millions of dollars, except rates
2020 2019 2018 2020 2019 2018 2020 2019 2018
Liabilities
Deposits
In U.S. offices
(4)
$ 485,848 $ 388,948 $ 338,060 $ 3,384 $ 6,304 $ 4,500 0.70 % 1.62 % 1.33 %
In offices outside the U.S.
(5)
541,301 487,318 453,793 3,153 6,329 5,116 0.58 1.30 1.13
Total $ 1,027,149 $ 876,266 $ 791,853 $ 6,537 $ 12,633 $ 9,616 0.64 % 1.44 % 1.21 %
Securities loaned and sold under
agreements to repurchase
(6)
In U.S. offices $ 137,348 $ 112,876 $ 102,843 $ 1,292 $ 4,194 $ 3,320 0.94 % 3.72 % 3.23 %
In offices outside the U.S.
(5)
79,426 77,283 69,264 785 2,069 1,569 0.99 2.68 2.27
Total $ 216,774 $ 190,159 $ 172,107 $ 2,077 $ 6,263 $ 4,889 0.96 % 3.29 % 2.84 %
Trading account liabilities
(7)(8)
In U.S. offices $ 38,308 $ 37,099 $ 37,305 $ 283 $ 818 $ 612 0.74 % 2.20 % 1.64 %
In offices outside the U.S.
(5)
52,051 51,817 58,919 345 490 389 0.66 0.95 0.66
Total $ 90,359 $ 88,916 $ 96,224 $ 628 $ 1,308 $ 1,001 0.70 % 1.47 % 1.04 %
Short-term borrowings and other
interest-bearing liabilities
(9)
In U.S. offices $ 82,363 $ 78,230 $ 85,009 $ 493 $ 2,138 $ 1,885 0.60 % 2.73 % 2.22 %
In offices outside the U.S.
(5)
20,053 20,575 23,402 137 327 324 0.68 1.59 1.38
Total $ 102,416 $ 98,805 $ 108,411 $ 630 $ 2,465 $ 2,209 0.62 % 2.49 % 2.04 %
Long-term debt
(10)
In U.S. offices $ 213,809 $ 193,972 $ 197,933 $ 4,656 $ 6,398 $ 6,386 2.18 % 3.30 % 3.23 %
In offices outside the U.S.
(5)
3,918 4,803 4,895 13 96 165 0.33 2.00 3.37
Total $ 217,727 $ 198,775 $ 202,828 $ 4,669 $ 6,494 $ 6,551 2.14 % 3.27 % 3.23 %
Total interest-bearing liabilities $ 1,654,425 $ 1,452,921 $ 1,371,423 $ 14,541 $ 29,163 $ 24,266 0.88 % 2.01 % 1.77 %
Demand deposits in U.S. offices $ 30,876 $ 27,737 $ 33,398
Other non-interest-bearing
liabilities
(7)
346,538 301,813 315,862
Total liabilities $ 2,031,839 $ 1,782,471 $ 1,720,683
Citigroup stockholders’ equity $ 193,769 $ 195,632 $ 198,681
Noncontrolling interests 648 706 866
Total equity $ 194,417 $ 196,338 $ 199,547
Total liabilities and stockholders’
equity $ 2,226,256 $ 1,978,809 $ 1,920,230
Net interest revenue as a
percentage of average interest-
earning assets
(11)
In U.S. offices $ 1,187,061 $ 1,017,021 $ 992,543 $ 26,661 $ 28,466 $ 28,157 2.25 % 2.80 % 2.84 %
In offices outside the U.S.
(6)
838,999 780,447 750,033 17,083 19,089 18,659 2.04 2.45 2.49
Total $ 2,026,060 $ 1,797,468 $ 1,742,576 $ 43,744 $ 47,555 $ 46,816 2.16 % 2.65 % 2.69 %
(1) Net interest revenue includes the taxable equivalent adjustments related to the tax-exempt bond portfolio (based on the U.S. federal statutory tax rate of 21%) of
$196 million, $208 million and $254 millionfor 2020, 2019 and 2018, respectively.
(2) Interest rates and amounts include the effects of risk management activities associated with the respective liability categories.
(3) Monthly or quarterly averages have been used by certain subsidiaries where daily averages are unavailable.
(4) Consists of other time deposits and savings deposits. Savings deposits are composed of insured money market accounts, NOW accounts and other savings
deposits. The interest expense on savings deposits includes FDIC deposit insurance assessments.
(5) Average rates reflect prevailing local interest rates, including inflationary effects and monetary corrections in certain countries.
(6) Average volumes of securities sold under agreements to repurchase are reported net pursuant to ASC 210-20-45. However, Interest expense excludes the impact of
ASC 210-20-45.
(7) The fair value carrying amounts of derivative contracts are reported net, pursuant to ASC 815-10-45, in Non-interest-earning assets and Other non-interest-
bearing liabilities.
107
(8) Interest expense on Trading account liabilities of ICG is reported as a reduction of Interest revenue. Interest revenue and Interest expense on cash collateral
positions are reported in interest on Trading account assets and Trading account liabilities, respectively.
(9) Includes Brokerage payables.
(10) Excludes hybrid financial instruments and beneficial interests in consolidated VIEs that are classified as Long-term debt, as the changes in fair value for these
obligations are recorded in Principal transactions.
(11) Includes allocations for capital and funding costs based on the location of the asset.
Analysis of Changes in Interest Revenue
(1)(2)(3)
2020 vs. 2019 2019 vs. 2018
Increase (decrease)
due to change in:
Increase (decrease)
due to change in:
In millions of dollars
Average
volume
Average
rate
Net
change
Average
volume
Average
rate
Net
change
Deposits with banks
(3)
$ 976 $ (2,730) $ (1,754) $ 146 $ 333 $ 479
Securities borrowed and purchased under agreements to resell
In U.S. offices $ 96 $ (3,647) $ (3,551) $ (100) $ 1,034 $ 934
In offices outside the U.S.
(3)
290 (1,342) (1,052) 27 432 459
Total $ 386 $ (4,989) $ (4,603) $ (73) $ 1,466 $ 1,393
Trading account assets
(4)
In U.S. offices $ 1,102 $ (1,577) $ (475) $ 570 $ (177) $ 393
In offices outside the U.S.
(3)
77 (1,157) (1,080) 382 592 974
Total $ 1,179 $ (2,734) $ (1,555) $ 952 $ 415 $ 1,367
Investments
(1)
In U.S. offices $ 910 $ (2,337) $ (1,427) $ (213) $ (85) $ (298)
In offices outside the U.S.
(3)
703 (1,144) (441) 481 141 622
Total $ 1,613 $ (3,481) $ (1,868) $ 268 $ 56 $ 324
Loans (net of unearned income)
(5)
In U.S. offices $ 81 $ (3,944) $ (3,863) $ 789 $ 1,149 $ 1,938
In offices outside the U.S.
(3)
4 (3,701) (3,697) 169 (34) 135
Total $ 85 $ (7,645) $ (7,560) $ 958 $ 1,115 $ 2,073
Other interest-earning assets
(6)
$ 80 $ (1,173) $ (1,093) $ (75) $ 75 $ —
Total interest revenue $ 4,319 $ (22,752) $ (18,433) $ 2,176 $ 3,460 $ 5,636
(1) The taxable equivalent adjustments related to the tax-exempt bond portfolio, based on the U.S. federal statutory tax rate of 21%, are included in this presentation.
(2) Rate/volume variance is allocated based on the percentage relationship of changes in volume and changes in rate to the total net change.
(3) Changes in average rates reflect changes in prevailing local interest rates, including inflationary effects and monetary corrections in certain countries.
(4) Interest expense on Trading account liabilities of ICG is reported as a reduction of Interest revenue. Interest revenue and Interest expense on cash collateral
positions are reported in interest on Trading account assets and Trading account liabilities, respectively.
(5) Includes cash-basis loans.
(6) Includes Brokerage receivables.
108
Analysis of Changes in Interest Expense and Net Interest Revenue
(1)(2)(3)
2020 vs. 2019 2019 vs. 2018
Increase (decrease)
due to change in:
Increase (decrease)
due to change in:
In millions of dollars
Average
volume
Average
rate
Net
change
Average
volume
Average
rate
Net
change
Deposits
In U.S. offices $ 1,298 $ (4,218) $ (2,920) $ 738 $ 1,066 $ 1,804
In offices outside the U.S.
(3)
637 (3,813) (3,176) 397 816 1,213
Total $ 1,935 $ (8,031) $ (6,096) $ 1,135 $ 1,882 $ 3,017
Securities loaned and sold under agreements to repurchase
In U.S. offices $ 756 $ (3,658) $ (2,902) $ 343 $ 531 $ 874
In offices outside the U.S.
(3)
56 (1,340) (1,284) 194 306 500
Total $ 812 $ (4,998) $ (4,186) $ 537 $ 837 $ 1,374
Trading account liabilities
(4)
In U.S. offices $ 27 $ (562) $ (535) $ (3) $ 209 $ 206
In offices outside the U.S.
(3)
2 (147) (145) (51) 152 101
Total $ 29 $ (709) $ (680) $ (54) $ 361 $ 307
Short-term borrowings and other interest-bearing liabilities
(5)
In U.S. offices $ 107 $ (1,752) $ (1,645) $ (159) $ 412 $ 253
In offices outside the U.S.
(3)
(8) (182) (190) (42) 45 3
Total $ 99 $ (1,934) $ (1,835) $ (201) $ 457 $ 256
Long-term debt
In U.S. offices $ 602 $ (2,344) $ (1,742) $ (129) $ 141 $ 12
In offices outside the U.S.
(3)
(15) (68) (83) (3) (66) (69)
Total $ 587 $ (2,412) $ (1,825) $ (132) $ 75 $ (57)
Total interest expense $ 3,462 $ (18,084) $ (14,622) $ 1,285 $ 3,612 $ 4,897
Net interest revenue $ 857 $ (4,668) $ (3,811) $ 891 $ (152) $ 739
(1) The taxable equivalent adjustments related to the tax-exempt bond portfolio, based on the U.S. federal statutory tax rate of 21%, are included in this presentation.
(2) Rate/volume variance is allocated based on the percentage relationship of changes in volume and changes in rate to the total net change.
(3) Changes in average rates reflect changes in prevailing local interest rates, including inflationary effects and monetary corrections in certain countries.
(4) Interest expense on Trading account liabilities of ICG is reported as a reduction of Interest revenue. Interest revenue and Interest expense on cash collateral
positions are reported in interest on Trading account assets and Trading account liabilities, respectively.
(5) Includes Brokerage payables.
109
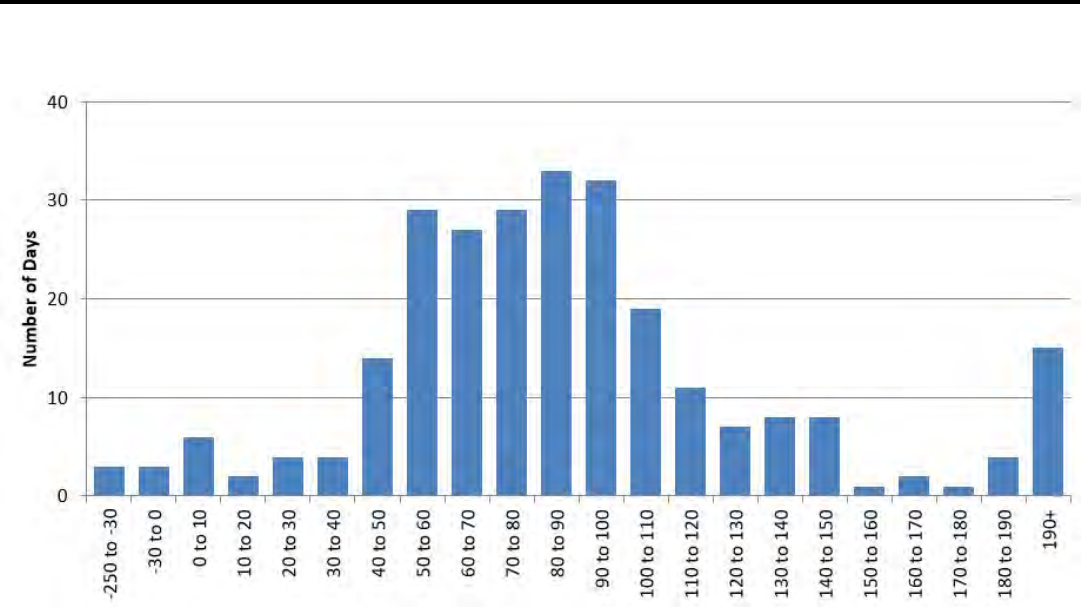
Market Risk of Trading Portfolios
Trading portfolios include positions resulting from market-
making activities, hedges of certain available-for-sale (AFS)
debt securities, the CVA relating to derivative counterparties
and all associated hedges, fair value option loans and hedges
of the loan portfolio within capital markets origination within
ICG.
The market risk of Citi’s trading portfolios is monitored
using a combination of quantitative and qualitative measures,
including, but not limited to:
• factor sensitivities;
• value at risk (VAR); and
• stress testing.
Each trading portfolio across Citi’s businesses has its own
market risk limit framework encompassing these measures and
other controls, including trading mandates, new product
approval, permitted product lists and pre-trade approval for
larger, more complex and less liquid transactions.
The following chart of total daily trading-related revenue
(loss) captures trading volatility and shows the number of days
in which revenues for Citi’s trading businesses fell within
particular ranges. Trading-related revenue includes trading, net
interest and other revenue associated with Citi’s trading
businesses. It excludes DVA, FVA and CVA adjustments
incurred due to changes in the credit quality of counterparties,
as well as any associated hedges of that CVA. In addition, it
excludes fees and other revenue associated with capital
markets origination activities. Trading-related revenues are
driven by both customer flows and the changes in valuation of
the trading inventory. As shown in the chart below, positive
trading-related revenue was achieved for 97.7% of the trading
days in 2020.
Daily Trading-Related Revenue (Loss)
(1)
—Twelve Months Ended December 31, 2020
In millions of dollars
(1) Reflects the effects of asymmetrical accounting for economic hedges of certain AFS debt securities. Specifically, the change in the fair value of hedging
derivatives is included in trading-related revenue, while the offsetting change in the fair value of hedged AFS debt securities is included in AOCI and not reflected
above.
110
Factor Sensitivities
Factor sensitivities are expressed as the change in the value of
a position for a defined change in a market risk factor, such as
a change in the value of a U.S. Treasury bill for a one-basis-
point change in interest rates. Citi’s market risk management,
within the Risk organization, works to ensure that factor
sensitivities are calculated, monitored and limited for all
material risks taken in the trading portfolios.
Value at Risk (VAR)
VAR estimates, at a 99% confidence level, the potential
decline in the value of a position or a portfolio under normal
market conditions assuming a one-day holding period. VAR
statistics, which are based on historical data, can be materially
different across firms due to differences in portfolio
composition, differences in VAR methodologies and
differences in model parameters. As a result, Citi believes
VAR statistics can be used more effectively as indicators of
trends in risk-taking within a firm, rather than as a basis for
inferring differences in risk-taking across firms.
Citi uses a single, independently approved Monte Carlo
simulation VAR model (see “VAR Model Review and
Validation” below), which has been designed to capture
material risk sensitivities (such as first- and second-order
sensitivities of positions to changes in market prices) of
various asset classes/risk types (such as interest rate, credit
spread, foreign exchange, equity and commodity risks). Citi’s
VAR includes positions that are measured at fair value; it does
not include investment securities classified as AFS or HTM.
For information on these securities, see Note 13 to the
Consolidated Financial Statements.
Citi believes its VAR model is conservatively calibrated
to incorporate fat-tail scaling and the greater of short-term
(approximately the most recent month) and long-term (three
years) market volatility. The Monte Carlo simulation involves
approximately 450,000 market factors, making use of
approximately 350,000 time series, with sensitivities updated
daily, volatility parameters updated intra-monthly and
correlation parameters updated monthly. The conservative
features of the VAR calibration contribute an approximate
32% add-on to what would be a VAR estimated under the
assumption of stable and perfectly, normally distributed
markets.
As set forth in the table below, Citi’s average trading
VAR increased from 2019 to 2020, mainly due to significant
market volatility during the first half of 2020 across all asset
classes, driven by macroeconomic challenges and
uncertainties related to the COVID-19 pandemic. Citi’s
average trading and credit portfolio VAR also increased in
2020, primarily due to the higher market volatility, increased
hedging activity and changes in portfolio composition.
Year-end and Average Trading VAR and Trading and Credit Portfolio VAR
In millions of dollars
December 31,
2020
2020
Average
December 31,
2019
2019
Average
Interest rate $ 72 $ 66 $ 32 $ 35
Credit spread 70 86 44 44
Covariance adjustment
(1)
(51) (48) (27) (23)
Fully diversified interest rate and credit spread
(2)
$ 91 $ 104 $ 49 $ 56
Foreign exchange 40 26 22 23
Equity 31 36 21 16
Commodity 17 22 13 24
Covariance adjustment
(1)
(85) (82) (52) (62)
Total trading VAR—all market risk factors, including general and specific risk
(excluding credit portfolios)
(2)
$ 94 $ 106 $ 53 $ 57
Specific risk-only component
(3)
$ (1) $ (2) $ 3 $ 2
Total trading VAR—general market risk factors only (excluding credit portfolios) $ 95 $ 108 $ 50 $ 55
Incremental impact of the credit portfolio
(4)
$ 29 $ 49 $ 30 $ 14
Total trading and credit portfolio VAR $ 123 $ 155 $ 83 $ 71
(1) Covariance adjustment (also known as diversification benefit) equals the difference between the total VAR and the sum of the VARs tied to each risk type. The
benefit reflects the fact that the risks within individual and across risk types are not perfectly correlated and, consequently, the total VAR on a given day will be
lower than the sum of the VARs relating to each risk type. The determination of the primary drivers of changes to the covariance adjustment is made by an
examination of the impact of both model parameter and position changes.
(2) The total trading VAR includes mark-to-market and certain fair value option trading positions in ICG, with the exception of hedges to the loan portfolio, fair value
option loans and all CVA exposures. Available-for-sale and accrual exposures are not included.
(3) The specific risk-only component represents the level of equity and fixed income issuer-specific risk embedded in VAR.
(4) The credit portfolio is composed of mark-to-market positions associated with non-trading business units including Citi Treasury, the CVA relating to derivative
counterparties and all associated CVA hedges. FVA and DVA are not included. The credit portfolio also includes hedges to the loan portfolio, fair value option
loans and hedges to the leveraged finance pipeline within capital markets origination in ICG.
111
The table below provides the range of market factor VARs associated with Citi’s total trading VAR, inclusive of specific risk:
2020 2019
In millions of dollars
Low High Low High
Interest rate $ 28 $ 137 $ 25 $ 58
Credit spread 36 171 36 55
Fully diversified interest rate and credit spread $ 44 $ 223 $ 43 $ 89
Foreign exchange 14 40 12 34
Equity 13 141 7 29
Commodity 12 64 12 75
Total trading $ 47 $ 245 $ 38 $ 87
Total trading and credit portfolio 58 424 54 103
Note: No covariance adjustment can be inferred from the above table as the high and low for each market factor will be from different close-of-business dates.
The following table provides the VAR for ICG, excluding
the CVA relating to derivative counterparties, hedges of CVA,
fair value option loans and hedges to the loan portfolio:
In millions of dollars
Dec. 31, 2020
Total—all market risk factors, including
general and specific risk $ 97
Average—during year $ 104
High—during year 236
Low—during year 44
VAR Model Review and Validation
Generally, Citi’s VAR review and model validation process
entails reviewing the model framework, major assumptions
and implementation of the mathematical algorithm. In
addition, product specific back-testing on portfolios is
periodically completed as part of the ongoing model
performance monitoring process and reviewed with Citi’s U.S.
banking regulators. Furthermore, Regulatory VAR back-
testing (as described below) is performed against buy-and-
hold profit and loss on a monthly basis for multiple sub-
portfolios across the organization (trading desk level, ICG
business segment and Citigroup) and the results are shared
with U.S. banking regulators.
Material VAR model and assumption changes must be
independently validated within Citi’s risk management
organization. All model changes, including those for the VAR
model, are validated by the model validation group within
Citi’s Model Risk Management. In the event of significant
model changes, parallel model runs are undertaken prior to
implementation. In addition, significant model and assumption
changes are subject to the periodic reviews and approval by
Citi’s U.S. banking regulators.
Citi uses the same independently validated VAR model
for both Regulatory VAR and Risk Management VAR (i.e.,
total trading and total trading and credit portfolios VARs) and,
as such, the model review and validation process for both
purposes is as described above.
Regulatory VAR, which is calculated in accordance with
Basel III, differs from Risk Management VAR due to the fact
that certain positions included in Risk Management VAR are
not eligible for market risk treatment in Regulatory VAR. The
composition of Risk Management VAR is discussed under
“Value at Risk” above. The applicability of the VAR model
for positions eligible for market risk treatment under U.S.
regulatory capital rules is periodically reviewed and approved
by Citi’s U.S. banking regulators.
In accordance with Basel III, Regulatory VAR includes
all trading book-covered positions and all foreign exchange
and commodity exposures. Pursuant to Basel III, Regulatory
VAR excludes positions that fail to meet the intent and ability
to trade requirements and are therefore classified as non-
trading book and categories of exposures that are specifically
excluded as covered positions. Regulatory VAR excludes
CVA on derivative instruments and DVA on Citi’s own fair
value option liabilities. CVA hedges are excluded from
Regulatory VAR and included in credit risk-weighted assets as
computed under the Advanced Approaches for determining
risk-weighted assets.
Regulatory VAR Back-Testing
In accordance with Basel III, Citi is required to perform back-
testing to evaluate the effectiveness of its Regulatory VAR
model. Regulatory VAR back-testing is the process in which
the daily one-day VAR, at a 99% confidence interval, is
compared to the buy-and-hold profit and loss (i.e., the profit
and loss impact if the portfolio is held constant at the end of
the day and re-priced the following day). Buy-and-hold profit
and loss represents the daily mark-to-market profit and loss
attributable to price movements in covered positions from the
close of the previous business day. Buy-and-hold profit and
loss excludes realized trading revenue, net interest, fees and
commissions, intra-day trading profit and loss and changes in
reserves.
Based on a 99% confidence level, Citi would expect two
to three days in any one year when buy-and-hold losses exceed
the Regulatory VAR. Given the conservative calibration of
Citi’s VAR model (as a result of taking the greater of short-
and long-term volatilities and fat-tail scaling of volatilities),
Citi would expect fewer exceptions under normal and stable
market conditions. Periods of unstable market conditions
could increase the number of back-testing exceptions.
112
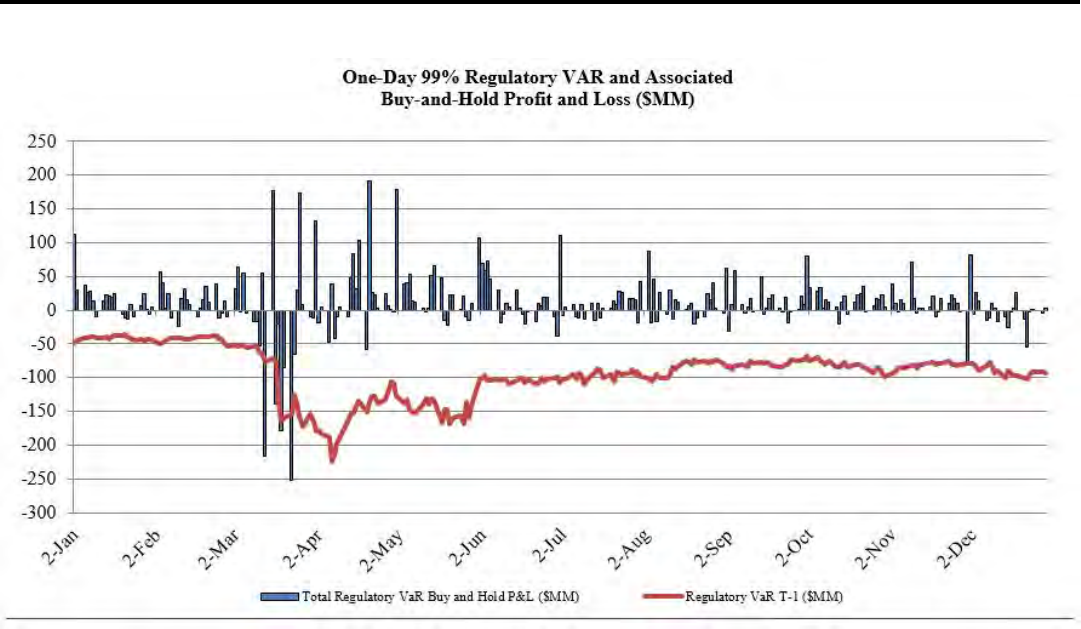
The following graph shows the daily buy-and-hold profit
and loss associated with Citi’s covered positions compared to
Citi’s one-day Regulatory VAR during 2020. As of December
31, 2020, four back-testing exceptions were observed at the
Citigroup level. These exceptions occurred in March and were
due to losses across multiple businesses during the onset of the
pandemic-related volatility.
The difference between the 65.26% of days with buy-and-
hold gains for Regulatory VAR back-testing and the 97.7% of
days with trading, net interest and other revenue associated
with Citi’s trading businesses, shown in the histogram of daily
trading-related revenue below, reflects, among other things,
that a significant portion of Citi’s trading-related revenue is
not generated from daily price movements on these positions
and exposures, as well as differences in the portfolio
composition of Regulatory VAR and Risk Management VAR.
Regulatory Trading VAR and Associated Buy-and-Hold Profit and Loss
(1)
—12 Months ended December 31, 2020
In millions of dollars
(1) Buy-and-hold profit and loss, as defined by the banking regulators under Basel III, represents the daily mark-to-market revenue movement attributable to the
trading position from the close of the previous business day. Buy-and-hold profit and loss excludes realized trading revenue and net interest intra-day trading
profit and loss on new and terminated trades, as well as changes in reserves. Therefore, it is not comparable to the trading-related revenue presented in the chart of
daily trading-related revenue above.
113
Stress Testing
Citi performs market risk stress testing on a regular basis to
estimate the impact of extreme market movements. It is
performed on individual positions and trading portfolios, as
well as in aggregate, inclusive of multiple trading portfolios.
Citi’s market risk management, after consultations with the
businesses, develops both systemic and specific stress
scenarios, reviews the output of periodic stress testing
exercises and uses the information to assess the ongoing
appropriateness of exposure levels and limits. Citi uses two
complementary approaches to market risk stress testing across
all major risk factors (i.e., equity, foreign exchange,
commodity, interest rate and credit spreads): top-down
systemic stresses and bottom-up business-specific stresses.
Systemic stresses are designed to quantify the potential impact
of extreme market movements on an institution-wide basis,
and are constructed using both historical periods of market
stress and projections of adverse economic scenarios.
Business-specific stresses are designed to probe the risks of
particular portfolios and market segments, especially those
risks that are not fully captured in VAR and systemic stresses.
The systemic stress scenarios and business-specific stress
scenarios at Citi are used in several reports reviewed by senior
management and also to calculate internal risk capital for
trading market risk. In general, changes in market values are
defined over a one-year horizon. For the most liquid positions
and market factors, changes in market values are defined over
a shorter two-month horizon. The limited set of positions and
market factors whose market value changes are defined over a
two-month horizon are those that in management’s judgment
have historically remained very liquid during financial crises,
even as the trading liquidity of most other positions and
market factors materially declined.
114
OPERATIONAL RISK
Overview
Operational risk is the risk of loss resulting from inadequate or
failed internal processes, people and systems or from external
events. This includes legal risk, which is the risk of loss
(including litigation costs, settlements, and regulatory fines)
resulting from the failure of Citi to comply with laws,
regulations, prudent ethical standards, and contractual
obligations in any aspect of its businesses, but excludes
strategic and reputation risks. Citi also recognizes the impact
of operational risk on the reputation risk associated with Citi’s
business activities.
Operational risk is inherent in Citi’s global business
activities, as well as related support functions, and can result
in losses. Citi maintains a comprehensive firm-wide risk
taxonomy to classify operational risks that it faces using
standardized definitions across the firm’s Operational Risk
Management Framework (see discussion below). This
taxonomy also supports regulatory requirements and
expectations inclusive of those related to U.S. Basel III capital
requirements, CCAR process and heightened standards under
U.S. banking requirements.
Citi manages operational risk consistent with the overall
framework described in “Managing Global Risk—Overview”
above. Citi’s goal is to keep operational risk at appropriate
levels relative to the characteristics of its businesses, the
markets in which it operates, its capital and liquidity and the
competitive, economic and regulatory environment. This
includes effectively managing operational risk and
maintaining or reducing operational risk exposures within
Citi’s operational risk appetite.
To anticipate, mitigate and control operational risk, Citi’s
Independent Operational Risk Management group has
established a global-Operational Risk Management
Framework with policies and practices for identification,
measurement, monitoring, mitigating, and reporting
operational risks and the overall operating effectiveness of the
internal control environment. As part of this framework, Citi
has defined its operational risk appetite and established a
manager’s control assessment (MCA) process for self-
identification of significant operational risks, assessment of
the performance of key controls and mitigation of residual risk
above acceptable levels.
Each major business segment must implement operational
risk processes consistent with the requirements of this
framework. This includes:
• Understanding the operational risks they are exposed to;
• designing controls to mitigate identified risks;
• establishing key indicators;
• monitoring and reporting whether the operational risk
exposures are in or out of their operational risk appetite;
• having processes in place to bring operational risk
exposures within acceptable levels;
• periodically estimate and aggregate the operational risks
they are exposed to; and
• ensuring that sufficient resources are available to
actively improve the operational risk environment and
mitigate emerging risks.
Citi considers operational risks that result from the
introduction of new or changes to existing products, or result
from significant changes in its organizational structures,
systems, processes and personnel.
Citi has a governance structure for the oversight of
operational risk exposures through Business Risk and Controls
Committees (BRCCs), which include a Citigroup BRCC as
well as business, functions, regional and country BRCCs.
BRCCs are chaired by the individuals in the first line of
defense and provide escalation channels for senior
management to review operational risk exposures including
breaches of operational risk appetite, key indicators,
operational risk events, and control issues. Membership
includes senior business and functions leadership as well as
members of the second line of defense.
Citi also has an Operational Risk Management Committee
that provides senior management of the second line of defense
risk organizations with a platform to assess Citi’s operational
risk profile and to review that actions are taken to bring Citi’s
operational risk exposures within operational risk appetite.
Members include Citi’s Chief Risk Officer and Citi’s Head of
Operational Risk Management and senior members of their
organizations. These members cover multiple dimensions of
risk management and include business and regional Chief Risk
Officers and senior operational risk managers.
In addition, Independent Risk Management, including the
Operational Risk Management group, works proactively with
Citi’s businesses and functions to drive a strong and embedded
operational risk management culture and framework across
Citi. The Operational Risk Management group actively
challenges business and functions implementation of the
Operational Risk Management Framework requirements and
the quality of operational risk management practices and
outcomes.
Information about businesses’ key operational risks,
historical operational risk losses and the control environment
is reported by each major business segment and functional
area. Citi’s operational risk profile and related information is
summarized and reported to senior management, as well as to
the Audit and Risk Committees of Citi’s Board of Directors by
the Head of Operational Risk Management.
Operational risk is measured through
Operational Risk Capital and Operational Risk Regulatory
Capital for the Advanced Approaches under Basel III.
Projected operational risk losses under stress scenarios are
estimated as a required part of the Federal Reserve Board’s
CCAR process.
For additional information on Citi’s operational risks, see
“Risk Factors—Operational Risk” above.
Erroneous Revlon-Related Payment
In August 2020, Citi, as administrative agent for a Revlon
credit facility, in addition to making an interest payment,
erroneously paid the lenders under the facility an aggregate of
approximately $894 million, which is an amount equal to the
principal balance of the loan at that time. Human error at Citi
and at a third-party vendor, and limitations in Citi’s loan
115
processing systems, were the main contributing factors. After
a careful assessment of the incident, Citi immediately put in
additional controls to prevent similar loan disbursement errors
in the future, while also embarking on a major upgrade of the
loan infrastructure and controls.
As of February 26, 2021, $389.8 million has been repaid
to Citi. In August 2020, Citi commenced litigation against
certain fund managers of lenders that have not returned the
remaining $504.2 million of erroneously transferred funds,
and obtained a temporary restraining order against the fund
managers and those acting with them, freezing the funds from
transfer or disbursement. On February 16, 2021, the court
issued a judgment in favor of the defendants, which Citi
intends to appeal. As a result of the court’s decision, Citi now
has rights as a creditor related to the Revlon loan. For
additional information, see Notes 27, 29 and 30 to the
Consolidated Financial Statements.
Cybersecurity Risk
Cybersecurity risk is the business risk associated with the
threat posed by a cyber attack, cyber breach or the failure to
protect Citi’s most vital business information assets or
operations, resulting in a financial or reputational loss(for
additional information, see the operational systems and
cybersecurity risk factors in “Risk Factors—Operational
Risks” above). With an evolving threat landscape, ever-
increasing sophistication of cybersecurity attacks and use of
new technologies to conduct financial transactions, Citi and its
clients, customers and third parties are and will continue to be
at risk for cyber attacks and information security incidents.
Citi recognizes the significance of these risks and, therefore,
employs an intelligence-led strategy to protect against, detect,
respond to and recover from cyber attacks. Further, Citi
actively participates in financial industry, government and
cross-sector knowledge-sharing groups to enhance individual
and collective cyber resilience.
Citi’s technology and cybersecurity risk management
program is built on three lines of defense. Citi’s first line of
defense under the Office of the Chief Information Security
Officer provides frontline business, operational and technical
controls and capabilities to protect against cybersecurity risks,
and to respond to cyber incidents and data breaches. Citi
manages these threats through state-of-the-art Fusion Centers,
which serve as central command for monitoring and
coordinating responses to cyber threats. The enterprise
information security team is responsible for infrastructure
defense and security controls, performing vulnerability
assessments and third-party information security assessments,
employee awareness and training programs and security
incident management, in each case working in coordination
with a network of information security officers who are
embedded within the businesses and functions on a global
basis.
Citi’s Operational Risk Management-Technology and
Cyber (ORM-T/C) and Independent Compliance Risk
Management-Technology and Information Security (ICRM-T)
groups serve as the second line of defense, and actively
evaluate, anticipate and challenge Citi’s risk mitigation
practices and capabilities. Internal audit serves as the third line
of defense and independently provides assurance on how
effectively the organization as a whole manages cybersecurity
risk. Citi also has multiple senior committees such as the
Information Security Risk Committee (ISRC), which governs
enterprise-level risk tolerance inclusive of cybersecurity risk.
Citi seeks to proactively identify and remediate
technology and cybersecurity risks before they materialize as
incidents that negatively affect business operations.
Accordingly, the ORM-T/C team independently challenges
and monitors capabilities in accordance with Citi’s defined
Technology and Cyber Risk Appetite statements. To address
evolving cybersecurity risks and corresponding regulations,
ORM-T/C and ICRM-T team collectively also monitor cyber
legal and regulatory requirements, identify and define
emerging risks, execute strategic cyber threat assessments,
perform new products and initiative reviews, perform data
management risk oversight and conduct cyber risk assurance
reviews (inclusive of third-party assessments). In addition,
ORM-T/C employs tools and oversees and challenges metrics
that are both tailored to cybersecurity and technology and
aligned with Citi’s overall operational risk management
framework to effectively track, identify and manage risk.
COMPLIANCE RISK
Compliance risk is the risk to current or projected financial
condition and resilience arising from violations of laws, rules,
or regulations, or from non-conformance with prescribed
practices, internal policies and procedures or ethical standards.
Compliance risk exposes Citi to fines, civil money penalties,
payment of damages and the voiding of contracts. Compliance
risk can result in diminished reputation, harm to the firm’s
customers, limited business opportunities and lessened
expansion potential. It encompasses the risk of noncompliance
with all laws and regulations, as well as prudent ethical
standards and some contractual obligations. It could also
include exposure to litigation (known as legal risk) from all
aspects of traditional and non-traditional banking.
Citi seeks to operate with integrity, maintain strong
ethical standards and adhere to applicable policies and
regulatory and legal requirements. Citi must maintain and
execute a proactive Compliance Risk Management (CRM)
Policy that is designed to manage compliance risk effectively
across Citi, with a view to fundamentally strengthen the
compliance risk management culture across the lines of
defense taking into account Citi’s risk governance framework
and regulatory requirements. Independent Compliance Risk
Management’s (ICRM) primary objectives are to:
• Drive and embed a culture of compliance and control
throughout Citi;
• Maintain and oversee an integrated CRM Policy and
Compliance Risk Framework that facilitates enterprise-
wide compliance with local, national or cross-border laws,
rules or regulations, Citi’s internal policies, standards and
procedures and relevant standards of conduct;
• Assess compliance risks and issues across product lines,
functions and geographies, supported by globally
consistent systems and compliance risk management
processes; and
• Provide compliance risk data aggregation and reporting
capabilities.
116
To anticipate, control and mitigate compliance risk, Citi
has established the CRM Policy to achieve standardization and
centralization of methodologies and processes, and to enable
more consistent and comprehensive execution of compliance
risk management.
Citi has a commitment, as well as an obligation, to
identify, assess and mitigate compliance risks associated with
its businesses and functions. ICRM is responsible for
oversight of Citi’s CRM Policy, while all businesses and
global control functions are responsible for managing their
compliance risks and operating within the Compliance Risk
Appetite.
Citi carries out its objectives and fulfills its
responsibilities through the Compliance Risk Framework,
which is composed of the following integrated key activities,
to holistically manage compliance risk:
• Management of Citi’s compliance with laws, rules and
regulations by identifying and analyzing changes,
assessing the impact, and implementing appropriate
policies, processes and controls.
• Developing and providing compliance training to ensure
colleagues are aware of and understand the key laws,
rules and regulations.
• Monitoring compliance risk appetite, which is articulated
through qualitative compliance risk statements describing
Citi’s appetite for certain types of risk and quantitative
measures to monitor the Company’s compliance risk
exposure.
• Monitoring and testing of compliance risks and controls
in assessing conformance with laws, rules, regulations and
internal policies.
• Issue identification, escalation and remediation to drive
accountability, including measurement and reporting of
compliance risk metrics against established thresholds in
support of the CRM Policy and Compliance Risk
Appetite.
As discussed above, Citi is working to address the FRB
and OCC consent orders, which include improvements to
Citi’s Compliance Risk Framework and its Enterprise-wide
application (for additional information regarding the consent
orders, see “Citi’s Consent Order Compliance” above).
REPUTATION RISK
Citi’s reputation is a vital asset in building trust with its
stakeholders and Citi is diligent in communicating its
corporate values to its colleagues, customers, investors and
regulators. To support this, Citi has defined a reputation risk
appetite approach. Under this approach, each major business
segment has implemented a risk appetite statement and related
key indicators to monitor and address weaknesses that may
result in significant reputation risks. The approach requires
that each business segment or region escalates significant
reputation risks that require review or mitigation through its
Reputation Risk Committee or equivalent.
The Reputation Risk Committees are part of the
governance infrastructure that Citi has in place to review the
reputation risk posed by business activities, sales practices,
product design, or perceived conflicts of interest. These
committees may also raise potential reputation risks for due
consideration by the Reputation Risk Committee at the
corporate level. The Citigroup Reputation Risk Committee
may escalate reputation risks to the Nomination, Governance
and Public Affairs Committee or other appropriate committee
of the Citigroup Board of Directors. The Reputation Risk
Committees, which are composed of Citi’s most senior
executives, govern the process by which material reputation
risks are identified, monitored, reported, managed and
escalated, and appropriate actions are taken in line with
Company-wide strategic objectives, risk appetite thresholds
and regulatory expectations, while promoting the culture of
risk awareness and high standards of integrity and ethical
behavior across the Company, consistent with Citi’s mission
and value proposition.
Further, the responsibility for maintaining Citi’s
reputation is shared by all colleagues, who are guided by Citi’s
Code of Conduct. Colleagues are expected to exercise sound
judgment and common sense in decisions and actions. They
are also expected to promptly and appropriately escalate all
issues that present potential reputation risk.
STRATEGIC RISK
Overview
Citi’s Executive Management Team, led by Citi’s CEO, is
responsible for the development and execution of Citi’s
strategy. This strategy is translated into forward-looking plans
that are then cascaded across the organization. Strategic risk is
monitored through a range of practices: regular Citigroup
Board of Director meetings provide strategic checkpoints
where management’s progress is assessed and where decisions
to refine the strategic direction of the Company are evaluated;
Citi’s Executive Management Team assesses progress against
executing the defined plans; CEO reviews, which include a
risk assessment of the plans, occur across products, regions
and functions to focus on progress against executing the plans;
products, regions and functions have internal reviews to assess
performance at lower levels across the organization; and
specific forums exist to focus on key areas that drive strategic
risk such as balance sheet management, the introduction of
new or modified products and services and country
management, among others. In addition to these day-to-day
practices, significant strategic actions, such as mergers,
acquisitions or capital expenditures, are reviewed and
approved by, or notified to, the Citigroup Board of Directors.
U.K.’s Future Relationship with the EU
As previously disclosed, the U.K. formally left the European
Union (EU) on January 31, 2020. Subsequently, the U.K. and
the EU entered into a Trade and Cooperation Agreement
(TCA) that set out preferential arrangements in areas such as
trade in goods and in services that became effective on
January 1, 2021. While entering into the TCA avoided a “no
deal” exit scenario, many questions remain as to the future
relationship between the U.K. and the EU. For example, the
TCA minimally covers financial services. The U.K. and the
EU have committed under the TCA to negotiate further details
regarding financial services, but there can be no assurance as
to the successful completion or ultimate outcome of those
negotiations. Citi planned extensively for the U.K. exit from
117
the EU and successfully implemented its transition plans to
date. However, future legislative and regulatory developments
in the U.K. and the EU as a result of the exit may negatively
impact Citi. For additional information, see “Risk Factors—
Strategic Risks” above.
LIBOR Transition Risk
The ICE Benchmark Administration concluded the
consultation on its intent to cease publication of one week and
two month USD LIBOR on December 31, 2021 and to extend
the publication of all remaining USD LIBORs until June 30,
2023 for legacy contracts. In addition, it is expected that all
non USD LIBOR tenors will cease after December 31, 2021.
Citi recognizes that a transition away from and discontinuance
of LIBOR presents various risks and challenges that could
significantly impact financial markets and market participants,
including Citi (for information about Citi’s risks from a
transition away from and discontinuation of LIBOR or any
other interest rate benchmark, see “Risk Factors—Strategic
Risks” above). Accordingly, Citi has continued its efforts to
identify and manage its LIBOR transition risks. Citi is also
closely monitoring legislative, regulatory and other
developments related to LIBOR transition matters and relief.
Citi has established a LIBOR governance and
implementation program focused on identifying and
addressing the LIBOR transition impacts to Citi’s clients,
operational capabilities and legal and financial contracts,
among others. The program operates globally across Citi’s
businesses and functions and includes active involvement of
senior management, oversight by Citi’s Asset & Liability
Committee and reporting to the Risk Management Committee
of Citigroup’s Board of Directors. As part of the program, Citi
has continued to implement its LIBOR transition action plans
and associated roadmaps under the following key
workstreams: program management; transition strategy and
risk management; customer management, including internal
communications and training, legal/contract management and
product management; financial exposures and risk
management; regulatory and industry engagement; operations
and technology; and finance, risk, tax and treasury.
During 2020, Citi continued to participate in a number of
working groups formed by global regulators, including the
Alternative Reference Rates Committee (ARRC) convened by
the Federal Reserve Board. These working groups promote
and advance development of alternative reference rates and
seek to identify and address potential challenges from any
transition to such rates. Citi also continued to engage with
regulators, financial accounting bodies and others on LIBOR
transition matters.
Moreover, Citi has continued to identify its LIBOR
transition exposures, including financial instruments that do
not contain contract provisions that adequately contemplate
the discontinuance of reference rates and that would require
additional negotiation with counterparties. Citi’s LIBOR
transition efforts include, among other things, using alternative
reference rates in certain newly issued financial instruments
and products. Since 2019, Citi has issued preferred stock and
benchmark debt referencing the Secured Overnight Financing
Rate (SOFR) as well as updated the LIBOR determination
method in its debt documentation with the ARRC
recommended fallback language. In addition, in 2020, Citi
transitioned the discounting of centrally cleared EUR and
USD interest rate derivatives to the Euro Short-Term Rate
(ESTR) and SOFR, respectively; announced the adoption of
the newly published Interbank Offered Rate (IBOR) Fallbacks
Protocol of the International Swaps and Derivatives
Association (ISDA) for existing IBOR derivatives
transactions; and increased Citi’s virtual client communication
efforts, including outreach regarding these new industry-led
protocols and solutions. Further, Citi has also been investing
in its systems and infrastructure, as client activity moves away
from LIBOR to alternative reference rates.
Climate Risk
Climate change presents immediate and long-term risks to Citi
and to its clients and customers, with the risks expected to
increase over time. Climate risk refers to the risk of loss
arising from climate change and is divided into physical risk
and transition risk. Physical risk considers how chronic and
acute climate change (e.g., increased storms, drought, fires,
floods) can directly damage physical assets (e.g., real estate,
crops) or otherwise impact their value or productivity.
Transition risk considers how changes in policy, technology
and market preference to address climate change (e.g., carbon
price policies, power generation shifts from fossil fuels to
renewable energy) can lead to changes in the value of assets,
commodities and companies.
Climate risk is an overarching risk that can act as a driver
of other types of risk in the Citi risk taxonomy, such as credit
risk from obligors exposed to high climate risk, reputational
risk from increased stakeholder concerns about financing high
carbon industries and operational risk from physical climate
risks to Citi’s facilities.
Citi currently identifies climate risk as an “emerging risk”
within its risk governance framework. Emerging risks are risks
or thematic issues that are either new to the landscape, or in
the case of climate risk, existing risks that are rapidly
changing or evolving in an escalating fashion, which are
difficult to assess due to limited data or other uncertainties.
For additional information on climate risk, see “Risk Factors
—Strategic Risk” above.
With the increased importance and focus on climate risk,
Citi has continued to expand its governance of climate risk and
integrate climate considerations into the priorities of
Citigroup’s Board of Directors and senior management. In
particular, Citi has:
• appointed a Chief Sustainability Officer;
• appointed a Head of Climate Risk to partner with the
Head of Environmental and Social Risk Management to
deliver a Company-wide strategy concerning climate risk;
• formed a global, cross-functional senior-executive level
Climate Risk Advisory Council to provide oversight of
and guidance to Citi’s climate risk integration efforts; and
• increased the frequency and depth of Board and senior-
level review of climate-related matters.
Citi manages and mitigates the credit and reputational
risks from climate change through a number of internal
initiatives, including Citi’s Environmental and Social Risk
118
Management (ESRM) Policy. First established in 2003, the
ESRM Policy is part of Citi’s broader credit risk management
policy and is applicable to all Citi entities globally. The ESRM
Policy provides the framework for how Citi identifies,
mitigates and manages the potential environmental and social
risks (including climate risks) associated with clients’
activities that could lead to credit or reputation risks to the
Company. It guides how Citi evaluates lending, underwriting
and advisory in environmentally sensitive and/or high-carbon
sectors, and presents opportunities for Citi to engage clients on
solutions to thematic risks.
In project-related lending, Citi’s ESRM Policy
incorporates the updates from the fourth iteration of the
Equator Principles, which Citi helped shape, that expands
climate risk requirements to include physical risk as well as
transition risk. Citi’s ESRM Policy covers lending and
underwriting with identified use of proceeds directed to
physical assets and activities, as well as sector standards for
corporate relationships in higher-risk sectors, including
carbon-intensive sectors. In 2020, Citi updated its sector
standards for thermal and coal mining, coal-fired power and
Arctic oil and gas.
Citi has also made climate risk one of the three key pillars
of its 2025 Sustainable Progress Strategy. Under this pillar,
Citi intends to measure, manage and reduce the climate risk
and impact of its client portfolios and enhance its Taskforce on
Climate-Related Financial Disclosures (TCFD)
implementation and disclosure through policy development,
portfolio analysis and client engagement. In December 2020,
Citi released its second report detailing its implementation of
the TCFD recommendations: Finance for a Climate-Resilient
Future II. In this report, Citi discusses its implementation of
the TCFD recommendations, and Citi’s recent pilot testing of
climate scenario analyses to assess climate-related impacts and
risks in specific sectors, spanning both transition and physical
climate risks. Climate data is still improving in terms of its
accessibility and reliability, and the industry and Citi continue
to develop better methodological approaches toward assessing
climate change impacts. Nonetheless, Citi expects to integrate
more quantitative analysis of climate risks into credit
assessments in the future and to quantify the carbon emissions
associated with its client portfolios. Citi will continue to
disclose its progress in this area in its annual Environmental,
Social, and Governance (ESG) Report and TCFD reporting.
In addition, Citi continues to participate in financial
industry collaborations to develop and pilot new
methodologies and approaches for measuring and assessing
the potential financial risks of climate change. Citi is also
closely monitoring regulatory developments on climate risk
and sustainable finance, and actively engaging with regulators
on these topics.
For information on Citi’s environmental and social
policies and priorities, see Citi’s website at
www.citigroup.com. Click on “About Us” and then
“Environmental, Social, and Governance.” For information on
Citi’s ESG and Sustainability (including climate change)
governance, see Citi’s 2020 Annual Meeting Proxy Statement
available at www.citigroup.com. Click on “Investors” and then
“Annual Reports & Proxy Statements.”
119
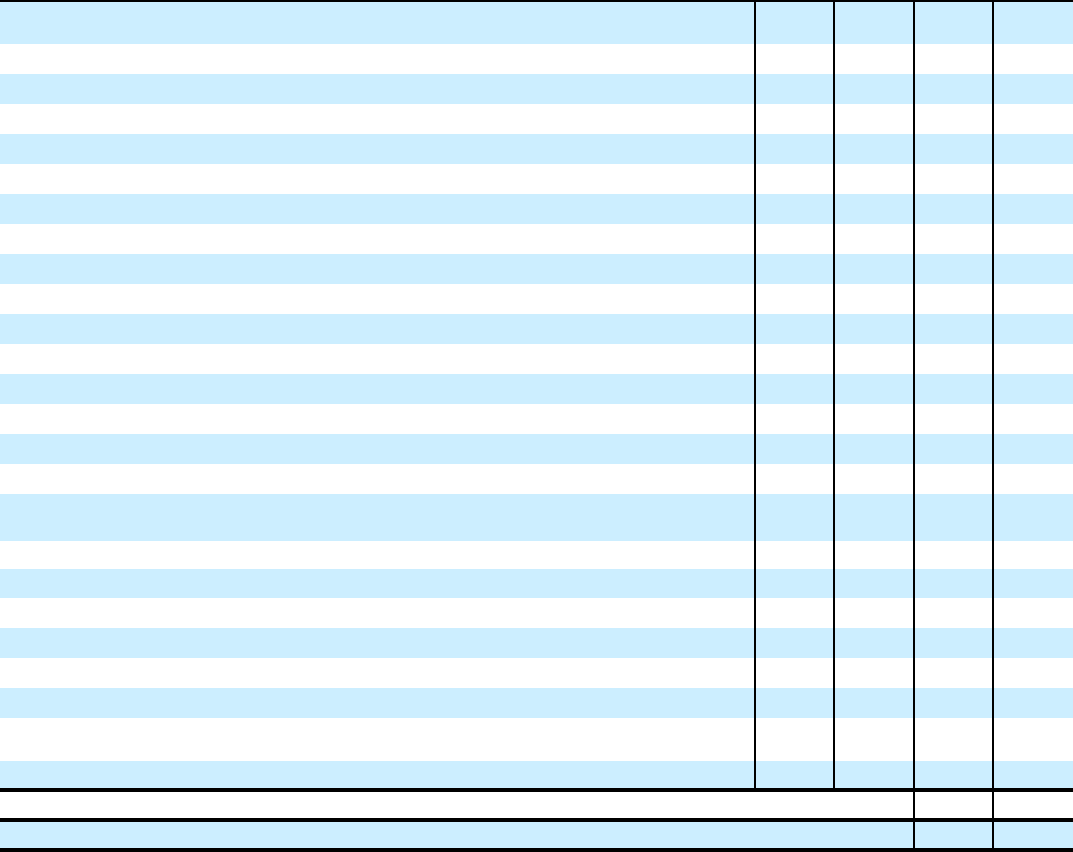
Country Risk
Top 25 Country Exposures
The following table presents Citi’s top 25 exposures by
country, excluding the U.S., as of December 31, 2020.
(Including the U.S., the total exposure as of December 31,
2020 would represent approximately 96% of Citi’s exposure
to all countries.)
For purposes of the table, loan amounts are reflected in
the country where the loan is booked, which is generally based
on the domicile of the borrower. For example, a loan to a
Chinese subsidiary of a Switzerland-based corporation will
generally be categorized as a loan in China. In addition, Citi
has developed regional booking centers in certain countries,
most significantly in the United Kingdom (U.K.) and Ireland,
in order to more efficiently serve its corporate customers. As
an example, with respect to the U.K., only 37% of corporate
loans presented in the table below are to U.K. domiciled
entities (42% for unfunded commitments), with the balance of
the loans predominately to European domiciled counterparties.
Approximately 80% of the total U.K. funded loans and 86% of
the total U.K. unfunded commitments were investment grade
as of December 31, 2020.
Trading account assets and investment securities are
generally categorized based on the domicile of the issuer of
the security of the underlying reference entity. For additional
information on the assets included in the table, see the
footnotes to the table below.
In billions of
dollars
ICG
loans
(1)
GCB
loans
Other
funded
(2)
Unfunded
(3)
Net MTM
on
derivatives/
repos
(4)
Total
hedges
(on loans
and
CVA)
Investment
securities
(5)
Trading
account
assets
(6)
Total
as of
4Q20
Total
as of
3Q20
Total
as of
4Q19
Total as a
% of Citi
as of
4Q20
United
Kingdom $ 43.3 $ — $ 2.0 $ 52.0 $ 17.0 $ (5.4) $ 5.0 $ 1.3 $ 115.2 $ 108.5 $ 105.8 6.6 %
Mexico 14.2 14.6 0.3 9.6 3.1 (0.9) 19.0 4.6 64.5 60.9 65.0 3.7
Hong Kong 18.2 13.2 0.5 6.8 1.8 (0.7) 7.1 2.1 49.0 47.9 49.0 2.8
Singapore 13.9 13.8 0.2 6.4 2.1 (0.6) 8.0 2.0 45.8 44.1 43.3 2.6
Ireland 13.0 — 0.6 29.2 0.5 (0.1) — 0.7 43.9 41.2 39.9 2.5
South Korea 3.3 18.7 0.1 2.6 1.5 (0.8) 9.7 0.7 35.8 33.2 34.7 2.1
India 6.6 4.2 0.9 6.2 3.5 (0.4) 9.9 0.5 31.4 31.6 30.0 1.8
Brazil 11.7 — — 2.8 4.2 (0.8) 4.3 4.0 26.2 25.1 28.3 1.5
Germany 0.7 — — 6.7 4.4 (4.0) 10.6 6.0 24.4 27.1 21.8 1.4
China 7.5 3.6 0.6 3.1 1.6 (0.5) 5.7 0.2 21.8 21.7 18.7 1.3
Japan 2.5 — 0.1 3.1 3.9 (1.9) 5.7 8.4 21.8 19.7 17.0 1.3
Australia 4.9 9.4 — 7.0 1.6 (0.6) 1.5 (2.1) 21.7 21.2 21.5 1.2
Canada 2.2 0.6 0.2 7.9 2.3 (0.9) 5.1 0.4 17.8 17.0 15.2 1.0
Taiwan 5.5 8.3 0.2 1.3 0.6 (0.1) 0.4 1.1 17.3 17.0 17.9 1.0
Poland 3.5 2.0 — 2.7 0.2 (0.1) 6.5 0.2 15.0 15.1 13.4 0.9
Jersey 6.8 — — 6.9 — (0.3) — — 13.4 13.3 12.8 0.8
United Arab
Emirates 7.6 1.3 — 3.2 0.5 (0.3) 0.1 — 12.4 11.9 12.8 0.7
Malaysia 1.4 3.9 0.1 0.8 0.2 — 1.7 0.2 8.3 8.4 8.4 0.5
Thailand 0.9 2.9 — 2.2 0.1 — 1.8 0.1 8.0 7.9 7.7 0.5
Indonesia 2.2 0.7 — 1.3 0.1 (0.1) 1.7 0.1 6.0 6.0 5.9 0.3
Russia 1.8 0.8 — 0.8 0.3 (0.1) 1.5 0.1 5.2 4.6 5.0 0.3
Luxembourg 0.8 — — — 0.4 (0.9) 4.5 0.3 5.1 6.7 4.6 0.3
Philippines 0.8 1.4 — 0.5 0.1 — 1.7 — 4.5 4.7 4.9 0.3
Czech
Republic 0.8 — — 0.7 2.3 — 0.4 0.1 4.3 3.8 4.3 0.2
South Africa 1.3 — — 0.4 0.3 — 1.8 (0.2) 3.6 3.5 3.5 0.2
Total as a % of Citi’s total exposure 35.8 %
Total as a % of Citi’s non-U.S. total exposure 91.5 %
(1) ICG loans reflect funded corporate loans and private bank loans, net of unearned income. As of December 31, 2020, private bank loans in the table above totaled
$30.1 billion, concentrated in Hong Kong ($8.2 billion), the United Kingdom ($7.9 billion) and Singapore ($7 billion).
(2) Other funded includes other direct exposures such as accounts receivable, loans HFS, other loans in Corporate/Other and investments accounted for under the
equity method.
120
(3) Unfunded exposure includes unfunded corporate lending commitments, letters of credit and other contingencies.
(4) Net mark-to-market counterparty risk on OTC derivatives and securities lending/borrowing transactions (repos). Exposures are shown net of collateral and
inclusive of CVA. Includes margin loans.
(5) Investment securities include debt securities available-for-sale, recorded at fair market value, and debt securities held-to-maturity, recorded at historical cost.
(6) Trading account assets are shown on a net basis and include issuer risk on cash products and derivative exposure where the underlying reference entity/issuer is
located in that country.
Argentina
As previously disclosed, Citi operates in Argentina through its
ICG businesses. As of December 31, 2020, Citi’s net
investment in its Argentine operations was approximately $1.0
billion. Citi uses the U.S. dollar as the functional currency for
its operations in Argentina because the Argentine economy is
considered highly inflationary under U.S. GAAP.
During August 2020, the Argentine government
announced the successful restructuring of almost all of its
foreign currency debt issued under foreign law, for which it
had previously postponed principal and interest payments.
However, during September 2020, the Argentine government
tightened its existing capital and currency controls, which
continue to restrict Citi’s ability to access U.S. dollars in
Argentina and remit earnings from its Argentine operations.
Citi’s net investment in its Argentine operations is likely
to increase as Citi generates net income in its Argentine
franchise and its earnings are unable to be remitted.
Citi economically hedges the foreign currency risk in its
net Argentine peso-denominated assets to the extent possible
and prudent using non-deliverable forward (NDF) derivative
instruments that are primarily executed outside of Argentina.
As of December 31, 2020, the international NDF market had
very limited liquidity, resulting in Citi’s being unable to
economically hedge nearly all of its Argentine peso exposure.
As a result, and to the extent that Citi does not execute NDF
contracts for this unhedged exposure in the future, Citi would
record devaluations on its net Argentine peso‑denominated
assets in earnings, without any benefit from a change in the
fair value of derivative positions used to economically hedge
the exposure.
Citi continually evaluates its economic exposure to its
Argentine counterparties and reserves for changes in credit
risk and sovereign risk associated with its Argentine assets.
Citi believes it has established appropriate allowances for
credit losses on its Argentine loans, and appropriate fair value
adjustments on Argentine assets and liabilities measured at fair
value, for such risks under U.S. GAAP as of December 31,
2020. However, U.S. regulatory agencies may require Citi to
record additional reserves in the future, increasing ICG’s cost
of credit, based on the perceived country risk associated with
its Argentine exposures. For additional information on
emerging markets risks, see “Risk Factors” above.
FFIEC—Cross-Border Claims on Third Parties and Local
Country Assets
Citi’s cross-border disclosures are based on the country
exposure bank regulatory reporting guidelines of the Federal
Financial Institutions Examination Council (FFIEC). The
following summarizes some of the FFIEC key reporting
guidelines:
• Amounts are based on the domicile of the ultimate
obligor, counterparty, collateral (only including qualifying
liquid collateral), issuer or guarantor, as applicable (e.g., a
security recorded by a Citi U.S. entity but issued by the
U.K. government is considered U.K. exposure; a loan
recorded by a Citi Mexico entity to a customer domiciled
in Mexico where the underlying collateral is held in
Germany is considered German exposure).
• Amounts do not consider the benefit of collateral received
for secured financing transactions (i.e., repurchase
agreements, reverse repurchase agreements and securities
loaned and borrowed) and are reported based on notional
amounts.
• Netting of derivative receivables and payables, reported at
fair value, is permitted, but only under a legally binding
netting agreement with the same specific counterparty,
and does not include the benefit of margin received or
hedges.
• Credit default swaps (CDS) are included based on the
gross notional amount sold and purchased and do not
include any offsetting CDS on the same underlying entity.
• Loans are reported without the benefit of hedges.
Given the requirements noted above, Citi’s FFIEC cross-
border exposures and total outstandings tend to fluctuate, in
some cases significantly, from period to period. As an
example, because total outstandings under FFIEC guidelines
do not include the benefit of margin or hedges, market
volatility in interest rates, foreign exchange rates and credit
spreads may cause significant fluctuations in the level of total
outstandings, all else being equal.
121

The tables below show each country whose total outstandings exceeded 0.75% of total Citigroup assets:
December 31, 2020
Cross-border claims on third parties and local country assets
In billions of
dollars
Banks
(a)
Public
(a)
NBFIs
(1)
(a)
Other
(corporate
and households)
(a)
Trading
assets
(2)
(included
in (a))
Short-term
claims
(2)
(included in
(a))
Total
outstanding
(3)
(sum of (a))
Commitments
and
guarantees
(4)
Credit
derivatives
purchased
(5)
Credit
derivatives
sold
(5)
United
Kingdom $ 16.0 $ 26.0 $ 55.9 $ 17.5 $ 14.2 $ 75.1 $ 115.4 $ 25.8 $ 76.2 $ 75.3
Cayman
Islands — — 85.8 12.7 8.0 70.1 98.5 11.9 0.3 0.2
Japan 32.9 35.5 12.1 6.6 16.2 63.3 87.1 6.6 16.1 15.1
Germany 7.1 51.8 11.1 9.6 11.3 58.6 79.6 14.1 49.7 48.1
Mexico 3.9 31.5 9.5 28.8 6.0 44.4 73.7 21.7 7.3 6.6
France 11.0 9.7 39.3 9.5 13.3 58.7 69.5 68.2 61.3 56.4
Singapore 2.5 25.6 10.7 17.5 2.8 48.5 56.3 13.8 1.9 1.5
South Korea 3.3 18.2 1.8 24.9 1.5 35.6 48.2 14.7 10.8 10.7
Hong Kong 1.5 13.8 3.9 19.8 7.2 35.2 39.0 13.1 2.1 1.7
Australia 5.1 16.4 4.0 13.0 9.6 31.6 38.5 13.0 5.7 5.2
China 4.5 16.3 3.3 14.1 9.7 33.6 38.2 5.8 10.5 10.0
India 1.9 14.0 2.5 12.9 2.3 22.1 31.3 11.3 1.8 1.6
Taiwan 0.4 7.8 2.0 16.5 5.1 23.7 26.7 14.1 — —
Netherlands 7.8 10.4 3.4 4.8 5.2 18.2 26.4 10.4 28.5 27.4
Brazil 2.8 11.3 1.6 9.9 5.2 20.0 25.6 2.7 6.0 6.0
Italy 2.5 19.1 0.6 1.9 15.0 16.1 24.1 2.7 42.3 41.3
Switzerland 1.8 14.3 1.4 4.9 2.6 20.1 22.4 7.3 18.0 17.4
Canada 4.5 6.3 5.9 4.5 3.4 15.1 21.2 14.5 3.9 4.0
December 31, 2019
Cross-border claims on third parties and local country assets
In billions of
dollars
Banks
(a)
Public
(a)
NBFIs
(1)
(a)
Other
(corporate
and households)
(a)
Trading
assets
(2)
(included
in (a))
Short-term
claims
(2)
(included
in (a))
Total
outstanding
(3)
(sum of (a))
Commitments
and
guarantees
(4)
Credit
derivatives
purchased
(5)
Credit
derivatives
sold
(5)
Cayman
Islands $ — $ — $ 95.5 $ 10.1 $ 5.3 $ 75.0 $ 105.6 $ 9.9 $ — $ —
United
Kingdom 13.3 25.2 35.7 20.0 12.9 61.9 94.2 23.3 71.6 71.6
Japan 32.7 33.3 8.4 6.5 13.1 58.0 80.9 4.7 18.7 17.1
Mexico 2.8 26.3 9.4 35.0 5.5 37.0 73.5 22.4 8.9 8.8
Germany 6.8 29.8 7.7 9.7 9.3 33.6 54.0 13.1 48.0 46.4
France 8.4 7.5 22.1 7.5 9.6 35.8 45.5 29.0 56.0 54.3
Singapore 2.3 17.7 7.2 16.1 2.8 38.0 43.3 12.0 2.0 1.9
South Korea 2.0 16.8 1.7 21.6 2.6 32.0 42.1 12.2 13.9 13.0
India 1.7 12.9 3.1 16.0 2.7 23.1 33.7 10.8 2.3 2.0
Hong Kong 0.6 10.2 3.0 19.9 4.1 29.9 33.7 13.7 2.2 2.0
Australia 4.8 8.7 4.7 12.9 7.9 20.6 31.1 11.8 7.4 7.3
China 3.4 11.0 3.1 12.7 3.9 25.3 30.2 5.1 12.8 11.6
Brazil 3.3 13.3 1.8 11.0 6.1 20.7 29.4 3.2 8.1 8.2
Canada 2.9 4.8 11.5 5.0 3.1 13.5 24.2 14.8 4.3 5.1
Netherlands 6.8 8.7 3.9 4.2 4.6 15.5 23.6 11.0 26.9 26.5
Taiwan 0.6 6.8 1.6 14.3 2.9 13.2 23.3 14.6 0.1 0.1
Italy 3.3 15.9 0.7 1.7 12.8 14.9 21.6 2.5 44.5 44.0
Switzerland 1.2 14.6 1.1 4.6 2.2 18.1 21.5 8.2 17.8 17.3
Ireland 0.2 0.3 8.9 5.2 4.2 12.9 14.6 5.3 1.6 1.8
(1) Non-bank financial institutions.
(2) Included in total outstanding.
(3) Total outstanding includes cross-border claims on third parties, as well as local country assets. Cross-border claims on third parties include cross-border loans,
securities, deposits with banks and other monetary assets, as well as net revaluation gains on foreign exchange and derivative products.
(4) Commitments (not included in total outstanding) include legally binding cross-border letters of credit and other commitments and contingencies as defined by the
FFIEC guidelines. The FFIEC definition of commitments includes commitments to local residents to be funded with local currency liabilities originated within the
country.
(5) Credit default swaps (CDS) are not included in total outstanding.
122
SIGNIFICANT ACCOUNTING POLICIES AND SIGNIFICANT ESTIMATES
This section contains a summary of Citi’s most significant
accounting policies. Note 1 to the Consolidated Financial
Statements contains a summary of all of Citigroup’s
significant accounting policies. These policies, as well as
estimates made by management, are integral to the
presentation of Citi’s results of operations and financial
condition. While all of these policies require a certain level of
management judgment and estimates, this section highlights
and discusses the significant accounting policies that require
management to make highly difficult, complex or subjective
judgments and estimates at times regarding matters that are
inherently uncertain and susceptible to change (see also “Risk
Factors—Operational Risks” above). Management has
discussed each of these significant accounting policies, the
related estimates and its judgments with the Audit Committee
of the Citigroup Board of Directors.
Valuations of Financial Instruments
Citigroup holds debt and equity securities, derivatives,
retained interests in securitizations, investments in private
equity and other financial instruments. Substantially all of
these assets and liabilities are reflected at fair value on Citi’s
Consolidated Balance Sheet.
Citi purchases securities under agreements to resell
(reverse repos or resale agreements) and sells securities under
agreements to repurchase (repos), a majority of which are
carried at fair value. In addition, certain loans, short-term
borrowings, long-term debt and deposits, as well as certain
securities borrowed and loaned positions that are collateralized
with cash, are carried at fair value. Citigroup holds its
investments, trading assets and liabilities, and resale and
repurchase agreements on the Consolidated Balance Sheet to
meet customer needs and to manage liquidity needs, interest
rate risks and private equity investing.
When available, Citi generally uses quoted market prices
to determine fair value and classifies such items within Level
1 of the fair value hierarchy established under ASC 820-10,
Fair Value Measurement. If quoted market prices are not
available, fair value is based upon internally developed
valuation models that use, where possible, current market-
based or independently sourced market parameters, such as
interest rates, currency rates and option volatilities. Such
models are often based on a discounted cash flow analysis. In
addition, items valued using such internally generated
valuation techniques are classified according to the lowest
level input or value driver that is significant to the valuation.
Thus, an item may be classified under the fair value hierarchy
as Level 3 even though there may be some significant inputs
that are readily observable.
Citi is required to exercise subjective judgments relating
to the applicability and functionality of internal valuation
models, the significance of inputs or value drivers to the
valuation of an instrument and the degree of illiquidity and
subsequent lack of observability in certain markets. These
judgments have the potential to impact the Company’s
financial performance for instruments where the changes in
fair value are recognized in either the Consolidated Statement
of Income or in AOCI.
Losses on available-for-sale securities whose fair values
are less than the amortized cost, where Citi intends to sell the
security or could more-likely-than-not be required to sell the
security, are recognized in earnings. Where Citi does not
intend to sell the security nor could more-likely-than-not be
required to sell the security, the portion of the loss related to
credit is recognized as an allowance for credit losses with a
corresponding provision for credit losses and the remainder of
the loss is recognized in other comprehensive income. Such
losses are capped at the difference between the fair value and
amortized cost of the security.
For equity securities carried at cost or under the
measurement alternative, decreases in fair value below the
carrying value are recognized as impairment in the
Consolidated Statement of Income. Moreover, for certain
equity method investments, decreases in fair value are only
recognized in earnings in the Consolidated Statement of
Income if such decreases are judged to be an other-than-
temporary impairment (OTTI). Adjudicating the temporary
nature of fair value impairments is also inherently judgmental.
The fair value of financial instruments incorporates the
effects of Citi’s own credit risk and the market view of
counterparty credit risk, the quantification of which is also
complex and judgmental. For additional information on Citi’s
fair value analysis, see Notes 1, 6, 24 and 25 to the
Consolidated Financial Statements.
Allowance for Credit Losses (ACL)
Citi provides reserves for an estimate of current expected
credit losses in the funded loan portfolio and for unfunded
lending commitments, standby letters of credit and financial
guarantees (excluding those that are performance guarantees),
on the Consolidated Balance Sheet in Allowance for credit
losses on loans (ACLL) and Other liabilities, respectively. In
addition, Citi provides allowances for an estimate of current
expected credit losses for other financial assets measured at
amortized cost, including held-to-maturity securities, reverse
repurchase agreements, securities borrowed, deposits with
banks and other financial receivables carried at amortized cost
(these allowances, together with the ACLL, are referred to as
the ACL).
The ACL is composed of quantitative and qualitative
components. For the quantitative component, Citi uses a
forward-looking base macroeconomic forecast that is
complemented by a qualitative management adjustment
component. As further discussed below, this qualitative
component reflects (i) economic uncertainty related to an
alternative downside scenario, (ii) loss adjustments for
concentration and collateral and (iii) specific adjustments
based on the associated portfolio for estimating the ACL.
Quantitative Component
Citi estimates expected credit losses for its quantitative
component based on (i) its internal system of credit risk
ratings, (ii) its comprehensive internal history and rating
agency information regarding default rates and loss data,
including internal data on the severity of losses in the event of
123
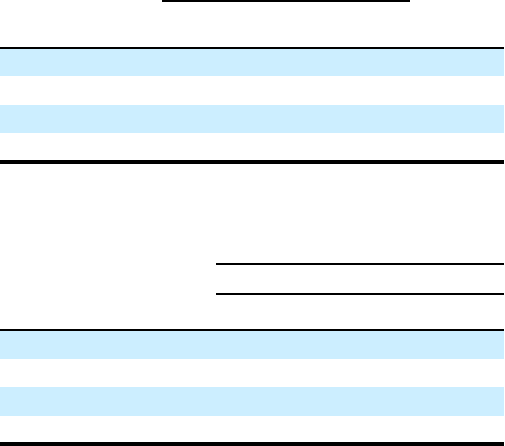
default, and (iii) a reasonable and supportable forecast of
future macroeconomic conditions.
For its consumer and corporate portfolios, Citi’s expected
credit loss is determined primarily by utilizing models for the
borrowers’ probability of default (PD), loss given default
(LGD) and exposure at default (EAD). The loss likelihood and
severity models used for estimating expected credit losses are
sensitive to changes in macroeconomic variables that inform
the forecasts. For corporate portfolios, the loss likelihood and
loss severity models cover a wide range of geographic,
industry, product and business segments that contribute to the
portfolios.
In addition, Citi’s delinquency-managed portfolios
containing smaller-balance homogeneous loans also primarily
use PD, LGD and EAD models to determine expected credit
losses and reserve balances based on leading credit indicators,
including loan delinquencies and changes in portfolio size, as
well as other current economic factors and credit trends,
including housing prices, unemployment and gross domestic
product (GDP). This methodology is applied separately for
each product within each geographic region in which these
portfolios exist, including the U.S., Mexico and Asia.
This evaluation process is subject to numerous estimates
and judgments. The frequency of default, risk ratings, loss
recovery rates, size and diversity of individual large credits
and ability of borrowers with foreign currency obligations to
obtain the foreign currency necessary for orderly debt
servicing, among other things, are all taken into account.
Changes in these estimates could have a direct impact on
Citi’s credit costs and the allowance in any period.
Qualitative Management Adjustment Component
The qualitative management adjustment component considers,
among other things, the uncertainty of forward-looking
economic scenarios based on the likelihood and severity of a
downside scenario, certain portfolio characteristics and
concentrations, collateral coverage, model limitations,
idiosyncratic events and other relevant criteria under banking
supervisory guidance for the ACL. In the current
macroeconomic environment, the qualitative management
adjustment also reflects the uncertainty around the estimated
impact of the pandemic on credit loss estimates.
4Q20 Combined Quantitative and Qualitative Components
In the fourth quarter of 2020, Citi (i) released $0.2 billion of
the ACL for its consumer portfolios and (ii) released $1.3
billion of the ACL for its corporate portfolios, primarily driven
by an improvement in the base macroeconomic forecast.
In the fourth quarter, the qualitative management
adjustment component incorporated an alternative downside
scenario, reflecting more adverse economic conditions
and, subsequently a slower Real GDP recovery, at a 15%
likelihood. This qualitative management adjustment
component contributed to an increase in the ACL of
approximately $0.7 billion resulting in a total qualitative
management adjustment of $3.8 billion and an overall ACL
balance of $27.8 billion at December 31, 2020.
The extent of the pandemic’s ultimate impact on Citi’s
ACL will depend on, among other things, (i) how consumers
respond to the government stimulus and assistance programs;
(ii) the impact on unemployment; (iii) the timing and extent of
the economic recovery; (iv) the severity and duration of the
resurgence of COVID-19; (v) the rate of distribution and
administration of vaccines; and (vi) the extent of any market
volatility. Citi believes its analysis of the ACL reflects the
forward view of the economic analysis as of December 31,
2020, based on its November 5, 2020 base macroeconomic
forecast.
Macroeconomic Variables
Citi uses a multitude of variables in its base macroeconomic
forecast as part of its calculation of both the quantitative and
qualitative (including the downside scenario) components of
the ACL, including both domestic and international variables
for its global portfolios and exposures. Citi’s forecasts of the
U.S. unemployment rate and U.S. Real GDP rate represent the
key macroeconomic variables that most significantly affect its
estimate of its consumer and corporate ACLs.
The tables below show these macroeconomic variables
used in determining Citi’s 1Q20, 2Q20, 3Q20 and 4Q20
consumer and corporate ACLs, comparing Citi’s forecasted
1Q21, 3Q21 and 1Q22 quarterly average U.S. unemployment
rate and Citi’s forecasted 2020, 2021 and 2022 year-over-year
U.S. Real GDP growth rate:
Quarterly average
U.S. unemployment 1Q21 3Q21 1Q22
13-quarter
average
(1)
Citi forecast at 1Q20 6.9 % 6.6 % 6.3 % 6.1 %
Citi forecast at 2Q20 8.1 6.3 5.8 7.2
Citi forecast at 3Q20 8.2 6.8 6.3 6.6
Citi forecast at 4Q20 7.3 6.5 6.2 6.1
(1) Represents the average unemployment rate for the rolling, forward-
looking 13 quarters in forecast horizon.
Year-over-year growth rate
(1)
Full year
U.S. Real GDP 2020 2021 2022
Citi forecast at 1Q20 (1.3) % 1.5 % 1.9 %
Citi forecast at 2Q20 (5.1) 5.5 3.3
Citi forecast at 3Q20 (5.1) 3.3 2.8
Citi forecast at 4Q20 (4.0) 3.7 2.7
(1) The year-over-year growth rate is the percentage change in the Real
(inflation adjusted) GDP level.
Under the base macroeconomic forecast as of 4Q20, the
U.S. unemployment rate and Real GDP growth rate are
expected to continue to improve, as the U.S. moves past the
peak of the pandemic-related health and economic crisis.
Consumer
As discussed above, Citi’s total consumer ACL release
(including Corporate/Other) of $0.2 billion in the fourth
quarter of 2020 reduced the ACL balance to $19.6 billion, or
6.77% of total consumer loans at December 31, 2020, and
reflected the update of the base macroeconomic forecast for
the fourth quarter, as well as changes in loan volumes. Citi’s
consumer ACL is largely driven by the cards businesses,
124
where the receivables have longer estimated tenors under the
CECL lifetime expected credit loss methodology, net of
recoveries, than under the previous incurred loss model.
For cards, including Citi’s international businesses, the
level of reserves relative to EOP loans decreased to 10.98% at
December 31, 2020, compared to 11.42% at September 30,
2020, primarily due to the update of the base macroeconomic
forecast for the fourth quarter of 2020. For the remaining
consumer exposures, the level of reserves relative to EOP
loans decreased slightly to 2.0% at December 31, 2020,
compared to 2.1% at September 30, 2020.
Corporate
Citi’s corporate ACLL release of $1.6 billion in the fourth
quarter of 2020 reduced the ACLL reserve balance to
$5.4 billion, or 1.42% of total funded loans, and reflected the
update of the macroeconomic forecast scenario for the fourth
quarter, as well as fewer downgrades in the portfolio.
The ACLUC build of $0.4 billion in the fourth quarter of
2020 increased the total corporate ACLUC reserve balance
included in Other liabilities to $2.7 billion at December 31,
2020.
ACLL and Non-accrual Ratios
At December 31, 2020, the ratio of the ACLL to total funded
loans was 3.73% (6.77% for consumer loans and 1.42% for
corporate loans), compared to 4.00% at September 30, 2020
(6.96% for consumer loans and 1.82% for corporate loans).
Citi’s total non-accrual loans were $5.7 billion at
December 31, 2020, up $394 million from September 30,
2020. Consumer non-accrual loans increased $451 million to
$2.1 billion at December 31, 2020, from $1.7 billion at
September 30, 2020, while corporate non-accrual loans
decreased $57 million to $3.5 billion at December 31, 2020,
from $3.6 billion at September 30, 2020. In addition, the ratio
of corporate non-accrual loans to total corporate loans was
0.91%, and the ratio of consumer non-accrual loans to total
consumer loans was 0.74%, at December 31, 2020.
Regulatory Capital Impact
Citi has elected to phase in the CECL impact for regulatory
capital purposes. The transition provisions were recently
modified to defer the phase-in. After two years with no impact
on capital, the CECL transition impact will phase in over a
three-year transition period with 25% of the impact (net of
deferred taxes) recognized on the first day of each subsequent
year, commencing January 1, 2022, and will be fully
implemented on January 1, 2025. In addition, 25% of the build
(pretax) made in 2020 and 2021 will be deferred and
amortized over the same timeframe.
For a further description of the ACL and related accounts,
see Notes 1 and 15 to the Consolidated Financial Statements.
For a discussion of the adoption of the CECL accounting
pronouncement, see Note 1 to the Consolidated Financial
Statements.
Goodwill
Citi tests goodwill for impairment annually on July 1 (the
annual test) and through interim assessments between annual
tests if an event occurs or circumstances change that would
more-likely-than-not reduce the fair value of a reporting unit
below its carrying amount, such as a significant adverse
change in the business climate, a decision to sell or dispose of
all or a significant portion of a reporting unit or a significant
decline in Citi’s stock price. During 2020, the annual test was
performed, which resulted in no goodwill impairment as
described in Note 16 to the Consolidated Financial Statements.
As of December 31, 2020, Citigroup’s activities are
conducted through the Global Consumer Banking and
Institutional Clients Group business segments and Corporate/
Other. Goodwill impairment testing is performed at the level
below the business segment (referred to as a reporting unit).
Citi utilizes allocated equity as a proxy for the carrying
value of its reporting units for purposes of goodwill
impairment testing. The allocated equity in the reporting units
is determined based on the capital the business would require
if it were operating as a standalone entity, incorporating
sufficient capital to be in compliance with both current and
expected regulatory capital requirements, including capital for
specifically identified goodwill and intangible assets. The
capital allocated to the businesses is incorporated into the
annual budget process, which is approved by Citi’s Board of
Directors.
Goodwill impairment testing involves management
judgment, requiring an assessment of whether the carrying
value of the reporting unit can be supported by the fair value
of the reporting unit using widely accepted valuation
techniques, such as the market approach (earnings multiples
and/or transaction multiples) and/or the income approach
(discounted cash flow (DCF) method). In applying these
methodologies, Citi utilizes a number of factors, including
actual operating results, future business plans, economic
projections and market data.
Similar to 2019, Citigroup engaged an independent
valuation specialist in 2020 to assist in Citi’s valuation for all
the reporting units with goodwill balances, employing both the
market approach and the DCF method. The resulting fair
values were relatively consistent and appropriate weighting
was given to outputs from both methods.
Under the market approach and in calculation of the
terminal value under the income approach, the key
assumptions are the selected price to earnings and price to
tangible book value multiples. The selection of the multiples
considers the operating performance and financial condition of
the reporting units as compared with those of a group of
selected publicly traded guideline companies. Among other
factors, the level and expected growth in return on tangible
equity relative to those of the guideline companies is
considered. Since the guideline company prices used are on a
minority interest basis, the selection of the multiples considers
recent transactions prices, as well as data in comparable
macroeconomic environments, which reflect control rights and
privileges, in arriving at a multiple that reflects an appropriate
control premium.
For valuation under the income approach, the key
assumptions used are the cash flows for the forecasted period,
the terminal growth rate and the discount rate. The cash flows
for the forecasted period are estimated based on management’s
most recent projections available as of the testing date, given
125
consideration to minimum equity capital requirement. The
projections incorporate macroeconomic variables developed at
the same time. The terminal growth rate is selected based on
management’s long-term expectation for the businesses. The
discount rate is based on the reporting unit’s estimated cost of
equity capital computed under the capital asset pricing model
and reflects the risk and uncertainty in the financial markets in
the internally generated cash flow projections.
Since none of the Company’s reporting units are publicly
traded, individual reporting unit fair value determinations
cannot be directly correlated to Citigroup’s common stock
price. The sum of the fair values of the reporting units
exceeded the overall market capitalization of Citi as of July 1,
2020. However, Citi believes that it is not meaningful to
reconcile the sum of the fair values of the Company’s
reporting units to its market capitalization due to several
factors. The market capitalization of Citigroup reflects the
execution risk in a transaction involving Citigroup due to its
size. However, the individual reporting units’ fair values are
not subject to the same level of execution risk nor a business
model that is perceived to be as complex. In addition, the
market capitalization of Citigroup does not include
consideration of the individual reporting unit’s control
premium.
At July 1, 2020, the fair values of Citi’s reporting units as
a percentage of their carrying values ranged from
approximately 115% to 136%, resulting in no impairment.
While the inherent risk related to uncertainty is embedded in
the key assumptions used in the valuations, the current
environment continues to evolve due to the challenge and
uncertainties related to the pandemic. Further deterioration in
macroeconomic and market conditions, including potential
adverse effects to economic forecasts due to the severity and
duration of the pandemic, as well as the responses of
governments, customers and clients, could negatively
influence the assumptions used in the valuations, in particular,
the discount rates, exit multiples and growth rates used in net
income projections. If the future were to differ from
management’s best estimate of key assumptions (e.g., net
interest revenue and loan volume), and associated cash flows
were to decrease, Citi could potentially experience material
goodwill impairment charges in the future.
See Notes 1 and 16 to the Consolidated Financial
Statements for additional information on goodwill, including
the changes in the goodwill balance year-over-year and the
segments’ goodwill balances as of December 31, 2020.
Income Taxes
Overview
Citi is subject to the income tax laws of the U.S., its states and
local municipalities and the non-U.S. jurisdictions in which
Citi operates. These tax laws are complex and are subject to
differing interpretations by the taxpayer and the relevant
governmental taxing authorities. Disputes over interpretations
of the tax laws may be subject to review and adjudication by
the court systems of the various tax jurisdictions or may be
settled with the taxing authority upon audit.
In establishing a provision for income tax expense, Citi
must make judgments and interpretations about the application
of these inherently complex tax laws. Citi must also make
estimates about when in the future certain items will affect
taxable income in the various tax jurisdictions, both domestic
and foreign. Deferred taxes are recorded for the future
consequences of events that have been recognized in the
financial statements or tax returns, based upon enacted tax
laws and rates. Deferred tax assets (DTAs) are recognized
subject to management’s judgment that realization is more-
likely-than-not. For example, if it is more-likely-than-not that
a carry-forward would expire unused, Citi would set up a
valuation allowance against that DTA. Citi has established
valuation allowances as described below.
As a result of the Tax Cuts and Jobs Act (Tax Reform),
beginning in 2018, Citi is taxed on income generated by its
U.S. operations at a federal tax rate of 21%. The effect on
Citi’s state tax rate is dependent upon how and when the
individual states that have not yet addressed the federal tax
law changes choose to adopt the various new provisions of the
U.S. Internal Revenue Code.
Citi’s non-U.S. branches and subsidiaries are subject to
tax at their local tax rates. Non-U.S. branches also continue to
be subject to U.S. taxation. The impact of this on Citi’s
earnings depends on the level of branch pretax income, the
local branch tax rate and allocations of overall domestic loss
(ODL) and expenses for U.S. tax purposes to branch earnings.
Citi expects no residual U.S. tax on such earnings since it
currently has sufficient branch tax carry-forwards. With
respect to non-U.S. subsidiaries, dividends from these
subsidiaries will be excluded from U.S. taxation. While the
majority of Citi’s non-U.S. subsidiary earnings are classified
as Global Intangible Low Taxed Income (GILTI), Citi expects
no material residual U.S. tax on such earnings based on its
non-U.S. subsidiaries’ local tax rates, which exceed, on
average, the GILTI tax rate. Finally, Citi does not expect the
Base Erosion Anti-Abuse Tax (BEAT) to affect its tax
provision.
Deferred Tax Assets and Valuation Allowances
At December 31, 2020, Citi had net DTAs of $24.8 billion,
unchanged from September 30, 2020. Citi’s net DTAs
increased $1.7 billion from $23.1 billion at December 31,
2019, primarily due to an increase in the ACL and adoption
impact of the CECL standard, partially offset by gains in
AOCI. Of Citi’s total net DTAs of $24.8 billion as of
December 31, 2020, $9.5 billion, primarily related to tax
carry-forwards, was excluded in calculating Citi’s regulatory
capital. Net DTAs arising from temporary differences are
deducted from regulatory capital if in excess of the 10%/15%
limitations (see “Capital Resources” above). For the quarter
and year ended December 31, 2020, Citi did not have any such
DTAs. Accordingly, the remaining $15.3 billion of net DTAs
as of December 31, 2020 was not deducted in calculating
regulatory capital pursuant to Basel III standards, and was
appropriately risk weighted under those rules.
Citi’s total valuation allowance (VA) at December 31,
2020 was $5.2 billion, a decrease of $1.3 billion from $6.5
billion at December 31, 2019, primarily driven by usage of
carry-forwards in the FTC branch basket. Citi’s VA of $5.2
billion is composed of (i) $3.4 billion on its FTC carry-
forwards, (ii) $1.0 billion on its U.S. residual DTA related to
126
its non-U.S. branches, (iii) $0.6 billion on local non-U.S.
DTAs and (iv) $0.2 billion on state net operating loss and
capital loss carry-forwards.
As stated above with regard to the impact of non-U.S.
branches on Citi’s earnings, the level of branch pretax income,
the local branch tax rate and the allocations of ODL and
expenses for U.S. tax purposes to the branch basket are also
the main factors in determining the branch VA. Citi computed
these factors for 2020. While the COVID-19 pandemic
reduced branch earnings, the allocated ODL did not decline
since a large portion of the pandemic losses will not be
recognizable for U.S. taxable income until a future period. In
addition, lower than forecasted U.S. interest rates resulted in a
lower allocation of interest expense to non-U.S. branches. The
combination of these factors drove the VA release of $0.5
billion in Citi’s full-year effective tax rate. Citi also released
$0.1 billion of branch basket VA in the fourth quarter, with
respect to future years based upon Citi’s operating plan and
estimates of future branch basket factors, as discussed above.
Citi’s VA of $1.0 billion against FTC carry-forwards in
its general basket declined $0.1 billion in 2020, primarily due
to expired FTCs. In the general FTC basket, foreign source
income, an important driver in the utilization of FTC carry-
forwards for the current year and future years in the carry-
forward period, has been reduced due to the compression in
interest rate spreads. Overall U.S. taxable income, which
impacts ODL usage and, correspondingly, the utilization of
FTC carry-forwards is also lower because of the impacts of the
pandemic. Accordingly, management has taken actions to
increase future foreign source income and U.S. taxable
income. These planning actions include geographic asset
movements, deferral of future FTC recognition and
capitalization of expenses for tax purposes, resulting in no tax
provision change to Citi’s general basket VA in 2020. In light
of the pandemic, Citi will continue to monitor its forecasts and
mix of earnings, which could affect Citi’s VA against FTC
carry-forwards. Citi continues to look for additional actions
that are prudent and feasible, taking into account client,
regulatory and operational considerations. See Note 9 to the
Consolidated Financial Statements.
Recognized FTCs comprised approximately $4.4 billion
of Citi’s DTAs as of December 31, 2020, compared to
approximately $6.3 billion as of December 31, 2019. The
decrease was primarily due to current-year usage. The FTC
carry-forward period represents the most time-sensitive
component of Citi’s DTAs.
Citi had an overall domestic loss (ODL) of approximately
$26 billion at December 31, 2020, which allows Citi to elect a
percentage between 50% and 100% of future years’ domestic
source income to be reclassified as foreign source income.
(See Note 9 to the Consolidated Financial Statements for a
description of the ODL.)
The majority of Citi’s U.S. federal net operating loss
carry-forward and all of its New York State and City net
operating loss carry-forwards are subject to a carry-forward
period of 20 years. This provides enough time to fully utilize
the net DTAs pertaining to these existing net operating loss
carry-forwards. This is due to Citi’s forecast of sufficient U.S.
taxable income and the continued taxation of Citi’s non-U.S.
income by New York State and City.
Although realization is not assured, Citi believes that the
realization of its recognized net DTAs of $24.8 billion at
December 31, 2020 is more-likely-than-not, based on
management’s expectations as to future taxable income in the
jurisdictions in which the DTAs arise, as well as available tax
planning strategies (as defined in ASC Topic 740, Income
Taxes). Citi has concluded that it has the necessary positive
evidence to support the realization of its net DTAs after taking
its valuation allowances into consideration.
For additional information on Citi’s income taxes,
including its income tax provision, tax assets and liabilities
and a tabular summary of Citi’s net DTAs balance as of
December 31, 2020 (including the FTCs and applicable
expiration dates of the FTCs), see Note 9 to the Consolidated
Financial Statements. For information on Citi’s ability to use
its DTAs, see “Risk Factors—Strategic Risks” above and Note
9 to the Consolidated Financial Statements.
Tax Cuts and Jobs Act
On December 22, 2017, Tax Reform was signed into law,
reflecting changes to U.S. corporate taxation, including a
lower statutory tax rate of 21%, a quasi-territorial regime and
a deemed repatriation of all accumulated earnings and profits
of foreign subsidiaries. The new law was generally effective
January 1, 2018.
Citi recorded a one-time, non-cash charge to continuing
operations of $22.6 billion in the fourth quarter of 2017,
composed of (i) a $12.4 billion remeasurement due to the
reduction of the U.S. corporate tax rate and the change to a
“quasi-territorial tax system,” (ii) a $7.9 billion valuation
allowance against Citi’s FTC carry-forwards and its U.S.
residual DTAs related to its non-U.S. branches and (iii) a $2.3
billion reduction in Citi’s FTC carry-forwards related to the
deemed repatriation of undistributed earnings of non-U.S.
subsidiaries. Of this one-time charge, $16.4 billion was
considered provisional pursuant to Staff Accounting Bulletin
(SAB) 118.
Citi completed its accounting for Tax Reform under SAB
118 during the fourth quarter of 2018 and recorded a one-time,
non-cash tax benefit of $94 million in Corporate/Other,
related to amounts that were considered provisional pursuant
to SAB 118.
127
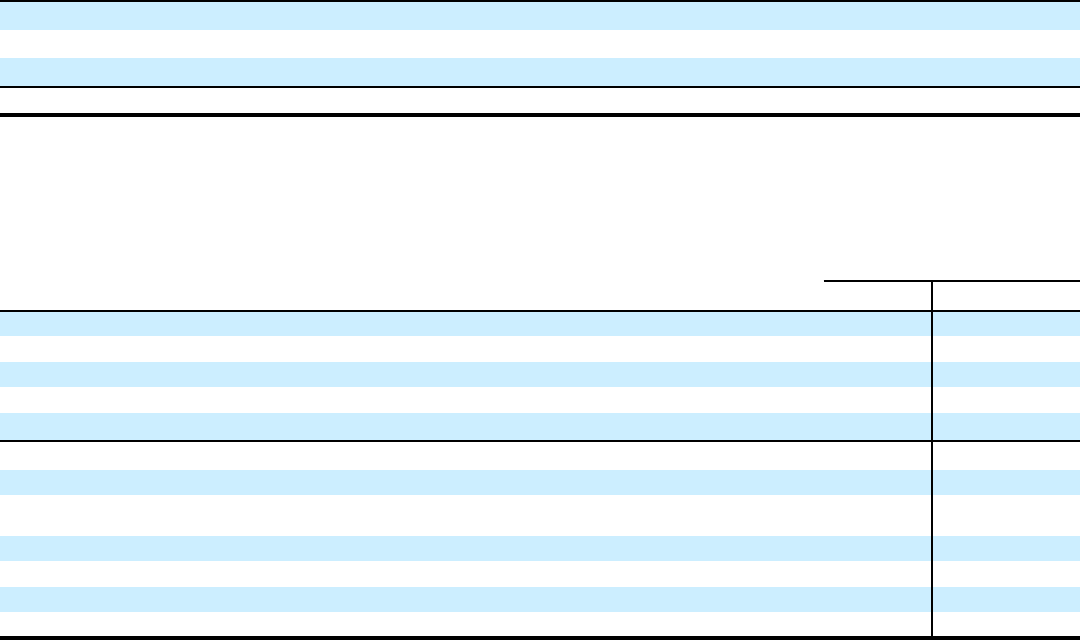
The table below details the fourth quarter of 2018 changes to Citi’s provisional impact from Tax Reform:
Provisional Impact of Tax Reform
In billions of dollars
Provisional amounts
included in the
2017 Form 10-K
SAB 118 impact to fourth
quarter of 2018
tax provision
Quasi-territorial tax system $ 6.2 $ 0.2
Valuation allowance 7.9 (1.2)
Deemed repatriation 2.3 0.9
Total of provisional items $ 16.4 $ (0.1)
2017 Impact of Tax Reform
The table below discloses the as-reported GAAP results for 2018 and 2017, as well as the 2017 adjusted results excluding the one-time
2017 impact of Tax Reform. The table below does not reflect any adjustment to 2018 results.
In millions of dollars, except per share amounts and
as otherwise noted
2018
as
reported
(1)
2017
as reported
2017 one-time
impact of
Tax Reform
2017
adjusted
results
(2)
2018 increase (decrease)
vs. 2017 ex-Tax Reform
$ Change % Change
Net income $ 18,045 $ (6,798) $ (22,594) $ 15,796 $ 2,249 14 %
Diluted earnings per share:
Income from continuing operations 6.69 (2.94) (8.31) 5.37 1.32 25
Net income 6.68 (2.98) (8.31) 5.33 1.35 25
Effective tax rate 22.8 % 129.1 % (9,930) bps 29.8 % (700) bps
Performance and other metrics:
Return on average assets 0.94 % (0.36) % (120) bps 0.84 % 10 bps
Return on average common stockholders’
equity 9.4 (3.9) (1,090) 7.0 240
Return on average total stockholders’ equity 9.1 (3.0) (1,000) 7.0 210
Return on average tangible common equity 11.0 (4.6) (1,270) 8.1 290
Dividend payout ratio 23.1 (32.2) (5,020) 18.0 510
Total payout ratio 109.1 (213.9) (33,140) 117.5 840
(1) 2018 includes the one-time benefit of $94 million, due to the finalization of the provisional component of the impact based on Citi’s analysis as well as additional
guidance received from the U.S. Treasury Department related to Tax Reform, which impacted the tax line within Corporate/Other.
(2) 2017 excludes the one-time impact of Tax Reform.
Litigation Accruals
See the discussion in Note 27 to the Consolidated Financial
Statements for information regarding Citi’s policies on
establishing accruals for litigation and regulatory
contingencies.
128
DISCLOSURE CONTROLS AND
PROCEDURES
Citi’s disclosure controls and procedures are designed to
ensure that information required to be disclosed under the
Securities Exchange Act of 1934, as amended, is recorded,
processed, summarized and reported within the time periods
specified in the SEC’s rules and forms, including without
limitation that information required to be disclosed by Citi in
its SEC filings is accumulated and communicated to
management, including the Chief Executive Officer (CEO)
and Chief Financial Officer (CFO), as appropriate, to allow for
timely decisions regarding required disclosure.
Citi’s Disclosure Committee assists the CEO and CFO in
their responsibilities to design, establish, maintain and
evaluate the effectiveness of Citi’s disclosure controls and
procedures. The Disclosure Committee is responsible for,
among other things, the oversight, maintenance and
implementation of the disclosure controls and procedures,
subject to the supervision and oversight of the CEO and CFO.
Citi’s management, with the participation of its CEO and
CFO, has evaluated the effectiveness of Citigroup’s disclosure
controls and procedures (as defined in Rule 13a-15(e) under
the Securities Exchange Act of 1934) as of December 31,
2020. Based on that evaluation, the CEO and CFO have
concluded that at that date Citigroup’s disclosure controls and
procedures were effective.
129
MANAGEMENT’S ANNUAL REPORT ON INTERNAL CONTROL OVER FINANCIAL
REPORTING
Citi’s management is responsible for establishing and
maintaining adequate internal control over financial reporting.
Citi’s internal control over financial reporting is designed to
provide reasonable assurance regarding the reliability of its
financial reporting and the preparation of financial statements
for external reporting purposes in accordance with U.S.
generally accepted accounting principles. Citi’s internal
control over financial reporting includes those policies and
procedures that (i) pertain to the maintenance of records that in
reasonable detail accurately and fairly reflect the transactions
and dispositions of Citi’s assets, (ii) provide reasonable
assurance that transactions are recorded as necessary to permit
preparation of financial statements in accordance with
generally accepted accounting principles and that Citi’s
receipts and expenditures are made only in accordance with
authorizations of Citi’s management and directors and (iii)
provide reasonable assurance regarding prevention or timely
detection of unauthorized acquisition, use or disposition of
Citi’s assets that could have a material effect on its financial
statements.
Because of its inherent limitations, internal control over
financial reporting may not prevent or detect all
misstatements. Also, projections of any evaluation of
effectiveness to future periods are subject to the risk that
controls may become inadequate because of changes in
conditions or that the degree of compliance with the policies
or procedures may deteriorate.
Citi’s management assessed the effectiveness of
Citigroup’s internal control over financial reporting as of
December 31, 2020 based on the criteria set forth by the
Committee of Sponsoring Organizations of the Treadway
Commission (COSO) in Internal Control—Integrated
Framework (2013). Based on this assessment, management
believes that, as of December 31, 2020, Citi’s internal control
over financial reporting was effective. In addition, there were
no changes in Citi’s internal control over financial reporting
during the fiscal quarter ended December 31, 2020 that
materially affected, or are reasonably likely to materially
affect, Citi’s internal control over financial reporting.
The effectiveness of Citi’s internal control over financial
reporting as of December 31, 2020 has been audited by
KPMG LLP, Citi’s independent registered public accounting
firm, as stated in their report below, which expressed an
unqualified opinion on the effectiveness of Citi’s internal
control over financial reporting as of December 31, 2020.
130
FORWARD-LOOKING STATEMENTS
Certain statements in this Form 10-K, including but not
limited to statements included within the Management’s
Discussion and Analysis of Financial Condition and Results of
Operations, are “forward-looking statements” within the
meaning of the rules and regulations of the SEC. In addition,
Citigroup also may make forward-looking statements in its
other documents filed or furnished with the SEC, and its
management may make forward-looking statements orally to
analysts, investors, representatives of the media and others.
Generally, forward-looking statements are not based on
historical facts but instead represent Citigroup’s and its
management’s beliefs regarding future events. Such
statements may be identified by words such as believe, expect,
anticipate, intend, estimate, may increase, may fluctuate, target
and illustrative, and similar expressions or future or
conditional verbs such as will, should, would and could.
Such statements are based on management’s current
expectations and are subject to risks, uncertainties and changes
in circumstances. Actual results and capital and other financial
conditions may differ materially from those included in these
statements due to a variety of factors, including without
limitation (i) the precautionary statements included within
each individual business’s discussion and analysis of its results
of operations and (ii) the factors listed and described under
“Risk Factors” above.
Any forward-looking statements made by or on behalf of
Citigroup speak only as to the date they are made, and Citi
does not undertake to update forward-looking statements to
reflect the impact of circumstances or events that arise after
the forward-looking statements were made.
131

REPORT OF INDEPENDENT REGISTERED PUBLIC ACCOUNTING FIRM
To the Stockholders and Board of Directors
Citigroup Inc.:
Opinions on the Consolidated Financial Statements and
Internal Control Over Financial Reporting
We have audited the accompanying consolidated balance
sheets of Citigroup Inc. and subsidiaries (the Company) as of
December 31, 2020 and 2019, the related consolidated
statements of income, comprehensive income, changes in
stockholders’ equity, and cash flows for each of the years in
the three-year period ended December 31, 2020, and the
related notes (collectively, the consolidated financial
statements). We also have audited the Company’s internal
control over financial reporting as of December 31, 2020,
based on criteria established in Internal Control – Integrated
Framework (2013) issued by the Committee of Sponsoring
Organizations of the Treadway Commission.
In our opinion, the consolidated financial statements
referred to above present fairly, in all material respects, the
financial position of the Company as of December 31, 2020
and 2019, and the results of its operations and its cash flows
for each of the years in the three-year period ended December
31, 2020, in conformity with U.S. generally accepted
accounting principles. Also in our opinion, the Company
maintained, in all material respects, effective internal control
over financial reporting as of December 31, 2020 based on
criteria established in Internal Control – Integrated Framework
(2013) issued by the Committee of Sponsoring Organizations
of the Treadway Commission.
Change in Accounting Principle
As discussed in Note 1 to the consolidated financial
statements, the Company has changed its method of
accounting for the recognition and measurement of credit
losses as of January 1, 2020 due to the adoption of ASC Topic
326, Financial Instruments - Credit Losses.
Basis for Opinions
The Company’s management is responsible for these
consolidated financial statements, for maintaining effective
internal control over financial reporting, and for its assessment
of the effectiveness of internal control over financial reporting,
included in the accompanying management's annual report on
internal control over financial reporting. Our responsibility is
to express an opinion on the Company’s consolidated financial
statements and an opinion on the Company’s internal control
over financial reporting based on our audits. We are a public
accounting firm registered with the Public Company
Accounting Oversight Board (United States) (PCAOB) and
are required to be independent with respect to the Company in
accordance with the U.S. federal securities laws and the
applicable rules and regulations of the Securities and
Exchange Commission and the PCAOB.
We conducted our audits in accordance with the standards
of the PCAOB. Those standards require that we plan and
perform the audits to obtain reasonable assurance about
whether the consolidated financial statements are free of
material misstatement, whether due to error or fraud, and
whether effective internal control over financial reporting was
maintained in all material respects.
Our audits of the consolidated financial statements
included performing procedures to assess the risks of material
misstatement of the consolidated financial statements, whether
due to error or fraud, and performing procedures that respond
to those risks. Such procedures included examining, on a test
basis, evidence regarding the amounts and disclosures in the
consolidated financial statements. Our audits also included
evaluating the accounting principles used and significant
estimates made by management, as well as evaluating the
overall presentation of the consolidated financial statements.
Our audit of internal control over financial reporting included
obtaining an understanding of internal control over financial
reporting, assessing the risk that a material weakness exists,
and testing and evaluating the design and operating
effectiveness of internal control based on the assessed risk.
Our audits also included performing such other procedures as
we considered necessary in the circumstances. We believe that
our audits provide a reasonable basis for our opinions.
Definition and Limitations of Internal Control Over Financial
Reporting
A company’s internal control over financial reporting is a
process designed to provide reasonable assurance regarding
the reliability of financial reporting and the preparation of
financial statements for external purposes in accordance with
generally accepted accounting principles. A company’s
internal control over financial reporting includes those policies
and procedures that (1) pertain to the maintenance of records
that, in reasonable detail, accurately and fairly reflect the
transactions and dispositions of the assets of the company; (2)
provide reasonable assurance that transactions are recorded as
necessary to permit preparation of financial statements in
accordance with generally accepted accounting principles, and
that receipts and expenditures of the company are being made
only in accordance with authorizations of management and
directors of the company; and (3) provide reasonable
assurance regarding prevention or timely detection of
unauthorized acquisition, use, or disposition of the company’s
assets that could have a material effect on the financial
statements.
Because of its inherent limitations, internal control over
financial reporting may not prevent or detect misstatements.
Also, projections of any evaluation of effectiveness to future
periods are subject to the risk that controls may become
inadequate because of changes in conditions, or that the degree
of compliance with the policies or procedures may deteriorate.
132
Critical Audit Matters
The critical audit matters communicated below are matters
arising from the current period audit of the consolidated
financial statements that were communicated or required to be
communicated to the audit committee and that: (1) relate to
accounts or disclosures that are material to the consolidated
financial statements and (2) involved our especially
challenging, subjective, or complex judgments. The
communication of critical audit matters does not alter in any
way our opinion on the consolidated financial statements,
taken as a whole, and we are not, by communicating the
critical audit matters below, providing separate opinions on
the critical audit matters or on the accounts or disclosures to
which they relate.
Assessment of the fair value of Level 3 assets and
liabilities measured on a recurring basis
As described in Notes 1, 24 and 25 to the consolidated
financial statements, the Company’s assets and liabilities
recorded at fair value on a recurring basis were $918.1
billion and $308.8. billion, respectively at December 31,
2020. The Company estimated the fair value of Level 3
assets and liabilities measured on a recurring basis ($16.1
billion and $36.0 billion, respectively at December 31,
2020) utilizing various valuation techniques with one or
more significant inputs or significant value drivers being
unobservable including, but not limited to, complex
internal valuation models, alternative pricing procedures
or comparables analysis and discounted cash flows.
We identified the assessment of the measurement of
fair value for Level 3 assets and liabilities recorded at fair
value on a recurring basis as a critical audit matter. A high
degree of audit effort, including specialized skills and
knowledge, and subjective and complex auditor judgment
was involved in the assessment of the Level 3 fair values
due to measurement uncertainty. Specifically, the
assessment encompassed the evaluation of the fair value
methodology, including methods, models and significant
assumptions and inputs used to estimate fair value.
Significant assumptions and inputs include interest rate,
price, yield, credit spread, volatilities, correlations and
forward prices. The assessment also included an
evaluation of the conceptual soundness and performance
of the valuation models.
The following are the primary procedures we
performed to address this critical audit matter. We
involved valuation professionals with specialized skills
and knowledge who assisted in evaluating the design and
testing the operating effectiveness of certain internal
controls related to the Company’s Level 3 fair value
measurements including controls over:
• valuation methodologies, including significant inputs
and assumptions
• independent price verification
• evaluating that significant model assumptions and
inputs reflected those which a market participant
would use to determine an exit price in the current
market environment
• the valuation models used were mathematically
accurate and appropriate to value the financial
instruments
• relevant information used within the Company’s
models that was reasonably available was considered
in the fair value determination.
We evaluated the Company’s methodology for
compliance with U.S. generally accepted accounting
principles. We involved valuation professionals with
specialized skills and knowledge who assisted in
developing an independent fair value estimate for a
selection of certain Level 3 assets and liabilities recorded
at fair value on a recurring basis based on independently
developed valuation models and assumptions, as
applicable, using market data sources we determined to be
relevant and reliable and compared our independent
expectation to the Company’s fair value measurements.
Assessment of the allowance for credit losses collectively
evaluated for impairment
As discussed in Note 1 to the consolidated financial
statements, the Company adopted ASU No. 2016-13,
Financial Instruments – Credit Losses (ASC 326) as of
January 1, 2020. As discussed in Notes 1 and 15 to the
consolidated financial statements, the Company’s
allowance for credit losses related to loans and unfunded
lending commitments collectively evaluated for
impairment (the collective ACLL) was $27.6 billion as of
December 31, 2020. The expected credit losses for the
quantitative component of the collective ACLL is the
product of multiplying the probability of default (PD),
loss given default (LGD), and exposure at default (EAD)
for consumer and corporate loans. For consumer credit
cards, the Company uses the payment rate approach over
the life of the loan, which leverages payment rate curves,
to determine the payments that should be applied to
liquidate the end-of-period balance in the estimation of
EAD. For unconditionally cancelable accounts, reserves
are based on the expected life of the balance as of the
evaluation date and do not include any undrawn
commitments that are unconditionally cancelable. The
Company’s models utilize a single forward-looking
macroeconomic forecast and macroeconomic assumptions
over reasonable and supportable forecast periods.
Reasonable and supportable forecast periods vary by
product. For consumer loan models, the Company uses a
13-quarter reasonable and supportable period and reverts
to historical loss experience thereafter. For corporate loan
models, the Company uses a nine-quarter reasonable and
supportable period followed by a three-quarter transition
to historical loss experience. Additionally, for consumer
loans, these models consider leading credit indicators
including loan delinquencies, as well as economic factors.
For corporate loans, these models consider the credit
quality as measured by risk ratings and economic factors.
The qualitative component considers idiosyncratic events
and the uncertainty of forward-looking economic
scenarios.
133
We identified the assessment of the collective ACLL
as a critical audit matter. The assessment involved
significant measurement uncertainty requiring complex
auditor judgment, and specialized skills and knowledge as
well as experience in the industry. This assessment
encompassed the evaluation of the various components of
the collective ACLL methodology, including the methods
and models used to estimate the PD, LGD, and EAD and
certain key assumptions and inputs for the Company’s
quantitative and qualitative components. Key assumptions
and inputs for consumer loans included loan
delinquencies, certain credit indicators, reasonable and
supportable forecast periods, expected life as well as
economic factors, including unemployment rates, gross
domestic product (GDP), and housing prices which are
considered in the model. For corporate loans, key
assumptions and inputs included risk ratings, reasonable
and supportable forecasts, credit conversion factor for
unfunded lending commitments, and economic factors,
including GDP and unemployment rates considered in the
model. Key assumptions and inputs for the qualitative
component included the likelihood and severity of a
downside scenario and consideration of uncertainties due
to idiosyncratic events as a result of the COVID-19
pandemic. The assessment also included an evaluation of
the conceptual soundness and performance of the PD,
LGD, and EAD models. In addition, auditor judgment
was required to evaluate the sufficiency of audit evidence
obtained.
The following are the primary procedures we
performed to address this critical audit matter. We
evaluated the design and tested the operating effectiveness
of certain internal controls related to the Company’s
measurement of the collective ACLL estimate, including
controls over the:
• approval of the collective ACLL methodologies
• determination of the key assumptions and inputs used
to estimate the quantitative and qualitative
components of the collective ACLL
• performance monitoring of the PD, LGD, and EAD
models.
We evaluated the Company’s process to develop the
collective ACLL estimate by testing certain sources of
data, factors and assumptions that the Company used and
considered the relevance and reliability of such data,
factors, and assumptions. In addition, we involved credit
risk professionals with specialized skills and knowledge,
who assisted in:
• reviewing the Company’s collective ACLL
methodologies and key assumptions for compliance
with U.S. generally accepted accounting principles
• evaluating judgments made by the Company relative
to the development and performance monitoring
testing of the PD, LGD, and EAD models by
comparing them to relevant Company-specific
metrics
• assessing the conceptual soundness and performance
testing of the PD, LGD, and EAD models by
inspecting the model documentation to determine
whether the models are suitable for their intended use
• assessing the economic forecast scenarios through
comparison to publicly available forecasts
• evaluating the methodology used to develop certain
economic forecast scenarios by comparing it to
relevant industry practices
• testing corporate loan risk ratings for a selection of
borrowers by evaluating the financial performance of
the borrower, sources of repayment, and any relevant
guarantees or underlying collateral
• evaluating the methodology used in determining the
qualitative components and the effect of that
component on the collective ACLL compared with
relevant credit risk factors and consistency with
credit trends.
We also assessed the sufficiency of the audit
evidence obtained related to the collective ACLL by
evaluating the:
• cumulative results of the audit procedures
• qualitative aspects of the Company’s accounting
practices
• potential bias in the accounting estimates.
Assessment of the realizability of deferred tax assets,
specifically as it relates to general basket foreign tax
credits
As discussed in Note 9 to the consolidated financial
statements, the Company’s net deferred tax assets (DTA)
were $31.0 billion as of December 31, 2020. This balance
is net of a valuation allowance of $5.2 billion recorded by
the Company. The estimation of the DTA for general
basket foreign tax credits (FTCs) and related valuation
allowance was $5.3 billion and $1.0 billion respectively.
The Company evaluated the realization of the DTA for
general basket FTCs to determine whether there was more
than a 50% likelihood that the DTA for general basket
FTCs would be realized, based primarily on the
Company’s expectations of future taxable income in each
relevant jurisdiction, available tax planning strategies and
timing of tax credit expirations. In particular, the
COVID-19 pandemic has negatively affected the
economy and business activities in countries where the
Company operates, which has impacted the Company’s
future forecasts of taxable income as of December 31,
2020.
We identified the assessment of the realizability of
the DTA for general basket FTCs as a critical audit
matter. Due to the significant measurement uncertainty
associated with the realizability of the DTA for general
basket FTCs, there was a high degree of subjectivity and
judgment in evaluating global tax regulations and future
taxable income. This assessment encompassed the
evaluation of the Company’s estimations that are
subjective and complex due to its global structure, given
the Company’s assumptions used to determine that
sufficient taxable income will be generated or tax
planning strategies implemented to support the realization
134
of the DTA for general basket FTCs before expiration of
foreign tax credits.
The following are the primary procedures we
performed to address this critical audit matter. We
evaluated the design and tested the operating effectiveness
of certain controls related to the Company’s DTA
realizability process, including controls over the:
• realizability of the Company’s deferred tax assets for
general basket FTCs
• appropriateness of future taxable income and tax
planning strategies.
We tested the Company’s process to develop the
valuation allowance estimate. This included performing
an assessment of the policy and methodology used by
management in the valuation allowance determination.
We involved income tax professionals with specialized
skills and knowledge, who assisted in assessing:
• certain assumptions used to determine the Company’s
future taxable income, including the interpretation of
the various tax laws and regulations and the source
and character of future taxable income
• the timing of tax credit expirations
• the prudence and feasibility of certain tax planning
strategies.
We performed sensitivity analyses over the
Company’s expectations of future taxable income and
timing of tax credit expirations.
Evaluation of goodwill in the North American and Asia
Global Consumer Banking reporting units
As discussed in Notes 1 and 16 to the consolidated
financial statements, the goodwill balance as of December
31, 2020 was $22.2 billion, of which $12.1 billion related
to reporting units within the Global Consumer Banking
segment and $10.1 billion related to reporting units within
the Institutional Clients Group segment. The Company
performs goodwill impairment testing on an annual basis
and whenever events or changes in circumstances indicate
that the carrying value of a reporting unit likely exceeds
its fair value. This involves estimating the fair value of the
reporting units using both discounted cash flow analyses
and a market multiples approach. The COVID-19
pandemic has negatively affected the economy and
business activities in countries where the Company
operates, which impacted the Company’s future forecasts
used in the discounted cash flow analyses.
We identified the evaluation of the goodwill
impairment analysis for the North America Global
Consumer Banking and Asia Global Consumer Banking
reporting units, two of the three reporting units within the
Global Consumer Banking segment, as a critical audit
matter. The estimated fair value of the North America and
Asia Global Consumer Banking reporting units
marginally exceeded their carrying values, indicating a
higher risk due to measurement uncertainty that the
goodwill may be impaired and, therefore, involved a high
degree of subjective auditor judgment. Specifically, the
assessment encompassed the evaluation of the key
assumptions used in estimating the fair value of the North
America and Asia Global Consumer Banking reporting
units, which include the long-term growth rate, discount
rate, exit multiple assumptions, certain forecasted
macroeconomic assumptions used to inform the
forecasted income by reporting unit, and certain
assumptions used to forecast income by reporting unit
including the forecast period, net interest revenue, and
loan volume used in the discounted cash flow analyses.
The following are the primary procedures we
performed to address this critical audit matter. We
evaluated the design and tested the operating effectiveness
of certain internal controls related to the Company’s
determination of the estimated fair value of the North
America Global Consumer Banking and Asia Global
Consumer Banking reporting units, including controls
related to management’s process for assessing the
appropriateness of:
• certain assumptions including the long-term growth
rate, discount rate and exit multiple used in the
discounted cash flow analyses
• certain forecasted macroeconomic assumptions used
to inform the forecasted income by reporting unit
• certain assumptions used to forecast income by
reporting unit including the forecast period, net
interest revenue and loan volume.
135

We compared the Company’s historical revenue
forecasts to actual results to assess the Company’s ability
to accurately forecast. We evaluated the reasonableness of
the Company’s forecasts by comparing to analyst reports.
In addition, we involved a valuation professional with
specialized skills and knowledge, who assisted in:
• developing an independent range of long-term growth
rate assumptions by reviewing publicly available data
for the United States and Asian markets and
comparable industries and comparing it to the
Company’s assumption
• evaluating the discount rate by assessing the
methodology used by management and developing an
independent assumption for the discount rate
• developing an independent range of the exit
assumptions using publicly available data for
comparable entities and comparing it to the
Company’s assumption
• developing an estimate of the fair value of North
America and Asia Global Consumer Banking
reporting units using the income approach and
comparing the results to the Company’s fair value
estimate
• developing an independent range of control premium
assumptions by comparing data from the 2008-2009
financial crisis to the Company’s assumption
• assessing the market capitalization reconciliation and
the reasonableness of the implied control premium.
/s/ KPMG LLP
We have served as the Company’s auditor since 1969.
New York, New York
February 26, 2021
136

FINANCIAL STATEMENTS AND NOTES TABLE OF CONTENTS
CONSOLIDATED FINANCIAL STATEMENTS
Consolidated Statement of Income—
For the Years Ended December 31, 2020, 2019 and 2018 138
Consolidated Statement of Comprehensive Income—
For the Years Ended December 31, 2020, 2019 and 2018 139
Consolidated Balance Sheet—December 31, 2020 and 2019 140
Consolidated Statement of Changes in Stockholders’ Equity
—For the Years Ended December 31, 2020, 2019 and 2018 142
Consolidated Statement of Cash Flows—
For the Years Ended December 31, 2020, 2019 and 2018 144
NOTES TO CONSOLIDATED FINANCIAL
STATEMENTS
Note 1—Summary of Significant Accounting Policies 146
Note 2—Discontinued Operations and Significant Disposals 161
Note 3—Business Segments 162
Note 4—Interest Revenue and Expense 163
Note 5—Commissions and Fees; Administration and Other
Fiduciary Fees 164
Note 6—Principal Transactions 167
Note 7—Incentive Plans 168
Note 8—Retirement Benefits 172
Note 9—Income Taxes 183
Note 10—Earnings per Share 187
Note 11—Securities Borrowed, Loaned and
Subject to Repurchase Agreements 188
Note 12—Brokerage Receivables and Brokerage Payables 191
Note 13—Investments 192
Note 14—Loans 204
Note 15—Allowance for Credit Losses 217
Note 16—Goodwill and Intangible Assets 220
Note 17—Debt 222
Note 18—Regulatory Capital 224
Note 19—Changes in Accumulated Other Comprehensive
Income (Loss) (AOCI) 225
Note 20—Preferred Stock 228
Note 21—Securitizations and Variable Interest Entities 230
Note 22—Derivatives 242
Note 23—Concentrations of Credit Risk 258
Note 24—Fair Value Measurement 259
Note 25—Fair Value Elections 279
Note 26—Pledged Assets, Collateral, Guarantees and
Commitments 283
Note 27—Contingencies 291
Note 28—Condensed Consolidating Financial Statements 300
Note 29—Subsequent Event 309
Note 30—Selected Quarterly Financial Data (Unaudited) 310
137

CONSOLIDATED FINANCIAL STATEMENTS
CONSOLIDATED STATEMENT OF INCOME Citigroup Inc. and Subsidiaries
Years ended December 31,
In millions of dollars, except per share amounts
2020 2019 2018
Revenues
Interest revenue $ 58,089 $ 76,510 $ 70,828
Interest expense 14,541 29,163 24,266
Net interest revenue $ 43,548 $ 47,347 $ 46,562
Commissions and fees $ 11,385 $ 11,746 $ 11,857
Principal transactions 13,885 8,892 8,905
Administration and other fiduciary fees 3,472 3,411 3,580
Realized gains on sales of investments, net 1,756 1,474 421
Impairment losses on investments:
Impairment losses on investments and other assets (165) (32) (132)
Provision for credit losses on AFS debt securities
(1)
(3) — —
Net impairment losses recognized in earnings $ (168) $ (32) $ (132)
Other revenue $ 420 $ 1,448 $ 1,661
Total non-interest revenues $ 30,750 $ 26,939 $ 26,292
Total revenues, net of interest expense $ 74,298 $ 74,286 $ 72,854
Provisions for credit losses and for benefits and claims
Provision for credit losses on loans $ 15,922 $ 8,218 $ 7,354
Provision for credit losses on held-to-maturity (HTM) debt securities 7 — —
Provision for credit losses on other assets 7 — —
Policyholder benefits and claims 113 73 101
Provision for credit losses on unfunded lending commitments 1,446 92 113
Total provisions for credit losses and for benefits and claims $ 17,495 $ 8,383 $ 7,568
Operating expenses
Compensation and benefits $ 22,214 $ 21,433 $ 21,154
Premises and equipment 2,333 2,328 2,324
Technology/communication 7,383 7,077 7,193
Advertising and marketing 1,217 1,516 1,545
Other operating 10,024 9,648 9,625
Total operating expenses $ 43,171 $ 42,002 $ 41,841
Income from continuing operations before income taxes $ 13,632 $ 23,901 $ 23,445
Provision for income taxes 2,525 4,430 5,357
Income from continuing operations $ 11,107 $ 19,471 $ 18,088
Discontinued operations
Loss from discontinued operations $ (20) $ (31) $ (26)
Provision (benefit) for income taxes — (27) (18)
Loss from discontinued operations, net of taxes $ (20) $ (4) $ (8)
Net income before attribution of noncontrolling interests $ 11,087 $ 19,467 $ 18,080
Noncontrolling interests 40 66 35
Citigroup’s net income $ 11,047 $ 19,401 $ 18,045
Basic earnings per share
(2)
Income from continuing operations $ 4.75 $ 8.08 $ 6.69
Loss from discontinued operations, net of taxes (0.01) — —
Net income $ 4.74 $ 8.08 $ 6.69
Weighted average common shares outstanding (in millions) 2,085.8 2,249.2 2,493.3
138
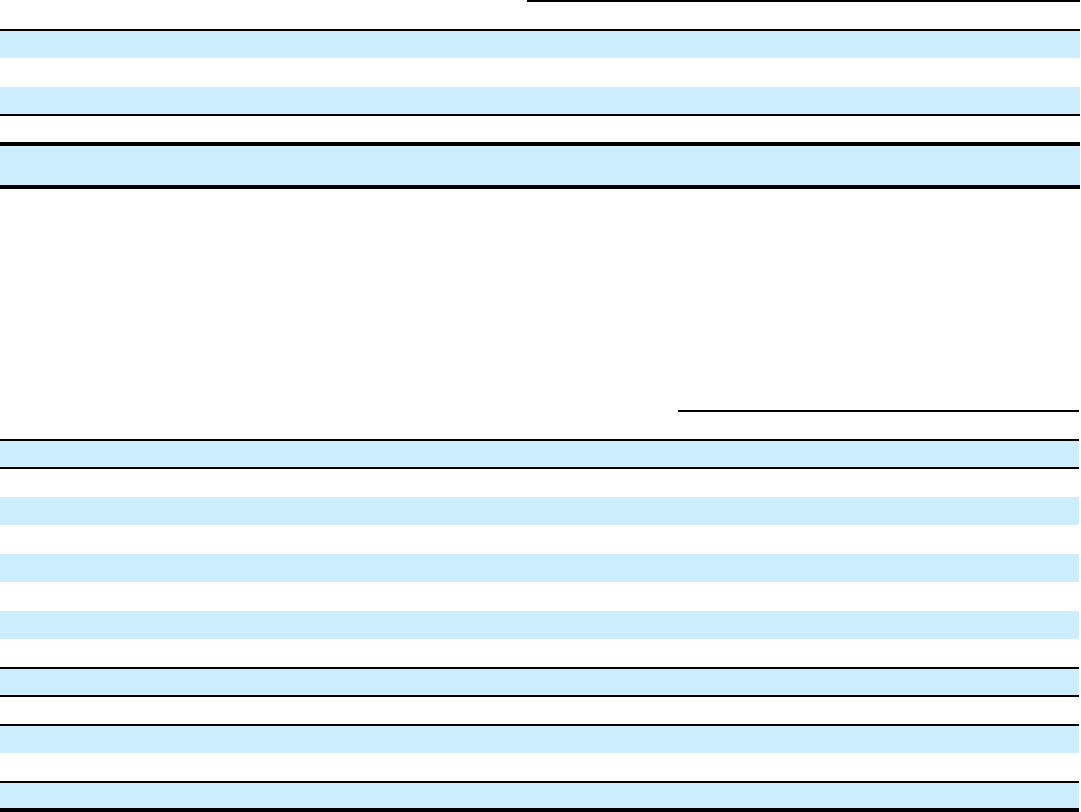
CONSOLIDATED STATEMENT OF INCOME
(Continued)
Citigroup Inc. and Subsidiaries
Years ended December 31,
In millions of dollars, except per share amounts
2020 2019 2018
Diluted earnings per share
(2)
Income from continuing operations $ 4.73 $ 8.04 $ 6.69
Income (loss) from discontinued operations, net of taxes (0.01) — —
Net income $ 4.72 $ 8.04 $ 6.68
Adjusted weighted average common shares outstanding
(in millions)
2,099.0 2,265.3 2,494.8
(1) In accordance with ASC 326.
(2) Due to rounding, earnings per share on continuing operations and discontinued operations may not sum to earnings per share on net income.
The Notes to the Consolidated Financial Statements are an integral part of these Consolidated Financial Statements.
CONSOLIDATED STATEMENT OF COMPREHENSIVE INCOME Citigroup Inc. and Subsidiaries
Years ended December 31,
In millions of dollars
2020 2019 2018
Citigroup’s net income $ 11,047 $ 19,401 $ 18,045
Add: Citigroup’s other comprehensive income (loss)
Net change in unrealized gains and losses on debt securities, net of taxes
(1)
$ 3,585 $ 1,985 $ (1,089)
Net change in debt valuation adjustment (DVA), net of taxes
(1)
(475) (1,136) 1,113
Net change in cash flow hedges, net of taxes 1,470 851 (30)
Benefit plans liability adjustment, net of taxes
(2)
(55) (552) (74)
Net change in foreign currency translation adjustment, net of taxes and hedges (250) (321) (2,362)
Net change in excluded component of fair value hedges, net of taxes (15) 25 (57)
Citigroup’s total other comprehensive income (loss) $ 4,260 $ 852 $ (2,499)
Citigroup’s total comprehensive income $ 15,307 $ 20,253 $ 15,546
Add: Other comprehensive income (loss) attributable to noncontrolling interests $ 26 $ — $ (43)
Add: Net income attributable to noncontrolling interests 40 66 35
Total comprehensive income $ 15,373 $ 20,319 $ 15,538
(1) See Note 1 to the Consolidated Financial Statements.
(2) See Note 8 to the Consolidated Financial Statements.
The Notes to the Consolidated Financial Statements are an integral part of these Consolidated Financial Statements.
139

CONSOLIDATED BALANCE SHEET Citigroup Inc. and Subsidiaries
December 31,
In millions of dollars
2020 2019
Assets
Cash and due from banks (including segregated cash and other deposits) $ 26,349 $ 23,967
Deposits with banks, net of allowance 283,266 169,952
Securities borrowed and purchased under agreements to resell (including $185,204 and $153,193 as of
December 31, 2020 and 2019, respectively, at fair value), net of allowance 294,712 251,322
Brokerage receivables, net of allowance 44,806 39,857
Trading account assets (including $168,967 and $120,236 pledged to creditors at December 31, 2020 and
2019, respectively) 375,079 276,140
Investments:
Available-for-sale debt securities (including $5,921 and $8,721 pledged to creditors as of December 31,
2020 and 2019, respectively), net of allowance 335,084 280,265
Held-to-maturity debt securities (including $547 and $1,923 pledged to creditors as of December 31,
2020 and 2019, respectively), net of allowance 104,943 80,775
Equity securities (including $1,066 and $1,162 as of December 31, 2020 and 2019, respectively, at fair
value) 7,332 7,523
Total investments $ 447,359 $ 368,563
Loans:
Consumer (including $14 and $18 as of December 31, 2020 and 2019, respectively, at fair value) 288,839 309,548
Corporate (including $6,840 and $4,067 as of December 31, 2020 and 2019, respectively, at fair value) 387,044 389,935
Loans, net of unearned income $ 675,883 $ 699,483
Allowance for credit losses on loans (ACLL) (24,956) (12,783)
Total loans, net $ 650,927 $ 686,700
Goodwill 22,162 22,126
Intangible assets (including MSRs of $336 and $495 as of December 31, 2020 and 2019,
respectively, at fair value) 4,747 4,822
Other assets (including $14,613 and $12,830 as of December 31, 2020 and 2019, respectively,
at fair value), net of allowance 110,683 107,709
Total assets $ 2,260,090 $ 1,951,158
The following table presents certain assets of consolidated variable interest entities (VIEs), which are included on the
Consolidated Balance Sheet above. The assets in the table below include those assets that can only be used to settle obligations of
consolidated VIEs, presented on the following page, and are in excess of those obligations. In addition, the assets in the table below
include third-party assets of consolidated VIEs only and exclude intercompany balances that eliminate in consolidation.
December 31,
In millions of dollars
2020 2019
Assets of consolidated VIEs to be used to settle obligations of consolidated VIEs
Cash and due from banks $ 281 $ 108
Trading account assets 8,104 6,719
Investments 837 1,295
Loans, net of unearned income
Consumer 37,561 46,977
Corporate 17,027 16,175
Loans, net of unearned income $ 54,588 $ 63,152
Allowance for credit losses on loans (ACLL) (3,794) (1,841)
Total loans, net $ 50,794 $ 61,311
Other assets 43 73
Total assets of consolidated VIEs to be used to settle obligations of consolidated VIEs $ 60,059 $ 69,506
Statement continues on the next page.
140

CONSOLIDATED BALANCE SHEET Citigroup Inc. and Subsidiaries
(Continued)
December 31,
In millions of dollars, except shares and per share amounts
2020 2019
Liabilities
Non-interest-bearing deposits in U.S. offices $ 126,942 $ 98,811
Interest-bearing deposits in U.S. offices (including $879 and $1,624 as of December 31, 2020 and 2019,
respectively, at fair value) 503,213 401,418
Non-interest-bearing deposits in offices outside the U.S. 100,543 85,692
Interest-bearing deposits in offices outside the U.S. (including $1,079 and $695 as of December 31, 2020
and 2019, respectively, at fair value) 549,973 484,669
Total deposits $ 1,280,671 $ 1,070,590
Securities loaned and sold under agreements to repurchase (including $60,206 and $40,651 as of
December 31, 2020 and 2019, respectively, at fair value) 199,525 166,339
Brokerage payables 50,484 48,601
Trading account liabilities 168,027 119,894
Short-term borrowings (including $4,683 and $4,946 as of December 31, 2020 and 2019, respectively,
at fair value) 29,514 45,049
Long-term debt (including $67,063 and $55,783 as of December 31, 2020 and 2019, respectively,
at fair value) 271,686 248,760
Other liabilities (including $6,835 and $6,343 as of December 31, 2020 and 2019, respectively,
at fair value), including allowance 59,983 57,979
Total liabilities $ 2,059,890 $ 1,757,212
Stockholders’ equity
Preferred stock ($1.00 par value; authorized shares: 30 million), issued shares: 779,200 as of December
31, 2020 and 719,200 as of December 31, 2019, at aggregate liquidation value $ 19,480 $ 17,980
Common stock ($0.01 par value; authorized shares: 6 billion), issued shares: 3,099,763,661 as of
December 31, 2020 and 3,099,602,856 as of December 31, 2019 31 31
Additional paid-in capital 107,846 107,840
Retained earnings 168,272 165,369
Treasury stock, at cost: 1,017,674,452 shares as of December 31, 2020 and 985,479,501 shares as of
December 31, 2019 (64,129) (61,660)
Accumulated other comprehensive income (loss) (AOCI) (32,058) (36,318)
Total Citigroup stockholders’ equity $ 199,442 $ 193,242
Noncontrolling interests 758 704
Total equity $ 200,200 $ 193,946
Total liabilities and equity $ 2,260,090 $ 1,951,158
The following table presents certain liabilities of consolidated VIEs, which are included on the Consolidated Balance Sheet above.
The liabilities in the table below include third-party liabilities of consolidated VIEs only and exclude intercompany balances that
eliminate in consolidation. The liabilities also exclude amounts where creditors or beneficial interest holders have recourse to the
general credit of Citigroup.
December 31,
In millions of dollars
2020 2019
Liabilities of consolidated VIEs for which creditors or beneficial interest holders do not have
recourse to the general credit of Citigroup
Short-term borrowings $ 9,278 $ 10,031
Long-term debt 20,405 25,582
Other liabilities 463 917
Total liabilities of consolidated VIEs for which creditors or beneficial interest holders do not have
recourse to the general credit of Citigroup $ 30,146 $ 36,530
The Notes to the Consolidated Financial Statements are an integral part of these Consolidated Financial Statements.
141

CONSOLIDATED STATEMENT OF CHANGES IN STOCKHOLDERS’
EQUITY Citigroup Inc. and Subsidiaries
Years ended December 31,
Amounts Shares
In millions of dollars, except shares in thousands
2020 2019 2018 2020 2019 2018
Preferred stock at aggregate liquidation value
Balance, beginning of year $ 17,980 $ 18,460 $ 19,253 719 738 770
Issuance of new preferred stock 3,000 1,500 — 120 60 —
Redemption of preferred stock (1,500) (1,980) (793) (60) (79) (32)
Balance, end of year $ 19,480 $ 17,980 $ 18,460 779 719 738
Common stock and additional paid-in capital
Balance, beginning of year $ 107,871 $ 107,953 $ 108,039 3,099,603 3,099,567 3,099,523
Employee benefit plans 5 (112) (94) 161 36 44
Preferred stock issuance costs (4) (4) — — — —
Other 5 34 8 — — —
Balance, end of year $ 107,877 $ 107,871 $ 107,953 3,099,764 3,099,603 3,099,567
Retained earnings
Balance, beginning of year $ 165,369 $ 151,347 $ 138,425
Adjustments to opening balance, net of taxes
(1)
Financial instruments—credit losses (CECL adoption) (3,076) — —
Variable post-charge-off third-party collection costs 330 — —
Lease accounting, intra-entity transfers of assets — 151 (84)
Adjusted balance, beginning of year $ 162,623 $ 151,498 $ 138,341
Citigroup’s net income 11,047 19,401 18,045
Common dividends
(2)
(4,299) (4,403) (3,865)
Preferred dividends (1,095) (1,109) (1,174)
Other (4) (18) —
Balance, end of year $ 168,272 $ 165,369 $ 151,347
Treasury stock, at cost
Balance, beginning of year $ (61,660) $ (44,370) $ (30,309) (985,480) (731,100) (529,615)
Employee benefit plans
(3)
456 585 484 8,546 9,872 10,557
Treasury stock acquired
(4)
(2,925) (17,875) (14,545) (40,740) (264,252) (212,042)
Balance, end of year $ (64,129) $ (61,660) $ (44,370) (1,017,674) (985,480) (731,100)
Citigroup’s accumulated other comprehensive income (loss)
Balance, beginning of year $ (36,318) $ (37,170) $ (34,668)
Adjustment to opening balance, net of taxes
(1)
— — (3)
Adjusted balance, beginning of year $ (36,318) $ (37,170) $ (34,671)
Citigroup’s total other comprehensive income (loss)
(3)
4,260 852 (2,499)
Balance, end of year $ (32,058) $ (36,318) $ (37,170)
Total Citigroup common stockholders’ equity $ 179,962 $ 175,262 $ 177,760 2,082,090 2,114,123 2,368,467
Total Citigroup stockholders’ equity $ 199,442 $ 193,242 $ 196,220
Noncontrolling interests
Balance, beginning of year $ 704 $ 854 $ 932
Transactions between noncontrolling-interest shareholders and the
related consolidated subsidiary — — —
Transactions between Citigroup and the noncontrolling-interest
shareholders (4) (169) (50)
Net income attributable to noncontrolling-interest shareholders 40 66 35
Distributions paid to noncontrolling-interest shareholders (2) (40) (38)
Other comprehensive income (loss) attributable to
noncontrolling-interest shareholders 26 — (43)
Other (6) (7) 18
Net change in noncontrolling interests $ 54 $ (150) $ (78)
Balance, end of year $ 758 $ 704 $ 854
Total equity $ 200,200 $ 193,946 $ 197,074
142
(1) See Note 1 to the Consolidated Financial Statements for additional details.
(2) Common dividends declared were $0.51 per share in the first, second, third and fourth quarters of 2020; $0.45 per share in the first and second quarters of 2019
and $0.51 per share in the third and fourth quarters of 2019; and $0.32 in the first and second quarters of 2018 and $0.45 per share in the third and fourth quarters
of 2018.
(3) Includes treasury stock related to (i) certain activity on employee stock option program exercises where the employee delivers existing shares to cover the option
exercise, or (ii) under Citi’s employee restricted or deferred stock programs where shares are withheld to satisfy tax requirements.
(4) Primarily consists of open market purchases under Citi’s Board of Directors-approved common stock repurchase programs.
The Notes to the Consolidated Financial Statements are an integral part of these Consolidated Financial Statements.
143

CONSOLIDATED STATEMENT OF CASH FLOWS Citigroup Inc. and Subsidiaries
Years ended December 31,
In millions of dollars
2020 2019 2018
Cash flows from operating activities of continuing operations
Net income before attribution of noncontrolling interests $ 11,087 $ 19,467 $ 18,080
Net income attributable to noncontrolling interests 40 66 35
Citigroup’s net income $ 11,047 $ 19,401 $ 18,045
Loss from discontinued operations, net of taxes (20) (4) (8)
Income from continuing operations—excluding noncontrolling interests $ 11,067 $ 19,405 $ 18,053
Adjustments to reconcile net income to net cash provided by (used in) operating activities of
continuing operations
Net gains on significant disposals
(1)
— — (247)
Depreciation and amortization 3,937 3,905 3,754
Deferred income taxes (2,333) (610) (51)
Provision for credit losses on loans and unfunded lending commitments 17,368 8,310 7,467
Realized gains from sales of investments (1,756) (1,474) (421)
Impairment losses on investments and other assets 165 32 132
Change in trading account assets (98,997) (20,124) (3,469)
Change in trading account liabilities 48,133 (24,411) 19,135
Change in brokerage receivables net of brokerage payables (3,066) (20,377) 6,163
Change in loans HFS 1,202 (909) 770
Change in other assets (1,012) 4,724 (5,791)
Change in other liabilities 558 1,737 (984)
Other, net 4,113 16,955 (7,559)
Total adjustments $ (31,688) $ (32,242) $ 18,899
Net cash provided by (used in) operating activities of continuing operations $ (20,621) $ (12,837) $ 36,952
Cash flows from investing activities of continuing operations
Change in securities borrowed and purchased under agreements to resell $ (43,390) $ 19,362 $ (38,206)
Change in loans 14,249 (22,466) (29,002)
Proceeds from sales and securitizations of loans 1,495 2,878 4,549
Purchases of investments (334,900) (274,491) (152,487)
Proceeds from sales of investments 146,285 137,173 61,491
Proceeds from maturities of investments 124,229 119,051 83,604
Proceeds from significant disposals
(1)
— — 314
Capital expenditures on premises and equipment and capitalized software (3,446) (5,336) (3,774)
Proceeds from sales of premises and equipment, subsidiaries and affiliates
and repossessed assets 50 259 212
Other, net 116 196 181
Net cash used in investing activities of continuing operations $ (95,312) $ (23,374) $ (73,118)
Cash flows from financing activities of continuing operations
Dividends paid $ (5,352) $ (5,447) $ (5,020)
Issuance of preferred stock 2,995 1,496 —
Redemption of preferred stock (1,500) (1,980) (793)
Treasury stock acquired (2,925) (17,571) (14,433)
Stock tendered for payment of withholding taxes (411) (364) (482)
Change in securities loaned and sold under agreements to repurchase 33,186 (11,429) 21,491
Issuance of long-term debt 76,458 59,134 60,655
Payments and redemptions of long-term debt (63,402) (51,029) (58,132)
Change in deposits 210,081 57,420 53,348
Change in short-term borrowings
(15,535)
12,703 (12,106)
144
CONSOLIDATED STATEMENT OF CASH FLOWS
(Continued)
Citigroup Inc. and Subsidiaries
Years ended December 31,
In millions of dollars
2020 2019 2018
Net cash provided by financing activities of continuing operations $ 233,595 $ 42,933 $ 44,528
Effect of exchange rate changes on cash and due from banks $ (1,966) $ (908) $ (773)
Change in cash, due from banks and deposits with banks $ 115,696 $ 5,814 $ 7,589
Cash, due from banks and deposits with banks at beginning of year 193,919 188,105 180,516
Cash, due from banks and deposits with banks at end of year $ 309,615 $ 193,919 $ 188,105
Cash and due from banks (including segregated cash and other deposits) $ 26,349 $ 23,967 $ 23,645
Deposits with banks, net of allowance 283,266 169,952 164,460
Cash, due from banks and deposits with banks at end of year $ 309,615 $ 193,919 $ 188,105
Supplemental disclosure of cash flow information for continuing operations
Cash paid during the year for income taxes $ 4,797 $ 4,888 $ 4,313
Cash paid during the year for interest 13,298 28,682 22,963
Non-cash investing activities
(2)
Transfers to loans HFS (Other assets) from loans $ 2,614 $ 5,500 $ 4,200
(1) See Note 2 to the Consolidated Financial Statements for further information on significant disposals.
(2) Operating and finance lease right-of-use assets and lease liabilities represent non-cash investing and financing activities, respectively, and are not included in the
non-cash investing activities presented here. See Note 26 to the Consolidated Financial Statements for more information and balances as of December 31, 2020
and 2019.
The Notes to the Consolidated Financial Statements are an integral part of these Consolidated Financial Statements.
145
NOTES TO CONSOLIDATED FINANCIAL STATEMENTS
1. SUMMARY OF SIGNIFICANT ACCOUNTING
POLICIES
Throughout these Notes, “Citigroup,” “Citi” and the
“Company” refer to Citigroup Inc. and its consolidated
subsidiaries.
Certain reclassifications, have been made to the prior
periods’ financial statements and disclosures to conform to the
current period’s presentation.
For information on Citi’s recent revisions and
reclassifications related to the accounting principle change for
variable post-charge-off third-party collection costs, see below
and Notes 15 and 30 to the Consolidated Financial Statements.
Principles of Consolidation
The Consolidated Financial Statements include the accounts of
Citigroup and its subsidiaries prepared in accordance with
U.S. generally accepted accounting principles (GAAP). The
Company consolidates subsidiaries in which it holds, directly
or indirectly, more than 50% of the voting rights or where it
exercises control. Entities where the Company holds 20% to
50% of the voting rights and/or has the ability to exercise
significant influence, other than investments of designated
venture capital subsidiaries or investments accounted for at
fair value under the fair value option, are accounted for under
the equity method, and the pro rata share of their income (loss)
is included in Other revenue. Income from investments in less-
than-20%-owned companies is recognized when dividends are
received. As discussed in more detail in Note 21 to the
Consolidated Financial Statements, Citigroup also
consolidates entities deemed to be variable interest entities
when Citigroup is determined to be the primary beneficiary.
Gains and losses on the disposition of branches, subsidiaries,
affiliates, buildings and other investments are included in
Other revenue.
Citibank
Citibank, N.A. (Citibank) is a commercial bank and wholly
owned subsidiary of Citigroup. Citibank’s principal offerings
include consumer finance, mortgage lending and retail
banking (including commercial banking) products and
services; investment banking, cash management and trade
finance; and private banking products and services.
Variable Interest Entities (VIEs)
An entity is a variable interest entity (VIE) if it meets either of
the criteria outlined in Accounting Standards Codification
(ASC) Topic 810, Consolidation, which are (i) the entity has
equity that is insufficient to permit the entity to finance its
activities without additional subordinated financial support
from other parties, or (ii) the entity has equity investors that
cannot make significant decisions about the entity’s operations
or that do not absorb their proportionate share of the entity’s
expected losses or expected returns.
The Company consolidates a VIE when it has both the
power to direct the activities that most significantly impact the
VIE’s economic performance and a right to receive benefits or
the obligation to absorb losses of the entity that could be
potentially significant to the VIE (that is, Citi is the primary
beneficiary). In addition to variable interests held in
consolidated VIEs, the Company has variable interests in other
VIEs that are not consolidated because the Company is not the
primary beneficiary.
All unconsolidated VIEs are monitored by the Company
to assess whether any events have occurred to cause its
primary beneficiary status to change.
All entities not deemed to be VIEs with which the
Company has involvement are evaluated for consolidation
under other subtopics of ASC 810. See Note 21 to the
Consolidated Financial Statements for more detailed
information.
Foreign Currency Translation
Assets and liabilities of Citi’s foreign operations are translated
from their respective functional currencies into U.S. dollars
using period-end spot foreign exchange rates. The effects of
those translation adjustments are reported in Accumulated
other comprehensive income (loss), a component of
stockholders’ equity, net of any related hedge and tax effects,
until realized upon sale or substantial liquidation of the foreign
operation, at which point such amounts related to the foreign
entity are reclassified into earnings. Revenues and expenses of
Citi’s foreign operations are translated monthly from their
respective functional currencies into U.S. dollars at amounts
that approximate weighted average exchange rates.
For transactions that are denominated in a currency other
than the functional currency, including transactions
denominated in the local currencies of foreign operations that
use the U.S. dollar as their functional currency, the effects of
changes in exchange rates are primarily included in Principal
transactions, along with the related effects of any economic
hedges. Instruments used to hedge foreign currency exposures
include foreign currency forward, option and swap contracts
and, in certain instances, designated issues of non-U.S. dollar
debt. Foreign operations in countries with highly inflationary
economies designate the U.S. dollar as their functional
currency, with the effects of changes in exchange rates
primarily included in Other revenue.
Investment Securities
Investments include debt and equity securities. Debt securities
include bonds, notes and redeemable preferred stocks, as well
as certain loan-backed and structured securities that are subject
to prepayment risk. Equity securities include common and
nonredeemable preferred stock.
Debt Securities
• Debt securities classified as “held-to-maturity” are
securities that the Company has both the ability and the
intent to hold until maturity and are carried at amortized
cost. Interest income on such securities is included in
Interest revenue.
• Debt securities classified as “available-for-sale” are
carried at fair value with changes in fair value reported in
Accumulated other comprehensive income (loss), a
146
component of stockholders’ equity, net of applicable
income taxes and hedges. Interest income on such
securities is included in Interest revenue.
Equity Securities
• Marketable equity securities are measured at fair value
with changes in fair value recognized in earnings.
• Non-marketable equity securities are measured at fair
value with changes in fair value recognized in earnings
unless (i) the measurement alternative is elected or (ii) the
investment represents Federal Reserve Bank and Federal
Home Loan Bank stock or certain exchange seats that
continue to be carried at cost. Non-marketable equity
securities under the measurement alternative are carried at
cost plus or minus changes resulting from observed prices
for orderly transactions for the identical or a similar
investment of the same issuer.
• Certain investments that would otherwise have been
accounted for using the equity method are carried at fair
value with changes in fair value recognized in earnings,
since the Company elected to apply fair value accounting.
For investments in debt securities classified as HTM or
AFS, the accrual of interest income is suspended for
investments that are in default or for which it is likely that
future interest payments will not be made as scheduled.
Debt securities not measured at fair value through
earnings include securities held in HTM or AFS, and equity
securities accounted for under the Measurement Alternative or
equity method. These securities are subject to evaluation for
impairment as described in Note 15 to the Consolidated
Financial Statements for HTM securities and in Note 13 for
AFS, Measurement Alternative and equity method
investments. Realized gains and losses on sales of investments
are included in earnings, primarily on a specific identification
basis.
The Company uses a number of valuation techniques for
investments carried at fair value, which are described in Note
24 to the Consolidated Financial Statements.
Trading Account Assets and Liabilities
Trading account assets include debt and marketable equity
securities, derivatives in a receivable position, residual
interests in securitizations and physical commodities
inventory. In addition, as described in Note 25 to the
Consolidated Financial Statements, certain assets that
Citigroup has elected to carry at fair value under the fair value
option, such as loans and purchased guarantees, are also
included in Trading account assets.
Trading account liabilities include securities sold, not yet
purchased (short positions) and derivatives in a net payable
position, as well as certain liabilities that Citigroup has elected
to carry at fair value (as described in Note 25 to the
Consolidated Financial Statements).
Other than physical commodities inventory, all trading
account assets and liabilities are carried at fair value.
Revenues generated from trading assets and trading liabilities
are generally reported in Principal transactions and include
realized gains and losses as well as unrealized gains and losses
resulting from changes in the fair value of such instruments.
Interest income on trading assets is recorded in Interest
revenue reduced by interest expense on trading liabilities.
Physical commodities inventory is carried at the lower of
cost or market with related losses reported in Principal
transactions. Realized gains and losses on sales of
commodities inventory are included in Principal transactions.
Investments in unallocated precious metals accounts (gold,
silver, platinum and palladium) are accounted for as hybrid
instruments containing a debt host contract and an embedded
non-financial derivative instrument indexed to the price of the
relevant precious metal. The embedded derivative instrument
is separated from the debt host contract and accounted for at
fair value. The debt host contract is carried at fair value under
the fair value option, as described in Note 25 to the
Consolidated Financial Statements.
Derivatives used for trading purposes include interest rate,
currency, equity, credit and commodity swap agreements,
options, caps and floors, warrants, and financial and
commodity futures and forward contracts. Derivative asset and
liability positions are presented net by counterparty on the
Consolidated Balance Sheet when a valid master netting
agreement exists and the other conditions set out in ASC
Topic 210-20, Balance Sheet—Offsetting, are met. See Note
22 to the Consolidated Financial Statements.
The Company uses a number of techniques to determine
the fair value of trading assets and liabilities, which are
described in Note 24 to the Consolidated Financial Statements.
Securities Borrowed and Securities Loaned
Securities borrowing and lending transactions do not
constitute a sale of the underlying securities for accounting
purposes and are treated as collateralized financing
transactions. Such transactions are recorded at the amount of
proceeds advanced or received plus accrued interest. As
described in Note 25 to the Consolidated Financial Statements,
the Company has elected to apply fair value accounting to a
number of securities borrowing and lending transactions. Fees
paid or received for all securities lending and borrowing
transactions are recorded in Interest expense or Interest
revenue at the contractually specified rate.
The Company monitors the fair value of securities
borrowed or loaned on a daily basis and obtains or posts
additional collateral in order to maintain contractual margin
protection.
As described in Note 24 to the Consolidated Financial
Statements, the Company uses a discounted cash flow
technique to determine the fair value of securities lending and
borrowing transactions.
Repurchase and Resale Agreements
Securities sold under agreements to repurchase (repos) and
securities purchased under agreements to resell (reverse repos)
do not constitute a sale (or purchase) of the underlying
securities for accounting purposes and are treated as
collateralized financing transactions. As described in Note 25
to the Consolidated Financial Statements, the Company has
elected to apply fair value accounting to certain of such
transactions, with changes in fair value reported in earnings.
Any transactions for which fair value accounting has not been
147
elected are recorded at the amount of cash advanced or
received plus accrued interest. Irrespective of whether the
Company has elected fair value accounting, interest paid or
received on all repo and reverse repo transactions is recorded
in Interest expense or Interest revenue at the contractually
specified rate.
Where the conditions of ASC 210-20-45-11, Balance
Sheet—Offsetting: Repurchase and Reverse Repurchase
Agreements, are met, repos and reverse repos are presented net
on the Consolidated Balance Sheet.
The Company’s policy is to take possession of securities
purchased under reverse repurchase agreements. The
Company monitors the fair value of securities subject to
repurchase or resale on a daily basis and obtains or posts
additional collateral in order to maintain contractual margin
protection.
As described in Note 24 to the Consolidated Financial
Statements, the Company uses a discounted cash flow
technique to determine the fair value of repo and reverse repo
transactions.
Loans
Loans are reported at their outstanding principal balances net
of any unearned income and unamortized deferred fees and
costs, except for credit card receivable balances, which include
accrued interest and fees. Loan origination fees and certain
direct origination costs are generally deferred and recognized
as adjustments to income over the lives of the related loans.
As described in Note 25 to the Consolidated Financial
Statements, Citi has elected fair value accounting for certain
loans. Such loans are carried at fair value with changes in fair
value reported in earnings. Interest income on such loans is
recorded in Interest revenue at the contractually specified rate.
Loans that are held-for-investment are classified as Loans,
net of unearned income on the Consolidated Balance Sheet,
and the related cash flows are included within the cash flows
from investing activities category in the Consolidated
Statement of Cash Flows on the line Change in loans.
However, when the initial intent for holding a loan has
changed from held-for-investment to held-for-sale (HFS), the
loan is reclassified to HFS, but the related cash flows continue
to be reported in cash flows from investing activities in the
Consolidated Statement of Cash Flows on the line Proceeds
from sales and securitizations of loans.
Consumer Loans
Consumer loans represent loans and leases managed primarily
by the Global Consumer Banking (GCB) businesses and
Corporate/Other.
Consumer Non-accrual and Re-aging Policies
As a general rule, interest accrual ceases for installment and
real estate (both open- and closed-end) loans when payments
are 90 days contractually past due. For credit cards and other
unsecured revolving loans, however, Citi generally accrues
interest until payments are 180 days past due. As a result of
OCC guidance, home equity loans in regulated bank entities
are classified as non-accrual if the related residential first
mortgage is 90 days or more past due. Also as a result of OCC
guidance, mortgage loans in regulated bank entities are
classified as non-accrual within 60 days of notification that the
borrower has filed for bankruptcy, other than Federal Housing
Administration (FHA)-insured loans.
Loans that have been modified to grant a concession to a
borrower in financial difficulty may not be accruing interest at
the time of the modification. The policy for returning such
modified loans to accrual status varies by product and/or
region. In most cases, a minimum number of payments
(ranging from one to six) is required, while in other cases the
loan is never returned to accrual status. For regulated bank
entities, such modified loans are returned to accrual status if a
credit evaluation at the time of, or subsequent to, the
modification indicates the borrower is able to meet the
restructured terms, and the borrower is current and has
demonstrated a reasonable period of sustained payment
performance (minimum six months of consecutive payments).
For U.S. consumer loans, generally one of the conditions
to qualify for modification (other than for loan modifications
made through the CARES Act relief provisions or banking
agency guidance for pandemic-related issues) is that a
minimum number of payments (typically ranging from one to
three) must be made. Upon modification, the loan is re-aged to
current status. However, re-aging practices for certain open-
ended consumer loans, such as credit cards, are governed by
Federal Financial Institutions Examination Council (FFIEC)
guidelines. For open-ended consumer loans subject to FFIEC
guidelines, one of the conditions for the loan to be re-aged to
current status is that at least three consecutive minimum
monthly payments, or the equivalent amount, must be
received. In addition, under FFIEC guidelines, the number of
times that such a loan can be re-aged is subject to limitations
(generally once in 12 months and twice in five years).
Furthermore, FHA and Department of Veterans Affairs (VA)
loans may only be modified under those respective agencies’
guidelines, and payments are not always required in order to
re-age a modified loan to current.
Consumer Charge-Off Policies
Citi’s charge-off policies follow the general guidelines below:
• Unsecured installment loans are charged off at 120 days
contractually past due.
• Unsecured revolving loans and credit card loans are
charged off at 180 days contractually past due.
• Loans secured with non-real estate collateral are written
down to the estimated value of the collateral, less costs to
sell, at 120 days contractually past due.
• Real estate-secured loans are written down to the
estimated value of the property, less costs to sell, at 180
days contractually past due.
• Real estate-secured loans are charged off no later than 180
days contractually past due if a decision has been made
not to foreclose on the loans.
• Unsecured loans in bankruptcy are charged off within 60
days of notification of filing by the bankruptcy court or in
accordance with Citi’s charge-off policy, whichever
occurs earlier.
• Real estate-secured loans in bankruptcy, other than FHA-
insured loans, are written down to the estimated value of
the property, less costs to sell, within 60 days of
148
notification that the borrower has filed for bankruptcy or
in accordance with Citi’s charge-off policy, whichever is
earlier.
Corporate Loans
Corporate loans represent loans and leases managed by
Institutional Clients Group (ICG). Corporate loans are
identified as impaired and placed on a cash (non-accrual) basis
when it is determined, based on actual experience and a
forward-looking assessment of the collectability of the loan in
full, that the payment of interest or principal is doubtful or
when interest or principal is 90 days past due, except when the
loan is well collateralized and in the process of collection. Any
interest accrued on impaired corporate loans and leases is
reversed at 90 days past due and charged against current
earnings, and interest is thereafter included in earnings only to
the extent actually received in cash. When there is doubt
regarding the ultimate collectability of principal, all cash
receipts are thereafter applied to reduce the recorded
investment in the loan.
Impaired corporate loans and leases are written down to
the extent that principal is deemed to be uncollectible.
Impaired collateral-dependent loans and leases, where
repayment is expected to be provided solely by the sale of the
underlying collateral and there are no other available and
reliable sources of repayment, are written down to the lower of
carrying value or collateral value. Cash-basis loans are
returned to accrual status when all contractual principal and
interest amounts are reasonably assured of repayment and
there is a sustained period of repayment performance in
accordance with the contractual terms.
Loans Held-for-Sale
Corporate and consumer loans that have been identified for
sale are classified as loans HFS and included in Other assets.
The practice of Citi’s U.S. prime mortgage business has been
to sell substantially all of its conforming loans. As such, U.S.
prime mortgage conforming loans are classified as HFS and
the fair value option is elected at origination, with changes in
fair value recorded in Other revenue. With the exception of
those loans for which the fair value option has been elected,
HFS loans are accounted for at the lower of cost or market
value, with any write-downs or subsequent recoveries charged
to Other revenue. The related cash flows are classified in the
Consolidated Statement of Cash Flows in the cash flows from
operating activities category on the line Change in loans held-
for-sale.
Allowances for Credit Losses (ACL)
Commencing January 1, 2020, Citi adopted Accounting
Standards Update (ASC) 326, Financial Instruments—Credit
Losses, using the methodologies described below. For
information about Citi’s accounting for loan losses prior to
January 1, 2020, see “Superseded Accounting Principles”
below.
The current expected credit losses (CECL) methodology
is based on relevant information about past events, including
historical experience, current conditions and reasonable and
supportable (R&S) forecasts that affect the collectability of the
reported financial asset balances. If the asset’s life extends
beyond the R&S forecast period, then historical experience is
considered over the remaining life of the assets in the ACL.
The resulting ACL is adjusted in each subsequent reporting
period through Provisions for credit losses in the Consolidated
Statement of Income to reflect changes in history, current
conditions and forecasts as well as changes in asset positions
and portfolios. ASC 326 defines the ACL as a valuation
account that is deducted from the amortized cost of a financial
asset to present the net amount that management expects to
collect on the financial asset over its expected life. All
financial assets carried at amortized cost are in the scope of
ASC 326, while assets measured at fair value are excluded.
See Note 13 to the Consolidated Financial Statements for a
discussion of impairment on available-for-sale (AFS)
securities.
Increases and decreases to the allowances are recorded in
Provisions for credit losses. The CECL methodology utilizes a
lifetime expected credit loss (ECL) measurement objective for
the recognition of credit losses for held-for-investment (HFI)
loans, held-to-maturity (HTM) debt securities, receivables and
other financial assets measured at amortized cost at the time
the financial asset is originated or acquired. Within the life of
a loan or other financial asset, the methodology generally
results in the earlier recognition of the provision for credit
losses and the related ACL than prior U.S. GAAP.
Estimation of ECLs requires Citi to make assumptions
regarding the likelihood and severity of credit loss events and
their impact on expected cash flows, which drive the
probability of default (PD), loss given default (LGD) and
exposure at default (EAD) models and, where Citi discounts
the ECL, using discounting techniques for certain products.
Where the asset’s life extends beyond the R&S forecast
period, Citi considers historical experience over the remaining
life of the assets in estimating the ACL.
Citi uses a multitude of variables in its macroeconomic
forecast as part of its calculation of both the qualitative and
quantitative components of the ACL, including both domestic
and international variables for its global portfolios and
exposures. Citi’s forecasts of the U.S. unemployment rate and
U.S. Real GDP growth rate represent the key macroeconomic
variables that most significantly affect its estimate of its
consumer and corporate ACLs. Under the quantitative base
scenario, Citi’s 4Q’20 forecasts are for U.S. unemployment to
continue to improve as the U.S. moves past the peak of the
health and economic crisis. The downside scenario
incorporates more adverse economic conditions and
subsequently higher unemployment rates and slower GDP
recovery.
The following are the main factors and interpretations that
Citi considers when estimating the ACL under the CECL
methodology:
• The most important reasons for the 2020 change in the
ACL since the adoption of CECL on January 1, 2020 are
the pandemic and the resulting economic recessions,
which led to higher unemployment and lower GDP
forecasts than were expected at the beginning of the year;
the impact of government stimulus and relief programs;
and portfolio changes and lower loan balances resulting
from changed customer spending patterns.
149
• CECL reserves are estimated over the contractual term of
the financial asset, which is adjusted for expected
prepayments. Expected extensions are generally not
considered unless the option to extend the loan cannot be
canceled unilaterally by Citi. Modifications are also not
considered, unless Citi has a reasonable expectation that it
will execute a troubled debt restructuring (TDR).
• Credit enhancements that are not freestanding (such as
those that are included in the original terms of the contract
or those executed in conjunction with the lending
transaction) are considered loss mitigants for purposes of
CECL reserve estimation.
• For unconditionally cancelable accounts such as credit
cards, reserves are based on the expected life of the
balance as of the evaluation date (assuming no further
charges) and do not include any undrawn commitments
that are unconditionally cancelable. Reserves are included
for undrawn commitments for accounts that are not
unconditionally cancelable (such as letters of credit and
corporate loan commitments, HELOCs, undrawn
mortgage loan commitments and financial guarantees).
• CECL models are designed to be economically sensitive.
They utilize the macroeconomic forecasts provided by
Citi’s economic forecasting team (EFT) that are approved
by senior management. Analysis is performed and
documented to determine the necessary qualitative
management adjustment (QMA) to capture forward-
looking macroeconomic expectations and model
uncertainty.
• The portion of the forecast that reflects the EFT’s
reasonable and supportable (R&S) period indicates the
maximum length of time its models can produce a R&S
macroeconomic forecast, after which mean reversion
reflecting historical loss experience is used for the
remaining life of the loan to estimate expected credit
losses. For the loss forecast, businesses consume the
macroeconomic forecast as determined to be appropriate
and justifiable.
Citi’s ability to forecast credit losses over the reasonable
and supportable (R&S) period is based on the ability to
forecast economic activity over a reasonable and supportable
time window.
The R&S period reflects the overall ability to have a
reasonable and supportable forecast of credit loss based on
economic forecasts.
• The loss models consume all or a portion of the R&S
economic forecast and then revert to historical loss
experience. The R&S forecast period for consumer loans
is 13 quarters and, in most cases, reverts to historically
based loss experience either immediately or using a
straight-line approach thereafter, while the R&S period
for wholesale is nine quarters with an additional straight-
line reversion period of three quarters for ECL
parameters.
• The ACL incorporates provisions for accrued interest on
products that are not subject to a non-accrual and timely
write-off policy (e.g., cards and Ready Credit, etc.).
• The reserves for TDRs are calculated using the discounted
cash flow method and consider appropriate
macroeconomic forecast data for the exposure type. For
TDR loans that are collateral dependent, the ACL is based
on the fair value of the collateral.
• Citi uses the most recent available information to inform
its macroeconomic forecasts, allowing sufficient time for
analysis of the results and corresponding approvals. Key
variables are reviewed for significant changes through
year end and changes to portfolio positions are reflected
in the ACL.
• Reserves are calculated at an appropriately granular level
and on a pooled basis where financial assets share risk
characteristics. At a minimum, reserves are calculated at a
portfolio level (product and country). Where a financial
asset does not share risk characteristics with any of the
pools, it is evaluated for credit losses individually.
Quantitative and Qualitative Components of the ACL
The loss likelihood and severity models use both internal and
external information and are sensitive to forecasts of different
macroeconomic conditions. For the quantitative component,
Citi uses a single forward-looking macroeconomic forecast,
complemented by the qualitative component that reflects
economic uncertainty due to a different possible more adverse
scenario for estimating the ACL. Estimates of these ECLs are
based upon (i) Citigroup’s internal system of credit risk
ratings; (ii) historical default and loss data, including
comprehensive internal history and rating agency information
regarding default rates and internal data on the severity of
losses in the event of default; and (iii) a R&S forecast of future
macroeconomic conditions. ECL is determined primarily by
utilizing models for the borrowers’ PD, LGD and EAD.
Adjustments may be made to this data, including (i)
statistically calculated estimates to cover the historical
fluctuation of the default rates over the credit cycle, the
historical variability of loss severity among defaulted loans
and the degree to which there are large obligor concentrations
in the global portfolio, and (ii) adjustments made for
specifically known items, such as current environmental
factors and credit trends.
Any adjustments needed to the modeled expected losses
in the quantitative calculations are addressed through a
qualitative adjustment. The qualitative adjustment considers,
among other things: the uncertainty of forward-looking
scenarios based on the likelihood and severity of a possible
recession; the uncertainty of economic conditions related to an
alternative downside scenario; certain portfolio characteristics
and concentrations; collateral coverage; model limitations;
idiosyncratic events; and other relevant criteria under banking
supervisory guidance for loan loss reserves. The qualitative
adjustment also reflects the estimated impact of the pandemic
on the economic forecasts and the impact on credit loss
estimates. The total ACL is composed of the quantitative and
qualitative components.
Consumer Loans
For consumer loans, most portfolios including North America
cards, mortgages and personal installment loans (PILs) are
covered by the PD, LGD and EAD loss forecasting models.
150
Some smaller international portfolios are covered by
econometric models where the gross credit loss (GCL) rate is
forecasted. The modeling of all retail products is performed by
examining risk drivers for a given portfolio; these drivers
relate to exposures with similar credit risk characteristics and
consider past events, current conditions and R&S forecasts.
Under the PD x LGD x EAD approach, GCLs and recoveries
are captured on an undiscounted basis. Citi incorporates
expected recoveries on loans into its reserve estimate,
including expected recoveries on assets previously written off.
CECL defines the exposure’s expected life as the
remaining contractual maturity including any expected
prepayments. Subsequent changes to the contractual terms that
are the result of a re-underwriting are not included in the
loan’s expected CECL life.
Citi does not establish reserves for the uncollectible
accrued interest on non-revolving consumer products, such as
mortgages and installment loans, which are subject to a non-
accrual and timely write-off policy. As such, only the principal
balance is subject to the CECL reserve methodology and
interest does not attract a further reserve. FAS 91-deferred
origination costs and fees related to new account originations
are amortized within a 12-month period, and an ACL is
provided for components in the scope of the ASC.
Separate valuation allowances are determined for
impaired smaller-balance homogeneous loans whose terms
have been modified in a TDR. Long-term modification
programs, and short-term (less than 12 months) modifications
that provide concessions (such as interest rate reductions) to
borrowers in financial difficulty, are reported as TDRs. In
addition, loan modifications that involve a trial period are
reported as TDRs at the start of the trial period. The ACL for
TDRs is determined using a discounted cash flow (DCF)
approach. When a DCF approach is used, the initial allowance
for ECLs is calculated as the expected contractual cash flows
discounted at the loan’s original effective interest rate. DCF
techniques are applied only for consumer loans classified as
TDR loan exposures.
For cards, Citi uses the payment rate approach, which
leverages payment rate curves, to determine the payments that
should be applied to liquidate the end-of-period balance
(CECL balance) in the estimation of EAD. The payment rate
approach uses customer payment behavior (payment rate) to
establish the portion of the CECL balance that will be paid
each month. These payment rates are defined as the percentage
of principal payments received in the respective month divided
by the prior month’s billed principal balance. The liquidation
(CECL payment) amount for each forecast period is
determined by multiplying the CECL balance by that period’s
forecasted payment rate. The cumulative sum of these
payments less the CECL balance produces the balance
liquidation curve. Citi does not apply a non-accrual policy to
credit card receivables; rather, they are subject to full charge-
off at 180 days past due. As such, the entire customer balance
up until write-off, including accrued interest and fees, will be
subject to the CECL reserve methodology.
Corporate Loans and HTM Securities
Citi records allowances for credit losses on all financial assets
carried at amortized cost that are in the scope of CECL,
including corporate loans classified as HFI and HTM debt
securities. Discounting techniques are applied for corporate
loans classified as HFI and HTM securities and non-accrual/
TDR loan exposures. All cash flows are fully discounted to the
reporting date. The ACL includes Citi’s estimate of all credit
losses expected to be incurred over the estimated full
contractual life of the financial asset. The contractual life of
the financial asset does not include expected extensions,
renewals or modifications, except for instances where the
Company reasonably expects to extend the tenor of the
financial asset pursuant to a future TDR Where Citi has an
unconditional option to extend the contractual term, Citi does
not consider the potential extension in determining the
contractual term; however, where the borrower has the sole
right to exercise the extension option without Citi’s approval,
Citi does consider the potential extension in determining the
contractual term. The decrease in credit losses under CECL at
the date of adoption on January 1, 2020, compared with the
prior incurred loss methodology, is largely due to more precise
contractual maturities that result in shorter remaining tenors,
the incorporation of recoveries and use of more specific
historical loss data based on an increase in portfolio
segmentation across industries and geographies.
The Company primarily bases its ACL on models that
assess the likelihood and severity of credit events and their
impact on cash flows under R&S forecasted economic
scenarios. Allowances consider the probability of the
borrower’s default, the loss the Company would incur upon
default and the borrower’s exposure at default. Such models
discount the present value of all future cash flows, using the
asset’s effective interest rate (EIR). Citi applies a more
simplified approach based on historical loss rates to certain
exposures recorded in Other assets and certain loan exposures
in the private bank.
The Company considers the risk of nonpayment to be zero
for U.S. Treasuries and U.S. government-sponsored agency
guaranteed mortgage-backed securities (MBS) and, as such,
Citi does not have an ACL for these securities. For all other
HTM debt securities, ECLs are estimated using PD models
and discounting techniques, which incorporate assumptions
regarding the likelihood and severity of credit losses. For
structured securities, specific models use relevant assumptions
for the underlying collateral type. A discounting approach is
applied to HTM direct obligations of a single issuer, similar to
that used for corporate HFI loans.
Other Financial Assets with Zero Expected Credit Losses
For certain financial assets, zero expected credit losses will be
recognized where the expectation of nonpayment of the
amortized cost basis is zero, based on there being no history of
loss and the nature of the receivables.
Secured Financing Transactions
Most of Citi’s reverse repurchase agreements, securities
borrowing arrangements and margin loans require that the
borrower continually adjust the amount of the collateral
securing Citi’s interest, primarily resulting from changes in the
fair value of such collateral. In such arrangements, ACLs are
recorded based only on the amount by which the asset’s
amortized cost basis exceeds the fair value of the collateral.
No ACLs are recorded where the fair value of the collateral is
151
equal to or exceeds the asset’s amortized cost basis, as Citi
does not expect to incur credit losses on such well-
collateralized exposures. For certain margin loans presented in
Loans on the Consolidated Balance Sheet, credit losses are
estimated using the same approach as corporate loans.
Accrued Interest
CECL permits entities to make an accounting policy election
not to reserve for interest, if the entity has a policy in place
that will result in timely reversal or write-off of interest.
However, when a non-accrual or timely charge-off policy is
not applied, an ACL is recognized on accrued interest. For
HTM debt securities, Citi established a non-accrual policy that
results in timely write-off of accrued interest. For corporate
loans, where a timely charge-off policy is used, Citi has
elected to recognize an ACL on accrued interest receivable.
The LGD models for corporate loans include an adjustment
for estimated accrued interest.
Reasonably Expected TDRs
For corporate loans, the reasonable expectation of TDR
concept requires that the contractual life over which ECLs are
estimated be extended when a TDR that results in a tenor
extension is reasonably expected. Reasonably expected TDRs
are included in the life of the asset. A discounting technique or
collateral-dependent practical expedient is used for non-
accrual and TDR loan exposures that do not share risk
characteristics with other loans and are individually assessed.
Loans modified in accordance with the CARES Act and bank
regulatory guidance are not classified as TDRs.
Purchased Credit Deteriorated (PCD) Assets
ASC 326 requires entities that have acquired financial assets
(such as loans and HTM securities) with an intent to hold, to
evaluate whether those assets have experienced a more-than-
insignificant deterioration in credit quality since origination.
These assets are subject to specialized accounting at initial
recognition under CECL. Subsequent measurement of PCD
assets will remain consistent with other purchased or
originated assets, i.e., non-PCD assets. CECL introduces the
notion of PCD assets, which replaces purchased credit
impaired (PCI) accounting under prior U.S. GAAP.
CECL requires the estimation of credit losses to be
performed on a pool basis unless a PCD asset does not share
characteristics with any pool. If certain PCD assets do not
meet the conditions for aggregation, those PCD assets should
be accounted for separately. This determination must be made
at the date the PCD asset is purchased. In estimating ECLs
from day 2 onward, pools can potentially be reassembled
based upon similar risk characteristics. When PCD assets are
pooled, Citi determines the amount of the initial ACL at the
pool level. The amount of the initial ACL for a PCD asset
represents the portion of the total discount at acquisition that
relates to credit and is recognized as a “gross-up” of the
purchase price to arrive at the PCD asset’s (or pool’s)
amortized cost. Any difference between the unpaid principal
balance and the amortized cost is considered to be related to
non-credit factors and results in a discount or premium, which
is amortized to interest income over the life of the individual
asset (or pool). Direct expenses incurred related to the
acquisition of PCD assets and other assets and liabilities in a
business combination are expensed as incurred. Subsequent
accounting for acquired PCD assets is the same as the
accounting for originated assets; changes in the allowance are
recorded in Provisions for credit losses.
Consumer
Citi does not purchase whole portfolios of PCD assets in its
retail businesses. However, there may be a small portion of a
purchased portfolio that is identified as PCD at the purchase
date. Interest income recognition does not vary between PCD
and non-PCD assets. A consumer financial asset is considered
to be more-than-insignificantly credit deteriorated if it is more
than 30 days past due at the purchase date.
Corporate
Citi generally classifies wholesale loans and debt securities
classified HTM or AFS as PCD when both of the following
criteria are met: (i) the purchase price discount is at least 10%
of par and (ii) the purchase date is more than 90 days after the
origination or issuance date. Citi classifies HTM beneficial
interests rated AA- and lower obtained at origination from
certain securitization transactions as PCD when there is a
significant difference (i.e., 10% or greater) between
contractual cash flows, adjusted for prepayments, and
expected cash flows at the date of recognition.
Reserve Estimates and Policies
Management provides reserves for an estimate of lifetime
ECLs in the funded loan portfolio on the Consolidated
Balance Sheet in the form of an ACL. These reserves are
established in accordance with Citigroup’s credit reserve
policies, as approved by the Audit Committee of the Citigroup
Board of Directors. Citi’s Chief Risk Officer and Chief
Financial Officer review the adequacy of the credit loss
reserves each quarter with risk management and finance
representatives for each applicable business area. Applicable
business areas include those having classifiably managed
portfolios, where internal credit risk ratings are assigned
(primarily ICG) and delinquency managed portfolios
(primarily GCB) or modified consumer loans, where
concessions were granted due to the borrowers’ financial
difficulties. The aforementioned representatives for these
business areas present recommended reserve balances for their
funded and unfunded lending portfolios along with supporting
quantitative and qualitative data discussed below:
Estimated credit losses for non-performing, non-homogeneous
exposures within a business line’s classifiably managed
portfolio and impaired smaller-balance homogeneous loans
whose terms have been modified due to the borrowers’
financial difficulties, where it was determined that a
concession was granted to the borrower.
Consideration may be given to the following, as appropriate,
when determining this estimate: (i) the present value of
expected future cash flows discounted at the loan’s original
effective rate, (ii) the borrower’s overall financial condition,
resources and payment record and (iii) the prospects for
support from financially responsible guarantors or the
realizable value of any collateral. In the determination of the
152
ACL for TDRs, management considers a combination of
historical re-default rates, the current economic environment
and the nature of the modification program when forecasting
expected cash flows. When impairment is measured based on
the present value of expected future cash flows, the entire
change in present value is recorded in Provisions for credit
losses.
Estimated credit losses in the delinquency-managed portfolios
for performing exposures.
In addition, risk management and finance representatives who
cover business areas with delinquency-managed portfolios
containing smaller-balance homogeneous loans present their
recommended reserve balances based on leading credit
indicators, including loan delinquencies and changes in
portfolio size as well as economic trends, including current
and future housing prices, unemployment, length of time in
foreclosure, costs to sell and GDP. This methodology is
applied separately for each product within each geographic
region in which these portfolios exist. This evaluation process
is subject to numerous estimates and judgments. The
frequency of default, risk ratings, loss recovery rates, size and
diversity of individual large credits and ability of borrowers
with foreign currency obligations to obtain the foreign
currency necessary for orderly debt servicing, among other
things, are all taken into account during this review. Changes
in these estimates could have a direct impact on the credit
costs in any period and could result in a change in the
allowance.
Allowance for Unfunded Lending Commitments
Credit loss reserves are recognized on all off-balance sheet
commitments that are not unconditionally cancelable.
Corporate loan EAD models include an incremental usage
factor (or credit conversion factor) to estimate ECLs on
amounts undrawn at the reporting date. Off-balance sheet
commitments include unfunded exposures, revolving facilities,
securities underwriting commitments, letters of credit,
HELOCs and financial guarantees, which excludes
performance guarantees. This reserve is classified on the
Consolidated Balance Sheet in Other liabilities. Changes to
the allowance for unfunded lending commitments are recorded
in Provision for credit losses on unfunded lending
commitments.
Mortgage Servicing Rights (MSRs)
Mortgage servicing rights (MSRs) are recognized as intangible
assets when purchased or when the Company sells or
securitizes loans acquired through purchase or origination and
retains the right to service the loans. Mortgage servicing rights
are accounted for at fair value, with changes in value recorded
in Other revenue in the Company’s Consolidated Statement of
Income.
For additional information on the Company’s MSRs, see
Notes 16 and 21 to the Consolidated Financial Statements.
Goodwill
Goodwill represents the excess of acquisition cost over the fair
value of net tangible and intangible assets acquired in a
business combination. Goodwill is subject to annual
impairment testing and interim assessments between annual
tests if an event occurs or circumstances change that would
more-likely-than-not reduce the fair value of a reporting unit
below its carrying amount.
Under ASC Topic 350, Intangibles—Goodwill and Other
and upon the adoption of ASU No. 2017-04 on January 1,
2020, the Company has an option to assess qualitative factors
to determine if it is necessary to perform the goodwill
impairment test. If, after assessing the totality of events or
circumstances, the Company determines that it is not more-
likely-than-not that the fair value of a reporting unit is less
than its carrying amount, no further testing is necessary. If,
however, the Company determines that it is more-likely-than-
not that the fair value of a reporting unit is less than its
carrying amount, then the Company must perform the
quantitative test.
The Company has an unconditional option to bypass the
qualitative assessment for any reporting unit in any reporting
period and proceed directly to the quantitative test.
The quantitative test requires a comparison of the fair
value of the individual reporting unit to its carrying value,
including goodwill. If the fair value of the reporting unit is in
excess of the carrying value, the related goodwill is considered
not impaired and no further analysis is necessary. If the
carrying value of the reporting unit exceeds the fair value, an
impairment loss is recognized in an amount equal to that
excess, limited to the total amount of goodwill allocated to
that reporting unit.
Upon any business disposition, goodwill is allocated to,
and derecognized with, the disposed business based on the
ratio of the fair value of the disposed business to the fair value
of the reporting unit.
Additional information on Citi’s goodwill impairment
testing can be found in Note 16 to the Consolidated Financial
Statements.
Intangible Assets
Intangible assets—including core deposit intangibles, present
value of future profits, purchased credit card relationships,
credit card contract related intangibles, other customer
relationships and other intangible assets, but excluding MSRs
—are amortized over their estimated useful lives. Intangible
assets that are deemed to have indefinite useful lives, primarily
trade names, are not amortized and are subject to annual
impairment tests. An impairment exists if the carrying value of
the indefinite-lived intangible asset exceeds its fair value. For
other intangible assets subject to amortization, an impairment
is recognized if the carrying amount is not recoverable and
exceeds the fair value of the intangible asset.
Other Assets and Other Liabilities
Other assets include, among other items, loans HFS, deferred
tax assets, equity method investments, interest and fees
receivable, lease right-of-use assets, premises and equipment
(including purchased and developed software), repossessed
assets and other receivables. Other liabilities include, among
other items, accrued expenses and other payables, lease
liabilities, deferred tax liabilities and reserves for legal claims,
taxes, unfunded lending commitments, repositioning reserves
and other payables.
153
Other Real Estate Owned and Repossessed Assets
Real estate or other assets received through foreclosure or
repossession are generally reported in Other assets, net of a
valuation allowance for selling costs and subsequent declines
in fair value.
Securitizations
There are two key accounting determinations that must be
made relating to securitizations. Citi first makes a
determination as to whether the securitization entity must be
consolidated. Second, it determines whether the transfer of
financial assets to the entity is considered a sale under GAAP.
If the securitization entity is a VIE, the Company consolidates
the VIE if it is the primary beneficiary (as discussed in
“Variable Interest Entities” above). For all other securitization
entities determined not to be VIEs in which Citigroup
participates, consolidation is based on which party has voting
control of the entity, giving consideration to removal and
liquidation rights in certain partnership structures. Only
securitization entities controlled by Citigroup are consolidated.
Interests in the securitized and sold assets may be retained
in the form of subordinated or senior interest-only strips,
subordinated tranches, spread accounts and servicing rights. In
credit card securitizations, the Company retains a seller’s
interest in the credit card receivables transferred to the trusts,
which is not in securitized form. In the case of consolidated
securitization entities, including the credit card trusts, these
retained interests are not reported on Citi’s Consolidated
Balance Sheet. The securitized loans remain on the balance
sheet. Substantially all of the consumer loans sold or
securitized through non-consolidated trusts by Citigroup are
U.S. prime residential mortgage loans. Retained interests in
non-consolidated mortgage securitization trusts are classified
as Trading account assets, except for MSRs, which are
included in Intangible assets on Citigroup’s Consolidated
Balance Sheet.
Debt
Short-term borrowings and Long-term debt are accounted for
at amortized cost, except where the Company has elected to
report the debt instruments, including certain structured notes,
at fair value, or the debt is in a fair value hedging relationship.
Transfers of Financial Assets
For a transfer of financial assets to be considered a sale: (i) the
assets must be legally isolated from the Company, even in
bankruptcy or other receivership, (ii) the purchaser must have
the right to pledge or sell the assets transferred (or, if the
purchaser is an entity whose sole purpose is to engage in
securitization and asset-backed financing activities through the
issuance of beneficial interests and that entity is constrained
from pledging the assets it receives, each beneficial interest
holder must have the right to sell or pledge their beneficial
interests) and (iii) the Company may not have an option or
obligation to reacquire the assets.
If these sale requirements are met, the assets are removed
from the Company’s Consolidated Balance Sheet. If the
conditions for sale are not met, the transfer is considered to be
a secured borrowing, the assets remain on the Consolidated
Balance Sheet and the sale proceeds are recognized as the
Company’s liability. A legal opinion on a sale generally is
obtained for complex transactions or where the Company has
continuing involvement with assets transferred or with the
securitization entity. For a transfer to be eligible for sale
accounting, that opinion must state that the asset transfer
would be considered a sale and that the assets transferred
would not be consolidated with the Company’s other assets in
the event of the Company’s insolvency.
For a transfer of a portion of a financial asset to be
considered a sale, the portion transferred must meet the
definition of a participating interest. A participating interest
must represent a pro rata ownership in an entire financial
asset; all cash flows must be divided proportionately, with the
same priority of payment; no participating interest in the
transferred asset may be subordinated to the interest of another
participating interest holder; and no party may have the right
to pledge or exchange the entire financial asset unless all
participating interest holders agree. Otherwise, the transfer is
accounted for as a secured borrowing.
See Note 21 to the Consolidated Financial Statements for
further discussion.
Risk Management Activities—Derivatives Used for
Hedging Purposes
The Company manages its exposures to market movements
outside of its trading activities by modifying the asset and
liability mix, either directly or through the use of derivative
financial products, including interest rate swaps, futures,
forwards and purchased options, as well as foreign-exchange
contracts. These end-user derivatives are carried at fair value
in Trading account assets and Trading account liabilities.
See Note 22 to the Consolidated Financial Statements for
a further discussion of the Company’s hedging and derivative
activities.
Instrument-specific Credit Risk
Citi presents separately in AOCI the portion of the total change
in the fair value of a liability resulting from a change in the
instrument-specific credit risk, when the entity has elected to
measure the liability at fair value in accordance with the fair
value option for financial instruments. Accordingly, the
change in fair value of liabilities for which the fair value
option was elected, related to changes in Citigroup’s own
credit spreads, is presented in AOCI.
Employee Benefits Expense
Employee benefits expense includes current service costs of
pension and other postretirement benefit plans (which are
accrued on a current basis), contributions and unrestricted
awards under other employee plans, the amortization of
restricted stock awards and costs of other employee benefits.
For its most significant pension and postretirement benefit
plans (Significant Plans), Citigroup measures and discloses
plan obligations, plan assets and periodic plan expense
quarterly, instead of annually. The effect of remeasuring the
Significant Plan obligations and assets by updating plan
actuarial assumptions on a quarterly basis is reflected in
Accumulated other comprehensive income (loss) and periodic
plan expense. All other plans (All Other Plans) are remeasured
annually. See Note 8 to the Consolidated Financial Statements.
154
Stock-Based Compensation
The Company recognizes compensation expense related to
stock and option awards over the requisite service period,
generally based on the instruments’ grant-date fair value,
reduced by actual forfeitures as they occur. Compensation cost
related to awards granted to employees who meet certain age
plus years-of-service requirements (retirement-eligible
employees) is accrued in the year prior to the grant date, in the
same manner as the accrual for cash incentive compensation.
Certain stock awards with performance conditions or certain
clawback provisions are subject to variable accounting,
pursuant to which the associated compensation expense
fluctuates with changes in Citigroup’s common stock price.
See Note 7 to the Consolidated Financial Statements.
Income Taxes
The Company is subject to the income tax laws of the U.S. and
its states and municipalities, as well as the non-U.S.
jurisdictions in which it operates. These tax laws are complex
and may be subject to different interpretations by the taxpayer
and the relevant governmental taxing authorities. In
establishing a provision for income tax expense, the Company
must make judgments and interpretations about these tax laws.
The Company must also make estimates about when in the
future certain items will affect taxable income in the various
tax jurisdictions, both domestic and foreign.
Disputes over interpretations of the tax laws may be
subject to review and adjudication by the court systems of the
various tax jurisdictions, or may be settled with the taxing
authority upon examination or audit. The Company treats
interest and penalties on income taxes as a component of
Income tax expense.
Deferred taxes are recorded for the future consequences
of events that have been recognized in financial statements or
tax returns, based upon enacted tax laws and rates. Deferred
tax assets are recognized subject to management’s judgment
about whether realization is more-likely-than-not. ASC 740,
Income Taxes, sets out a consistent framework to determine
the appropriate level of tax reserves to maintain for uncertain
tax positions. This interpretation uses a two-step approach
wherein a tax benefit is recognized if a position is more-likely-
than-not to be sustained. The amount of the benefit is then
measured to be the highest tax benefit that is more than 50%
likely to be realized. ASC 740 also sets out disclosure
requirements to enhance transparency of an entity’s tax
reserves.
See Note 9 to the Consolidated Financial Statements for a
further description of the Company’s tax provision and related
income tax assets and liabilities.
Commissions, Underwriting and Principal Transactions
Commissions and fees revenues are recognized in income
when earned. Underwriting revenues are recognized in income
typically at the closing of the transaction. Principal
transactions revenues are recognized in income on a trade-
date basis. See Note 5 to the Consolidated Financial
Statements for a description of the Company’s revenue
recognition policies for Commissions and fees, and Note 6 to
the Consolidated Financial Statements for details of Principal
transactions revenue.
Earnings per Share
Earnings per share (EPS) is computed after deducting
preferred stock dividends. The Company has granted restricted
and deferred share awards with dividend rights that are
considered to be participating securities, which are akin to a
second class of common stock. Accordingly, a portion of
Citigroup’s earnings is allocated to those participating
securities in the EPS calculation.
Basic earnings per share is computed by dividing income
available to common stockholders after the allocation of
dividends and undistributed earnings to the participating
securities by the weighted average number of common shares
outstanding for the period. Diluted earnings per share reflects
the potential dilution that could occur if securities or other
contracts to issue common stock were exercised. It is
computed after giving consideration to the weighted average
dilutive effect of the Company’s stock options and warrants
and convertible securities and after the allocation of earnings
to the participating securities. Anti-dilutive options and
warrants are disregarded in the EPS calculations.
Use of Estimates
Management must make estimates and assumptions that affect
the Consolidated Financial Statements and the related Notes to
the Consolidated Financial Statements. Such estimates are
used in connection with certain fair value measurements. See
Note 24 to the Consolidated Financial Statements for further
discussions on estimates used in the determination of fair
value. Moreover, estimates are significant in determining the
amounts of other-than-temporary impairments, impairments of
goodwill and other intangible assets, provisions for probable
losses that may arise from credit-related exposures and
probable and estimable losses related to litigation and
regulatory proceedings, and income taxes. While management
makes its best judgment, actual amounts or results could differ
from those estimates.
Cash Flows
Cash equivalents are defined as those amounts included in
Cash and due from banks and predominately all of Deposits
with banks. Cash flows from risk management activities are
classified in the same category as the related assets and
liabilities.
Related Party Transactions
The Company has related party transactions with certain of its
subsidiaries and affiliates. These transactions, which are
primarily short-term in nature, include cash accounts,
collateralized financing transactions, margin accounts,
derivative transactions, charges for operational support and the
borrowing and lending of funds, and are entered into in the
ordinary course of business.
155
ACCOUNTING CHANGES
Accounting for Financial Instruments—Credit Losses
Overview
In June 2016, the Financial Accounting Standards Board
(FASB) issued ASU No. 2016-13, Financial Instruments—
Credit Losses (Topic 326). The ASU introduced a new credit
loss methodology, the current expected credit losses (CECL)
methodology, which requires earlier recognition of credit
losses while also providing additional disclosure about credit
risk. Citi adopted the ASU as of January 1, 2020, which, as
discussed below, resulted in an increase in Citi’s Allowance
for credit losses and a decrease to opening Retained earnings,
net of deferred income taxes, at January 1, 2020.
The CECL methodology utilizes a lifetime “expected
credit loss” measurement objective for the recognition of
credit losses for loans, held-to-maturity debt securities,
receivables and other financial assets measured at amortized
cost at the time the financial asset is originated or acquired.
The ACL is adjusted each period for changes in expected
lifetime credit losses. The CECL methodology represents a
significant change from prior U.S. GAAP and replaced the
prior multiple existing impairment methods, which generally
required that a loss be incurred before it was recognized.
Within the life cycle of a loan or other financial asset, the
methodology generally results in the earlier recognition of the
provision for credit losses and the related ACL than prior U.S.
GAAP. For available-for-sale debt securities where fair value
is less than cost that Citi intends to hold or more-likely-than-
not will not be required to sell, credit-related impairment, if
any, is recognized through an ACL and adjusted each period
for changes in credit risk.
January 1, 2020 CECL Transition (Day 1) Impact
The CECL methodology’s impact on expected credit losses,
among other things, reflects Citi’s view of the current state of
the economy, forecasted macroeconomic conditions and Citi’s
portfolios. At the January 1, 2020 date of adoption, based on
forecasts of macroeconomic conditions and exposures at that
time, the aggregate impact to Citi was an approximate
$4.1 billion, or an approximate 29%, pretax increase in the
Allowance for credit losses, along with a $3.1 billion after-tax
decrease in Retained earnings and a deferred tax asset increase
of $1.0 billion. This transition impact reflects (i) a $4.9 billion
build to the Allowance for credit losses for Citi’s consumer
exposures, primarily driven by the impact on credit card
receivables of longer estimated tenors under the CECL
lifetime expected credit loss methodology (loss coverage of
approximately 23 months) compared to shorter estimated
tenors under the probable loss methodology under prior U.S.
GAAP (loss coverage of approximately 14 months), net of
recoveries; and (ii) a release of $0.8 billion of reserves
primarily related to Citi’s corporate net loan loss exposures,
largely due to more precise contractual maturities that result in
shorter remaining tenors, incorporation of recoveries and use
of more specific historical loss data based on an increase in
portfolio segmentation across industries and geographies.
Under the CECL methodology, the Allowance for credit
losses consists of quantitative and qualitative components.
Citi’s quantitative component of the Allowance for credit
losses is model based and utilizes a single forward-looking
macroeconomic forecast, complemented by the qualitative
component described below, in estimating expected credit
losses and discounts inputs for the corporate classifiably
managed portfolios. Reasonable and supportable forecast
periods vary by product. For example, Citi’s consumer models
use a 13-quarter reasonable and supportable period and revert
to historical loss experience thereafter, while its corporate loan
models use a nine-quarter reasonable and supportable period
followed by a three-quarter graduated transition to historical
loss experience.
Citi’s qualitative component of the Allowance for credit
losses considers (i) the uncertainty of forward-looking
scenarios based on the likelihood and severity of a possible
recession as another possible scenario; (ii) certain portfolio
characteristics, such as portfolio concentration and collateral
coverage; and (iii) model limitations as well as idiosyncratic
events. Citi calculates a judgmental management adjustment,
which is an alternative, more adverse scenario that only
considers downside risk.
Accounting for Variable Post-Charge-Off Third-Party
Collection Costs
During the second quarter of 2020 Citi changed its accounting
for variable post-charge-off third-party collection costs,
whereby these costs were accounted for as an increase in
expenses as incurred rather than a reduction in expected credit
recoveries. Citi concluded that such a change in the method of
accounting is preferable in Citi’s circumstances as it better
reflects the nature of these collection costs. That is, these costs
do not represent reduced payments from borrowers and are
similar to Citi’s other executory third-party vendor contracts
that are accounted for as operating expenses as incurred. As a
result of this change, Citi had a consumer ACL release of
$426 million in the second quarter of 2020 for its U.S. cards
portfolios and $122 million in the third quarter of 2020 for its
international portfolios.
In the fourth quarter of 2020, Citi revised the second
quarter of 2020 accounting conclusion from a “change in
accounting estimate effected by a change in accounting
principle” to a “change in accounting principle,” which
requires an adjustment to opening retained earnings rather than
net income, with retrospective application to the earliest
period presented. Citi considered the guidance in ASC Topic
250, Accounting Changes and Error Corrections; ASC Topic
270, Interim Reporting; ASC Topic 250-S99-1, Assessing
Materiality; and ASC Topic 250-S99-23, Accounting Changes
Not Retroactively Applied Due to Immateriality, Considering
the Effects of Prior Year Misstatements when Quantifying
Misstatements in Current Year Financial Statements. Citi
believes that the effects of the revisions were not material to
any previously reported quarterly or annual period. As a result,
Citi’s full-year and quarterly results have been revised to
reflect this change as if it were effective as of January 1, 2020
(impacts to 2018 and 2019 were de minimis). Accordingly,
Citi recorded an increase to its beginning retained earnings on
January 1, 2020 of $330 million and a decrease of
$443 million to its ACL. Further, Citi recorded a decrease of
$18 million to its provisions for credit losses on loans in the
156
first quarter of 2020 and an increase of $339 million and
$122 million to its provisions for credit losses on loans in the
second and third quarters of 2020, respectively. In addition,
Citi`s operating expenses increased by $49 million and
$45 million, with a corresponding decrease in net credit losses,
in the first and second quarters of 2020, respectively. As a
result of these changes, Citi’s net income for the year ended
December 31, 2020 was $330 million lower, or $0.16 per
share lower, than under the previous presentation as a change
in accounting estimate.
Reference Rate Reform
In March 2020, the FASB issued ASU No. 2020-04,
Reference Rate Reform (Topic 848): Facilitation of the Effects
of Reference Rate Reform on Financial Reporting, which
provides optional guidance to ease the potential burden in
accounting for (or recognizing the effects of) reference rate
reform on financial reporting. Specifically, the guidance
permits an entity, when certain criteria are met, to consider
amendments to contracts made to comply with reference rate
reform to meet the definition of a modification under U.S.
GAAP. It further allows hedge accounting to be maintained
and permits a one-time transfer or sale of qualifying held-to-
maturity securities. The expedients and exceptions provided
by the amendments are permitted to be adopted any time
through December 31, 2022 and do not apply to contract
modifications made and hedging relationships entered into or
evaluated after December 31, 2022, except for certain optional
expedients elected for certain hedging relationships existing as
of December 31, 2022. The ASU was adopted by Citi as of
June 30, 2020 with prospective application and did not impact
financial results in 2020.
In January 2021, the FASB issued ASU No. 2021-01,
Reference Rate Reform (Topic 848): Scope, which clarifies
that the scope of the initial accounting relief issued by the
FASB in March 2020 includes derivative instruments that do
not reference a rate that is expected to be discontinued but that
use an interest rate for margining, discounting, or contract
price alignment that is modified as a result of reference rate
reform (commonly referred to as the "discounting transition").
The amendments do not apply to contract modifications made
after December 31, 2022, new hedging relationships entered
into after December 31, 2022, and existing hedging
relationships evaluated for effectiveness in periods after
December 31, 2022, except for hedging relationships existing
as of December 31, 2022, that apply certain optional
expedients in which the accounting effects are recorded
through the end of the hedging relationship. The ASU was
adopted by Citi on a full retrospective basis upon issuance and
did not impact financial results in 2020.
Lease Accounting
In February 2016, the FASB issued ASU No. 2016-02, Leases
(Topic 842), which increases the transparency and
comparability of accounting for lease transactions. The ASU
requires lessees to recognize liabilities for operating leases and
corresponding right-of-use (ROU) assets on the balance sheet.
The ASU also requires quantitative and qualitative disclosures
regarding key information about leasing arrangements. Lessee
accounting for finance leases, as well as lessor accounting, is
largely unchanged.
Effective January 1, 2019, Citi prospectively adopted the
provisions of the ASU. At adoption, Citi recognized a lease
liability and a corresponding ROU asset of approximately
$4.4 billion on the Consolidated Balance Sheet related to its
future lease payments as a lessee under operating leases. In
addition, Citi recorded a $151 million increase in Retained
earnings for the cumulative effect of recognizing previously
deferred gains on sale/leaseback transactions. Adoption of the
ASU did not have a material impact on the Consolidated
Statement of Income. See Notes 14 and 26 for additional
details.
Citi has elected not to separate lease and non-lease
components in its lease contracts and accounts for them as a
single lease component. Citi has also elected not to record an
ROU asset for short-term leases that have a term of 12 months
or less and do not contain purchase options that Citi is
reasonably certain to exercise. The cost of short-term leases is
recognized in the Consolidated Statement of Income on a
straight-line basis over the lease term. In addition, Citi applies
the portfolio approach to account for certain equipment leases
with nearly identical contractual terms.
Lessee accounting
Operating lease ROU assets and lease liabilities are included
in Other assets and Other liabilities, respectively, on the
Consolidated Balance Sheet. Finance lease assets and
liabilities are included in Other assets and Long-term debt,
respectively, on the Consolidated Balance Sheet. Citi uses its
incremental borrowing rate, factoring in the lease term, to
determine the lease liability, which is measured at the present
value of future lease payments. The ROU asset is initially
measured at the amount of the lease liability plus any prepaid
rent and remaining initial direct costs, less any remaining lease
incentives and accrued rent. The ROU asset is subject to
impairment, during the lease term, in a manner consistent with
the impairment of long-lived assets. The lease terms include
periods covered by options to extend or terminate the lease
depending on whether Citi is reasonably certain to exercise
such options.
Lessor accounting
Lessor accounting is largely unchanged under the ASU. Citi
acts as a lessor for power, railcar, shipping and aircraft assets,
where Citi has executed operating, direct financing and
leveraged leasing arrangements. In a direct financing or a
leveraged lease, Citi derecognizes the leased asset and records
a lease financing receivable at lease commencement in Loans.
Upon lease termination, Citi may obtain control of the asset,
which is then recorded in Other assets on the Consolidated
Balance Sheet and any remaining receivable for the asset’s
residual value is derecognized. Under the ASU, leveraged
lease accounting is grandfathered and may continue to be
applied until the leveraged lease is terminated or modified.
Upon modification, the lease must be classified as an
operating, direct finance or sales-type lease in accordance with
the ASU.
157
Separately, as part of managing its real estate footprint,
Citi subleases excess real estate space via operating lease
arrangements.
SEC Staff Accounting Bulletin 118
On December 22, 2017, the SEC issued Staff Accounting
Bulletin (SAB) 118, which set forth the accounting for the
changes in tax law caused by the enactment of the Tax Cuts
and Jobs Act (Tax Reform). SAB 118 provided guidance
where the accounting under ASC 740 was incomplete for
certain income tax effects of Tax Reform, at the time of the
issuance of an entity’s financial statements for the period in
which Tax Reform was enacted (provisional items). Citi
disclosed several provisional items recorded as part of its
$22.6 billion fourth quarter 2017 charge related to Tax
Reform.
Citi completed its accounting for Tax Reform under SAB
118 during the fourth quarter of 2018 and recorded a one-time,
non-cash tax benefit of $94 million in Corporate/Other related
to amounts that were considered provisional pursuant to SAB
118. The adjustments for the provisional amounts consisted of
a $1.2 billion benefit relating to a reduction of the valuation
allowance against Citi’s FTC carry-forwards and its U.S.
residual DTAs related to its non-U.S. branches, offset by
additional charges of $0.2 billion related to the impact of a
change to a “quasi-territorial tax system” and $0.9 billion
related to the impact of deemed repatriation of undistributed
earnings of non-U.S. subsidiaries.
Also, Citi has made a policy election to account for taxes
on Global Intangible Low Taxed Income (GILTI) as incurred.
Revenue Recognition
In May 2014, the FASB issued ASU No. 2014-09, Revenue
from Contracts with Customers (Revenue Recognition), which
outlines a single comprehensive model for entities to use in
accounting for revenue arising from contracts with customers.
The core principle of the revenue model is that an entity
recognizes revenue to depict the transfer of promised goods or
services to customers in an amount that reflects the
consideration to which the entity expects to be entitled, in
exchange for those goods or services. The ASU defines the
promised good or service as the performance obligation under
the contract.
While the guidance replaces most existing revenue
recognition guidance in GAAP, the ASU is not applicable to
financial instruments and, therefore, does not impact a
majority of Citi’s revenues, including net interest income, loan
fees, gains on sales and mark-to-market accounting.
In accordance with the new revenue recognition standard,
Citi has identified the specific performance obligation
(promised services) associated with the contract with the
customer and has determined when that specific performance
obligation has been satisfied, which may be at a point in time
or over time depending on how the performance obligation is
defined. The contracts with customers also contain the
transaction price, which consists of fixed consideration and/or
consideration that may vary (variable consideration), and is
defined as the amount of consideration an entity expects to be
entitled to when or as the performance obligation is satisfied,
excluding amounts collected on behalf of third parties
(including transaction taxes). The amounts recognized at the
point in time the performance obligation is satisfied may differ
from the ultimate transaction price associated with that
performance obligation when a portion of it is based on
variable consideration. For example, some consideration is
based on the client’s month-end balance or market values,
which are unknown at the time the contract is executed. The
remaining transaction price amount, if any, will be recognized
as the variable consideration becomes determinable. In certain
transactions, the performance obligation is considered satisfied
at a point in time in the future. In this instance, Citi defers
revenue on the balance sheet that will only be recognized upon
completion of the performance obligation.
The new revenue recognition standard further clarified the
guidance related to reporting revenue gross as principal versus
net as an agent. In many cases, Citi outsources a component of
its performance obligations to third parties. Citi has
determined that it acts as principal in the majority of these
transactions and therefore presents the amounts paid to these
third parties gross within operating expenses.
The Company has retrospectively adopted this standard as
of January 1, 2018 and as a result was required to report
amounts paid to third parties where Citi is principal to the
contract within Operating expenses. The adoption resulted in
an increase in both revenue and expenses of approximately $1
billion for each of the years ended December 31, 2020 and
2018 with similar amounts for prior years. Prior to adoption,
these expense amounts were reported as contra revenue
primarily within Commissions and fees and Administration
and other fiduciary fees revenues. Accordingly, prior periods
have been reclassified to conform to the new presentation.
See Note 5 to the Consolidated Financial Statements for a
description of the Company’s revenue recognition policies for
Commissions and fees and Administration and other fiduciary
fees.
Income Tax Impact of Intra-Entity Transfers of Assets
In October 2016, the FASB issued ASU No. 2016-16, Income
Taxes—Intra-Entity Transfers of Assets Other Than Inventory,
which requires an entity to recognize the income tax
consequences of an intra-entity transfer of an asset other than
inventory when the transfer occurs. The ASU was effective
January 1, 2018 and was adopted as of that date. The impact of
this standard was an increase of DTAs by approximately $300
million, a decrease of Retained earnings by approximately $80
million and a decrease of prepaid tax assets by approximately
$380 million.
Clarifying the Definition of a Business
In January 2017, the FASB issued ASU No. 2017-01,
Business Combinations (Topic 805): Clarifying the Definition
of a Business. The definition of a business directly and
indirectly affects many areas of accounting (e.g., acquisitions,
disposals, goodwill and consolidation). The ASU narrows the
definition of a business by introducing a quantitative screen as
the first step, such that if substantially all of the fair value of
the gross assets acquired is concentrated in a single
identifiable asset or a group of similar identifiable assets, then
the set of transferred assets and activities is not a business. If
the set is not clarified from the quantitative screen, the entity
158
then evaluates whether the set meets the requirement that a
business include, at a minimum, an input and a substantive
process that together significantly contribute to the ability to
create outputs.
Citi adopted the ASU upon its effective date on January 1,
2018, prospectively. The ongoing impact of the ASU will
depend upon the acquisition and disposal activities of Citi. If
fewer transactions qualify as a business, there could be less
initial recognition of Goodwill, but also less goodwill
allocated to disposals. There was no impact during 2018 from
the adoption of this ASU.
Changes in Accounting for Pension and Postretirement
(Benefit) Expense
In March 2017, the FASB issued ASU No. 2017-07,
Compensation—Retirement Benefits (Topic 715): Improving
the Presentation of Net Periodic Pension Cost and Net
Periodic Postretirement Benefit Cost, which changes the
income statement presentation of net benefit expense and
requires restating the Company’s financial statements for each
of the earlier periods presented in Citi’s annual and interim
financial statements. The change in presentation was effective
for annual and interim periods starting January 1, 2018. The
ASU requires that only the service cost component of net
benefit expense be included in Compensation and benefits on
the income statement. The other components of net benefit
expense are required to be presented outside of Compensation
and benefits and are presented in Other operating
expenses. Since both of these income statement line items are
part of Operating expenses, total Operating expenses and Net
income will not change. This change in presentation did not
have a material effect on Compensation and benefits and
Other operating expenses and was applied prospectively. The
components of the net benefit expense are disclosed in Note 8
to the Consolidated Financial Statements.
The standard also changes the components of net benefit
expense that are eligible for capitalization when employee
costs are capitalized in connection with various activities, such
as internally developed software, construction-in-progress and
loan origination costs. Prospectively from January 1, 2018,
only the service cost component of net benefit expense may be
capitalized. Existing capitalized balances are not affected. This
change in amounts eligible for capitalization does not have a
material effect on the Company’s Consolidated Financial
Statements and related disclosures.
Hedging
In August 2017, the FASB issued ASU No. 2017-12, Targeted
Improvements to Accounting for Hedging Activities, which
better aligns an entity’s risk management activities and
financial reporting for hedging relationships through changes
to the designation and measurement guidance for qualifying
hedging relationships and the presentation of hedge results.
The ASU requires the change in the fair value of the hedging
instrument to be presented in the same income statement line
as the hedged item and also requires expanded disclosures.
Citi adopted this standard on January 1, 2018 and transferred
approximately $4 billion of prepayable mortgage-backed
securities and municipal bonds from held-to-maturity (HTM)
into available-for-sale (AFS) securities classification as
permitted as a one-time transfer upon adoption of the standard,
as these assets were deemed to be eligible to be hedged under
the last-of-layer hedge strategy. The impact to opening
Retained earnings was immaterial. See Note 19 to the
Consolidated Financial Statements for more information.
FUTURE ACCOUNTING CHANGES
Long-Duration Insurance Contracts
In August 2018, the FASB issued ASU No. 2018-12,
Financial Services—Insurance: Targeted Improvements to the
Accounting for Long-Duration Contracts, which changes the
existing recognition, measurement, presentation and
disclosures for long-duration contracts issued by an insurance
entity. Specifically, the guidance (i) improves the timeliness of
recognizing changes in the liability for future policy benefits
and prescribes the rate used to discount future cash flows for
long-duration insurance contracts, (ii) simplifies and improves
the accounting for certain market-based options or guarantees
associated with deposit (or account balance) contracts, (iii)
simplifies the amortization of deferred acquisition costs and
(iv) introduces additional quantitative and qualitative
disclosures. Citi has certain insurance subsidiaries, primarily
in the U.S. and Mexico, that issue long-duration insurance
contracts that will be impacted by the requirements of ASU
2018-12.
The effective date of ASU No. 2018-12 was deferred for
all insurance entities by ASU No. 2019-09, Finance Services
—Insurance: Effective Date (issued in October 2019) and by
ASU No. 2020-11, Financial Services—Insurance: Effective
Date and Early Application (issued November 2020). Citi
plans to adopt the targeted improvements in ASU 2018-12 on
January 1, 2023 and is currently evaluating the impact of the
standard on its insurance subsidiaries. Citi does not expect a
material impact to its results of operations as a result of
adopting the standard.
SUPERSEDED ACCOUNTING PRINCIPLES
Accounting for Credit Losses
Prior to January 1, 2020, Citi applied the incurred loss method
for the allowance for credit losses on loans and the other-than-
temporary impairment (OTTI) method for HTM securities as
follows.
Allowance for Credit Losses
The allowance for credit losses on loans represents
management’s best estimate of probable credit losses inherent
in the portfolio, including probable losses related to large
individually evaluated impaired loans and troubled debt
restructurings. Additions to the allowance are made through
the Provision for credit losses on loans. Loan losses are
deducted from the allowance and subsequent recoveries are
added. Assets received in exchange for loan claims in a
restructuring are initially recorded at fair value, with any gain
or loss reflected as a recovery or charge-off in the provision.
159
Evaluating HTM Debt Securities for Other-Than-
Temporary Impairment (OTTI)
The Company conducts periodic reviews of all HTM debt
securities with unrealized losses to evaluate whether the
impairment is other-than-temporary.
An unrealized loss exists when the current fair value of an
individual debt security is lower than its adjusted amortized
cost basis. Temporary losses related to HTM debt securities
generally are not recorded, as these investments are carried at
adjusted amortized cost basis. However, for HTM debt
securities with credit-related impairment, the credit loss is
recognized in earnings as OTTI, and any difference between
the cost basis adjusted for the OTTI and fair value is
recognized in AOCI and amortized as an adjustment of yield
over the remaining contractual life of the security.
160

2. DISCONTINUED OPERATIONS AND
SIGNIFICANT DISPOSALS
Summary of Discontinued Operations
The Company’s results from Discontinued operations
consisted of residual activities related to the sales of the Egg
Banking plc credit card business in 2011 and the German retail
banking business in 2008. All Discontinued operations results
are recorded within Corporate/Other.
The following table summarizes financial information for
all Discontinued operations:
In millions of dollars
2020 2019 2018
Total revenues, net of interest expense $ — $ — $ —
Loss from discontinued operations $ (20) $ (31) $ (26)
Benefit for income taxes — (27) (18)
Loss from discontinued operations, net
of taxes $ (20) $ (4) $ (8)
Cash flows from Discontinued operations were not
material for all periods presented.
Significant Disposals
There were no significant disposals during 2020 and 2019.
The transaction described below was identified as a significant
disposal in 2018.
Sale of Mexico Asset Management Business
On September 21, 2018, Citi completed the sale of its Mexico
asset management business, which was part of Latin America
GCB. As part of the sale, Citi derecognized total assets of
$137 million and total liabilities of $41 million. The
transaction resulted in a pretax gain on sale of approximately
$250 million (approximately $150 million after-tax) recorded
in Other revenue in 2018. Further, Citi and the buyer entered
into a 10-year services framework agreement, with Citi acting
as the distributor in exchange for an ongoing fee.
Income before taxes for the divested business, excluding
the pretax gain on sale, was as follows:
In millions of dollars
2020 2019 2018
Income before taxes $ — $ — $ 123
161

3. BUSINESS SEGMENTS
Citigroup’s activities are conducted through the following
business segments: Global Consumer Banking (GCB)
and Institutional Clients Group (ICG). In addition, Corporate/
Other includes activities not assigned to a specific business
segment, as well as certain North America legacy loan
portfolios, discontinued operations and other legacy assets.
The business segments are determined based on products
and services provided or type of customers served, of which
those identified as non-core are recorded in Corporate/Other
and are reflective of how management allocates resources and
measures financial performance to make business decisions.
GCB includes a global, full-service consumer franchise
delivering a wide array of banking, credit card, lending and
investment services through a network of local branches,
offices and electronic delivery systems and consists of three
GCB businesses: North America, Latin America and Asia
(including consumer banking activities in certain EMEA
countries).
ICG consists of Banking and Markets and securities
services and provides corporate, institutional, public sector
and high-net-worth clients in 96 countries and jurisdictions
with a broad range of banking and financial products and
services.
Corporate/Other includes certain unallocated costs of
global functions, other corporate expenses and net treasury
results, offsets to certain line-item reclassifications and
eliminations, the results of certain North America legacy loan
portfolios, discontinued operations and unallocated taxes.
The accounting policies of these reportable segments are
the same as those disclosed in Note 1 to the Consolidated
Financial Statements.
The following table presents certain information
regarding the Company’s continuing operations by reportable
segment:
Revenues,
net of interest expense
(1)
Provision (benefits)
for income taxes
Income (loss) from
continuing operations
(2)
Identifiable assets
In millions of dollars, except
identifiable assets in billions
2020 2019 2018 2020 2019 2018 2020 2019 2018 2020 2019
Global Consumer Banking $ 29,991 $ 32,971 $ 32,339 $ 212 $ 1,746 $ 1,689 $ 874 $ 5,702 $ 5,309 $ 434 $ 407
Institutional Clients Group 44,253 39,301 38,325 3,373 3,570 3,756 11,798 12,944 12,574 1,730 1,447
Corporate/Other 54 2,014 2,190 (1,060) (886) (88) (1,565) 825 205 96 97
Total $ 74,298 $ 74,286 $ 72,854 $ 2,525 $ 4,430 $ 5,357 $ 11,107 $ 19,471 $ 18,088 $ 2,260 $ 1,951
(1) Includes total revenues, net of interest expense (excluding Corporate/Other), in North America of $36.3 billion, $33.9 billion and $33.4 billion; in EMEA of $12.8
billion, $12.0 billion and $11.8 billion; in Latin America of $9.2 billion, $10.4 billion and $10.3 billion; and in Asia of $15.9 billion, $16.0 billion and $15.3
billion in 2020, 2019 and 2018, respectively. These regional numbers exclude Corporate/Other, which largely operates within the U.S.
(2) Includes pretax provisions for credit losses and for benefits and claims in the GCB results of $11.7 billion, $7.9 billion and $7.6 billion; in the ICG results of $5.6
billion, $0.6 billion and $0.2 billion; and in the Corporate/Other results of $0.2 billion, $(0.1) billion and $(0.2) billion in 2020, 2019 and 2018, respectively.
162

4. INTEREST REVENUE AND EXPENSE
Interest revenue and Interest expense consisted of the following:
In millions of dollars
2020 2019 2018
Interest revenue
Loan interest, including fees $ 40,185 $ 47,751 $ 45,682
Deposits with banks 928 2,682 2,203
Securities borrowed and purchased under agreements to resell 2,283 6,872 5,492
Investments, including dividends 7,989 9,860 9,494
Trading account assets
(1)
6,125 7,672 6,284
Other interest-bearing assets 579 1,673 1,673
Total interest revenue $ 58,089 $ 76,510 $ 70,828
Interest expense
Deposits
(2)
$ 6,537 $ 12,633 $ 9,616
Securities loaned and sold under agreements to repurchase 2,077 6,263 4,889
Trading account liabilities
(1)
628 1,308 1,001
Short-term borrowings and other interest-bearing liabilities 630 2,465 2,209
Long-term debt 4,669 6,494 6,551
Total interest expense $ 14,541 $ 29,163 $ 24,266
Net interest revenue $ 43,548 $ 47,347 $ 46,562
Provision for credit losses on loans 15,922 8,218 7,354
Net interest revenue after provision for credit losses on loans $ 27,626 $ 39,129 $ 39,208
(1) Interest expense on Trading account liabilities of ICG is reported as a reduction of Interest revenue. Interest revenue and Interest expense on cash collateral
positions are reported in interest on Trading account assets and Trading account liabilities, respectively.
(2) Includes deposit insurance fees and charges of $1,203 million, $781 million and $1,182 million for 2020, 2019 and 2018, respectively.
163
5. COMMISSIONS AND FEES; ADMINISTRATION
AND OTHER FIDUCIARY FEES
Commissions and Fees
The primary components of Commissions and fees revenue are
investment banking fees, brokerage commissions, credit card
and bank card income and deposit-related fees.
Investment banking fees are substantially composed of
underwriting and advisory revenues. Such fees are recognized
at the point in time when Citigroup’s performance under the
terms of a contractual arrangement is completed, which is
typically at the closing of a transaction. Reimbursed expenses
related to these transactions are recorded as revenue and are
included within investment banking fees. In certain instances
for advisory contracts, Citi will receive amounts in advance of
the deal’s closing. In these instances, the amounts received
will be recognized as a liability and not recognized in revenue
until the transaction closes. For the periods presented, the
contract liability amount was negligible.
Out-of-pocket expenses associated with underwriting
activity are deferred and recognized at the time the related
revenue is recognized, while out-of-pocket expenses
associated with advisory arrangements are expensed as
incurred. In general, expenses incurred related to investment
banking transactions, whether consummated or not, are
recorded in Other operating expenses. The Company has
determined that it acts as principal in the majority of these
transactions and therefore presents expenses gross within
Other operating expenses.
Brokerage commissions primarily include commissions
and fees from the following: executing transactions for clients
on exchanges and over-the-counter markets; sales of mutual
funds and other annuity products; and assisting clients in
clearing transactions, providing brokerage services and other
such activities. Brokerage commissions are recognized in
Commissions and fees at the point in time the associated
service is fulfilled, generally on the trade execution date.
Gains or losses, if any, on these transactions are included in
Principal transactions (see Note 6 to the Consolidated
Financial Statements). Sales of certain investment products
include a portion of variable consideration associated with the
underlying product. In these instances, a portion of the
revenue associated with the sale of the product is not
recognized until the variable consideration becomes fixed. The
Company recognized $495 million, $485 million and $521
million of revenue related to such variable consideration for
the years ended December 31, 2020, 2019 and 2018,
respectively. These amounts primarily relate to performance
obligations satisfied in prior periods.
Credit card and bank card income is primarily composed
of interchange fees, which are earned by card issuers based on
purchase sales, and certain card fees, including annual fees.
Costs related to customer reward programs and certain
payments to partners (primarily based on program sales,
profitability and customer acquisitions) are recorded as a
reduction of credit card and bank card income. Citi’s credit
card programs have certain partner sharing agreements that
vary by partner. These partner sharing agreements are subject
to contractually based performance thresholds that if met,
would require Citi to make ongoing payments to the partner.
The threshold is based on the profitability of a program and is
generally calculated based on predefined program revenues
less predefined program expenses. In most of Citi’s partner
sharing agreements, program expenses include net credit
losses and, to the extent that the increase in net credit losses
reduces Citi’s liability for the partners’ share for a given
program year, it would generally result in lower payments to
partners in total for that year and vice versa. Further, in some
instances, other partner payments are based on program sales
and new account acquisitions.Interchange revenues are
recognized as earned on a daily basis when Citi’s performance
obligation to transmit funds to the payment networks has been
satisfied. Annual card fees, net of origination costs, are
deferred and amortized on a straight-line basis over a 12-
month period. Costs related to card reward programs are
recognized when the rewards are earned by the cardholders.
Payments to partners are recognized when incurred.
Deposit-related fees consist of service charges on deposit
accounts and fees earned from performing cash management
activities and other deposit account services. Such fees are
recognized in the period in which the related service is
provided.
Transactional service fees primarily consist of fees
charged for processing services such as cash management,
global payments, clearing, international funds transfer and
other trade services. Such fees are recognized as/when the
associated service is satisfied, which normally occurs at the
point in time the service is requested by the customer and
provided by Citi.
Insurance distribution revenue consists of commissions
earned from third-party insurance companies for marketing
and selling insurance policies on behalf of such entities. Such
commissions are recognized in Commissions and fees at the
point in time the associated service is fulfilled, generally when
the insurance policy is sold to the policyholder. Sales of
certain insurance products include a portion of variable
consideration associated with the underlying product. In these
instances, a portion of the revenue associated with the sale of
the policy is not recognized until the variable consideration
becomes determinable. The Company recognized
$290 million, $322 million and $386 million of revenue
related to such variable consideration for the years ended
December 31, 2020, 2019 and 2018, respectively. These
amounts primarily relate to performance obligations satisfied
in prior periods.
Insurance premiums consist of premium income from
insurance policies that Citi has underwritten and sold to
policyholders.
164
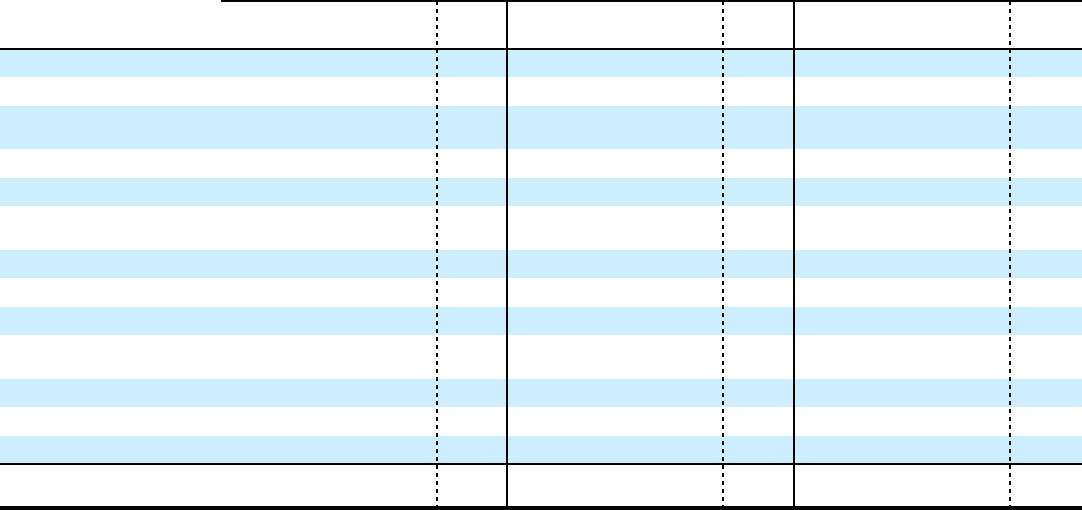
The following table presents Commissions and fees revenue:
2020 2019 2018
In millions of dollars
ICG GCB
Corp/
Other Total ICG GCB
Corp/
Other Total ICG GCB
Corp/
Other Total
Investment banking $ 4,483 $ — $ — $ 4,483 $ 3,767 $ — $ — $ 3,767 $ 3,568 $ — $ — $ 3,568
Brokerage commissions 1,986 974 — 2,960 1,771 841 — 2,612 1,977 815 — 2,792
Credit card and bank card
income
Interchange fees 703 7,301 — 8,004 1,222 8,621 — 9,843 1,077 8,112 11 9,200
Card-related loan fees 23 626 — 649 60 718 — 778 63 627 12 702
Card rewards and partner
payments (380) (8,293) — (8,673) (691) (8,883) — (9,574) (504) (8,253) (12) (8,769)
Deposit-related fees
(1)
958 376 — 1,334 1,048 470 — 1,518 1,031 572 1 1,604
Transactional service fees 886 88 — 974 824 123 — 947 733 83 4 820
Corporate finance
(2)
457 — — 457 616 — — 616 734 — — 734
Insurance distribution
revenue 11 492 — 503 12 524 — 536 14 565 11 590
Insurance premiums — 125 — 125 — 186 — 186 — 119 — 119
Loan servicing 82 30 25 137 78 55 21 154 100 91 37 228
Other 118 310 4 432 99 261 3 363 116 139 14 269
Total commissions and
fees
(3)
$ 9,327 $ 2,029 $ 29 $ 11,385 $ 8,806 $ 2,916 $ 24 $ 11,746 $ 8,909 $ 2,870 $ 78 $ 11,857
(1) Includes overdraft fees of $100 million, $127 million and $128 million for the years ended December 31, 2020, 2019 and 2018, respectively. Overdraft fees are
accounted for under ASC 310.
(2) Consists primarily of fees earned from structuring and underwriting loan syndications or related financing activity. This activity is accounted for under ASC 310.
(3) Commissions and fees includes $(7,160) million, $(7,695) million and $(6,853) million not accounted for under ASC 606, Revenue from Contracts with
Customers, for the years ended December 31, 2020, 2019 and 2018, respectively. Amounts reported in Commissions and fees accounted for under other guidance
primarily include card-related loan fees, card reward programs and certain partner payments, corporate finance fees, insurance premiums and loan servicing fees.
165

Administration and Other Fiduciary Fees
Administration and other fiduciary fees revenue is primarily
composed of custody fees and fiduciary fees.
The custody product is composed of numerous services
related to the administration, safekeeping and reporting for
both U.S. and non-U.S. denominated securities. The services
offered to clients include trade settlement, safekeeping,
income collection, corporate action notification, record-
keeping and reporting, tax reporting and cash management.
These services are provided for a wide range of securities,
including but not limited to equities, municipal and corporate
bonds, mortgage- and asset-backed securities, money market
instruments, U.S. Treasuries and agencies, derivative
instruments, mutual funds, alternative investments and
precious metals. Custody fees are recognized as or when the
associated promised service is satisfied, which normally
occurs at the point in time the service is requested by the
customer and provided by Citi.
Fiduciary fees consist of trust services and investment
management services. As an escrow agent, Citi receives, safe-
keeps, services and manages clients’ escrowed assets, such as
cash, securities, property (including intellectual property),
contracts or other collateral. Citi performs its escrow agent
duties by safekeeping the funds during the specified time
period agreed upon by all parties and therefore earns its
revenue evenly during the contract duration.
Investment management services consist of managing
assets on behalf of Citi’s retail and institutional clients.
Revenue from these services primarily consists of asset-based
fees for advisory accounts, which are based on the market
value of the client’s assets and recognized monthly, when the
market value is fixed. In some instances, the Company
contracts with third-party advisors and with third-party
custodians. The Company has determined that it acts as
principal in the majority of these transactions and therefore
presents the amounts paid to third parties gross within Other
operating expenses.
The following table presents Administration and other
fiduciary fees revenue:
2020 2019 2018
In millions of dollars
ICG GCB
Corp/
Other Total ICG GCB
Corp/
Other Total ICG GCB
Corp/
Other Total
Custody fees $ 1,590 $ 29 $ 38 $ 1,657 $ 1,453 $ 16 $ 73 $ 1,542 $ 1,497 $ 133 $ 65 $ 1,695
Fiduciary fees 668 602 4 1,274 647 621 28 1,296 645 597 43 1,285
Guarantee fees 529 7 5 541 558 8 7 573 584 9 7 600
Total administration and other
fiduciary fees
(1)
$ 2,787 $ 638 $ 47 $ 3,472 $ 2,658 $ 645 $ 108 $ 3,411 $ 2,726 $ 739 $ 115 $ 3,580
(1) Administration and other fiduciary fees includes $541 million, $573 million and $600 million for the years ended December 31, 2020, 2019 and 2018,
respectively, that are not accounted for under ASC 606, Revenue from Contracts with Customers. These amounts include guarantee fees.
166

6. PRINCIPAL TRANSACTIONS
Principal transactions revenue consists of realized and
unrealized gains and losses from trading activities. Trading
activities include revenues from fixed income, equities, credit
and commodities products and foreign exchange transactions
that are managed on a portfolio basis and characterized below
based on the primary risk managed by each trading desk. Not
included in the table below is the impact of net interest
revenue related to trading activities, which is an integral part
of trading activities’ profitability. See Note 4 to the
Consolidated Financial Statements for information about net
interest revenue related to trading activities. Principal
transactions include CVA (credit valuation adjustments) and
FVA (funding valuation adjustments) on over-the-counter
derivatives, and gains (losses) on certain economic hedges on
loans in ICG. These adjustments are discussed further in Note
24 to the Consolidated Financial Statements.
In certain transactions, Citi incurs fees and presents these
fees paid to third parties in operating expenses.
The following table presents Principal transactions
revenue:
In millions of dollars
2020 2019 2018
Interest rate risks
(1)
$ 5,561 $ 3,831 $ 2,889
Foreign exchange risks
(2)
4,158 3,850 3,772
Equity risks
(3)
1,343 808 1,221
Commodity and other risks
(4)
1,133 546 668
Credit products and risks
(5)
1,690 (143) 355
Total $ 13,885 $ 8,892 $ 8,905
(1) Includes revenues from government securities and corporate debt, municipal securities, mortgage securities and other debt instruments. Also includes spot and
forward trading of currencies and exchange-traded and over-the-counter (OTC) currency options, options on fixed income securities, interest rate swaps, currency
swaps, swap options, caps and floors, financial futures, OTC options and forward contracts on fixed income securities.
(2) Includes revenues from foreign exchange spot, forward, option and swap contracts, as well as foreign currency translation (FX translation) gains and losses.
(3) Includes revenues from common, preferred and convertible preferred stock, convertible corporate debt, equity-linked notes and exchange-traded and OTC equity
options and warrants.
(4) Primarily includes revenues from crude oil, refined oil products, natural gas and other commodities trades.
(5) Includes revenues from structured credit products.
167

7. INCENTIVE PLANS
Discretionary Annual Incentive Awards
Citigroup grants immediate cash bonus payments and various
forms of immediate and deferred awards as part of its
discretionary annual incentive award program involving a
large segment of Citigroup’s employees worldwide. Most of
the shares of common stock issued by Citigroup as part of its
equity compensation programs are issued to settle the vesting
of the stock components of these awards.
Discretionary annual incentive awards are generally
awarded in the first quarter of the year based on the previous
year’s performance. Awards valued at less than U.S. $100,000
(or the local currency equivalent) are generally paid entirely in
the form of an immediate cash bonus. Pursuant to Citigroup
policy and/or regulatory requirements, certain employees are
subject to mandatory deferrals of incentive pay and generally
receive 25%–60% of their awards in a combination of
restricted or deferred stock, deferred cash stock units or
deferred cash. Discretionary annual incentive awards to many
employees in the EU are subject to deferral requirements
regardless of the total award value, with at least 50% of the
immediate incentive delivered in the form of a stock payment
award subject to a restriction on sale or transfer (generally, for
12 months).
Deferred annual incentive awards may be delivered in the
form of one or more award types: a restricted or deferred stock
award under Citi’s Capital Accumulation Program (CAP), or a
deferred cash stock unit award and/or a deferred cash award
under Citi’s Deferred Cash Award Plan. The applicable mix of
awards may vary based on the employee’s minimum deferral
requirement and the country of employment.
Subject to certain exceptions (principally, for retirement-
eligible employees), continuous employment within Citigroup
is required to vest in CAP, deferred cash stock unit and
deferred cash awards. Post employment vesting by retirement-
eligible employees and participants who meet other conditions
is generally conditioned upon their refraining from
competition with Citigroup during the remaining vesting
period, unless the employment relationship has been
terminated by Citigroup under certain conditions.
Generally, the deferred awards vest in equal annual
installments over three- or four-year periods. Vested CAP
awards are delivered in shares of common stock. Deferred
cash awards are payable in cash and, except as prohibited by
applicable regulatory guidance, earn a fixed notional rate of
interest that is paid only if and when the underlying principal
award amount vests. Deferred cash stock unit awards are
payable in cash at the vesting value of the underlying stock.
Generally, in the EU, vested CAP shares are subject to a
restriction on sale or transfer after vesting, and vested deferred
cash awards and deferred cash stock units are subject to hold
back (generally, for 6 or 12 months based on the award type).
Unvested CAP, deferred cash stock units and deferred
cash awards are subject to one or more clawback provisions
that apply in certain circumstances, including gross
misconduct. CAP and deferred cash stock unit awards, made
to certain employees, are subject to a formulaic performance-
based vesting condition pursuant to which amounts otherwise
scheduled to vest will be reduced based on the amount of any
pretax loss in the participant’s business in the calendar year
preceding the scheduled vesting date. A minimum reduction of
20% applies for the first dollar of loss for CAP and deferred
cash stock unit awards.
In addition, deferred cash awards are subject to a
discretionary performance-based vesting condition under
which an amount otherwise scheduled to vest may be reduced
in the event of a “material adverse outcome” for which a
participant has “significant responsibility.” These awards are
also subject to an additional clawback provision pursuant to
which unvested awards may be canceled if the employee
engaged in misconduct or exercised materially imprudent
judgment, or failed to supervise or escalate the behavior of
other employees who did.
Sign-on and Long-Term Retention Awards
Stock awards and deferred cash awards may be made at
various times during the year as sign-on awards to induce new
hires to join Citi or to high-potential employees as long-term
retention awards.
Vesting periods and other terms and conditions pertaining
to these awards tend to vary by grant. Generally, recipients
must remain employed through the vesting dates to vest in the
awards, except in cases of death, disability or involuntary
termination other than for gross misconduct. These awards do
not usually provide for post employment vesting by
retirement-eligible participants.
Outstanding (Unvested) Stock Awards
A summary of the status of unvested stock awards granted as
discretionary annual incentive or sign-on and long-term
retention awards is presented below:
Unvested stock awards Shares
Weighted-
average grant
date fair
value per share
Unvested at December 31, 2019 30,194,715 $ 61.30
Granted
(1)
12,361,412 76.68
Canceled (606,918) 69.22
Vested
(2)
(13,722,917) 58.45
Unvested at December 31, 2020 28,226,292 $ 69.25
(1) The weighted-average fair value of the shares granted during 2019 and
2018 was $61.78 and $73.87, respectively.
(2) The weighted-average fair value of the shares vesting during 2020 was
approximately $79.68 per share.
Total unrecognized compensation cost related to unvested
stock awards was $580 million at December 31, 2020. The
cost is expected to be recognized over a weighted-average
period of 1.6 years.
168

Performance Share Units
Certain executive officers were awarded a target number of
performance share units (PSUs) every February from 2017 to
2020, for performance in the year prior to the award date.
The PSUs granted each February from 2017 to 2020 were
earned over the preceding three-year performance period,
based half on return on tangible common equity performance
in the last year of the three-year performance period and the
remaining half on cumulative earnings per share over the
three-year performance period.
For all award years, if the total shareholder return is
negative over the three-year performance period, executives
may earn no more than 100% of the target PSUs, regardless of
the extent to which Citigroup outperforms peer firms. The
number of PSUs ultimately earned could vary from zero, if
performance goals are not met, to as much as 150% of target,
if performance goals are meaningfully exceeded.
For all award years, the value of each PSU is equal to the
value of one share of Citi common stock. Dividend
equivalents will be accrued and paid on the number of earned
PSUs after the end of the performance period.
PSUs are subject to variable accounting, pursuant to
which the associated value of the award will fluctuate with
changes in Citigroup’s stock price and the attainment of the
specified performance goals for each award, until the award is
settled solely in cash after the end of the performance period.
The value of the award, subject to the performance goals, is
estimated using a simulation model that incorporates multiple
valuation assumptions, including the probability of achieving
the specified performance goals of each award. The risk-free
rate used in the model is based on the applicable U.S. Treasury
yield curve. Other significant assumptions for the awards are
as follows:
Valuation assumptions 2020 2019 2018
Expected volatility 22.26 % 25.33 % 24.93 %
Expected dividend yield 2.82 2.67 1.75
A summary of the performance share unit activity for
2020 is presented below:
Performance share units Units
Weighted-
average grant
date fair
value per unit
Outstanding, beginning of
year 1,492,000 $ 71.69
Granted
(1)
440,349 78.06
Canceled — —
Payments (598,546) 59.22
Outstanding, end of year 1,333,803 $ 79.39
(1)
Grant activity for 2020 includes additional units earned on the 2017
grant. The weighted-average grant price for the 2020 grant alone was
$83.45. The weighted-average grant date fair value per unit awarded in
2019 and 2018 was $72.83 and $83.24, respectively.
PSUs granted in 2017 were equitably adjusted after the
enactment of Tax Reform, as required under the terms of those
awards. The adjustments were intended to reproduce the
expected value of the awards immediately prior to the passage
of Tax Reform.
Stock Option Programs
All outstanding stock options are fully vested, with the related
expense recognized as a charge to income in prior periods.
169
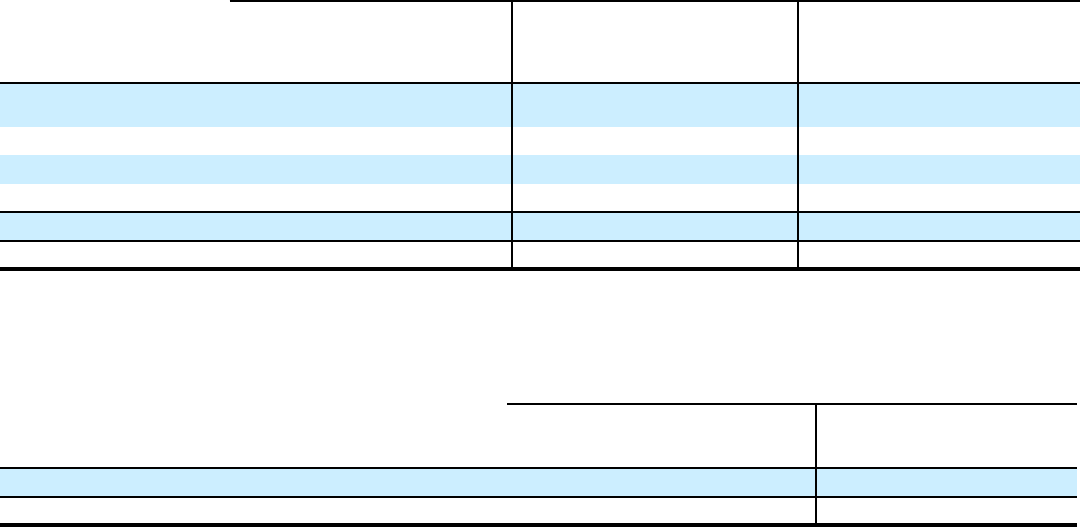
The following table presents information with respect to stock option activity under Citigroup’s stock option programs:
2020 2019 2018
Options
Weighted-
average
exercise
price
Intrinsic
value
per share Options
Weighted-
average
exercise
price
Intrinsic
value
per share Options
Weighted-
average
exercise
price
Intrinsic
value
per share
Outstanding, beginning of
year 166,650 $ 47.42 $ 32.47 762,225 $ 101.84 $ — 1,138,813 $ 161.96 $ —
Canceled — — — (11,365) 40.80 — — — —
Expired — — — (449,916) 142.30 — (376,588) 283.63 —
Exercised — — — (134,294) 39.00 23.50 — — —
Outstanding, end of year 166,650 $ 47.42 $ 14.24 166,650 $ 47.42 $ 32.47 762,225 $ 101.84 $ —
Exercisable, end of year 166,650 166,650 762,225
The following table summarizes information about stock options outstanding under Citigroup’s stock option programs at
December 31, 2020:
Options outstanding Options exercisable
Range of exercise prices
Number
outstanding
Weighted-average
contractual life
remaining
Weighted-average
exercise price
Number
exercisable
Weighted-average
exercise price
$41.54–$60.00 166,650 0.4 years $ 47.42 166,650 $ 47.42
Total at December 31, 2020 166,650 0.4 years $ 47.42 166,650 $ 47.42
Other Variable Incentive Compensation
Citigroup has various incentive plans globally that are used to
motivate and reward performance primarily in the areas of
sales, operational excellence and customer satisfaction.
Participation in these plans is generally limited to employees
who are not eligible for discretionary annual incentive awards.
Other forms of variable compensation include monthly
commissions paid to financial advisors and mortgage loan
officers.
Summary
Except for awards subject to variable accounting, the total
expense recognized for stock awards represents the grant date
fair value of such awards, which is generally recognized as a
charge to income ratably over the vesting period, other than
for awards to retirement-eligible employees and immediately
vested awards. Whenever awards are made or are expected to
be made to retirement-eligible employees, the charge to
income is accelerated based on when the applicable conditions
to retirement eligibility were or will be met. If the employee is
retirement eligible on the grant date, or the award is vested at
the grant date, the entire expense is recognized in the year
prior to grant.
Recipients of Citigroup stock awards generally do not
have any stockholder rights until shares are delivered upon
vesting or exercise, or after the expiration of applicable
required holding periods. Recipients of restricted or deferred
stock awards and deferred cash stock unit awards, however,
may, except as prohibited by applicable regulatory guidance,
be entitled to receive or accrue dividends or dividend-
equivalent payments during the vesting period. Recipients of
restricted stock awards generally are entitled to vote the shares
in their award during the vesting period. Once a stock award
vests, the shares delivered to the participant are freely
transferable, unless they are subject to a restriction on sale or
transfer for a specified period.
All equity awards granted since April 19, 2005 have been
made pursuant to stockholder-approved stock incentive plans
that are administered by the Personnel and Compensation
Committee of the Citigroup Board of Directors, which is
composed entirely of independent non-employee directors.
At December 31, 2020, approximately 34.0 million shares
of Citigroup common stock were authorized and available for
grant under Citigroup’s 2019 Stock Incentive Plan, the only
plan from which equity awards are currently granted.
The 2019 Stock Incentive Plan and predecessor plans
permit the use of treasury stock or newly issued shares in
connection with awards granted under the plans. Treasury
shares were used to settle vestings from 2017 to 2020, and for
the first quarter of 2021, except where local laws favor newly
issued shares. The use of treasury stock or newly issued shares
to settle stock awards does not affect the compensation
expense recorded in the Consolidated Statement of Income for
equity awards.
170

Incentive Compensation Cost
The following table shows components of compensation
expense, relating to certain of the incentive compensation
programs described above:
In millions of dollars
2020 2019 2018
Charges for estimated awards to
retirement-eligible colleagues $ 748 $ 683 $ 669
Amortization of deferred cash awards,
deferred cash stock units and
performance stock units 201 355 202
Immediately vested stock award
expense
(1)
95 82 75
Amortization of restricted and
deferred stock awards
(2)
420 404 435
Other variable incentive
compensation 627 666 640
Total $ 2,091 $ 2,190 $ 2,021
(1) Represents expense for immediately vested stock awards that generally
were stock payments in lieu of cash compensation. The expense is
generally accrued as cash incentive compensation in the year prior to
grant.
(2) All periods include amortization expense for all unvested awards to non-
retirement-eligible colleagues.
171
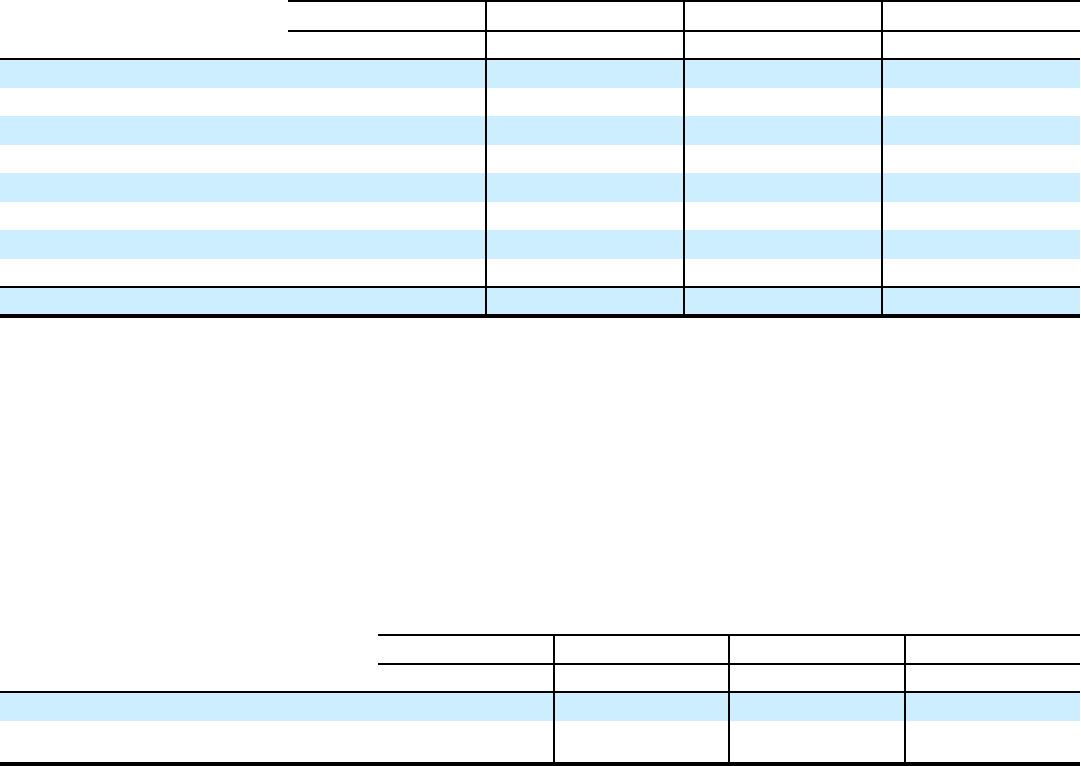
8. RETIREMENT BENEFITS
Pension and Postretirement Plans
The Company has several non-contributory defined benefit
pension plans covering certain U.S. employees and has various
defined benefit pension and termination indemnity plans
covering employees outside the U.S.
The U.S. qualified defined benefit plan was frozen
effective January 1, 2008 for most employees. Accordingly,
no additional compensation-based contributions have been
credited to the cash balance portion of the plan for existing
plan participants after 2007. However, certain employees
covered under the prior final pay plan formula continue to
accrue benefits. The Company also offers postretirement
health care and life insurance benefits to certain eligible U.S.
retired employees, as well as to certain eligible employees
outside the U.S.
The Company also sponsors a number of non-
contributory, nonqualified pension plans. These plans, which
are unfunded, provide supplemental defined pension benefits
to certain U.S. employees. With the exception of certain
employees covered under the prior final pay plan formula, the
benefits under these plans were frozen in prior years.
The plan obligations, plan assets and periodic plan
expense for the Company’s most significant pension and
postretirement benefit plans (Significant Plans) are measured
and disclosed quarterly, instead of annually. The Significant
Plans captured approximately 90% of the Company’s global
pension and postretirement plan obligations as of
December 31, 2020. All other plans (All Other Plans) are
measured annually with a December 31 measurement date.
Net (Benefit) Expense
The following table summarizes the components of net
(benefit) expense recognized in the Consolidated Statement of
Income for the Company’s pension and postretirement plans
for Significant Plans and All Other Plans:
Pension plans Postretirement benefit plans
U.S. plans Non-U.S. plans U.S. plans Non-U.S. plans
In millions of dollars
2020 2019 2018 2020 2019 2018 2020 2019 2018 2020 2019 2018
Benefits earned during the year $ — $ 1 $ 1 $ 147 $ 146 $ 146 $ — $ — $ — $ 7 $ 8 $ 9
Interest cost on benefit obligation 378 469 514 246 287 292 17 24 26 93 104 102
Expected return on assets (824) (821) (844) (245) (281) (291) (17) (18) (14) (77) (84) (88)
Amortization of unrecognized:
Prior service cost (benefit) 2 2 2 5 (4) (4) (2) — — (9) (10) (10)
Net actuarial loss 233 200 165 70 61 53 — — (1) 20 23 29
Curtailment loss (gain)
(1)
— 1 1 (8) (6) (1) — — — — — —
Settlement (gain) loss
(1)
— — — (1) 6 7 — — — — — —
Total net (benefit) expense $ (211) $ (148) $ (161) $ 214 $ 209 $ 202 $ (2) $ 6 $ 11 $ 34 $ 41 $ 42
(1) Curtailment and settlement relate to repositioning and divestiture actions.
Contributions
The Company’s funding practice for U.S. and non-U.S.
pension and postretirement plans is generally to fund to
minimum funding requirements in accordance with applicable
local laws and regulations. The Company may increase its
contributions above the minimum required contribution, if
appropriate. In addition, management has the ability to change
its funding practices. For the U.S. pension plans, there were no
required minimum cash contributions for 2020 or 2019.
The following table summarizes the Company’s actual
contributions for the years ended December 31, 2020 and
2019, as well as expected Company contributions for 2021.
Expected contributions are subject to change, since
contribution decisions are affected by various factors, such as
market performance, tax considerations and regulatory
requirements.
Pension plans
(1)
Postretirement benefit plans
(1)
U.S. plans
(2)
Non-U.S. plans U.S. plans Non-U.S. plans
In millions of dollars
2021 2020 2019 2021 2020 2019 2021 2020 2019 2021 2020 2019
Contributions made by the Company $ — $ — $ 425 $ 97 $ 115 $ 111 $ — $ — $ — $ 3 $ 4 $ 221
Benefits paid directly by (reimbursements to)
the Company 57 56 56 58 43 39 6 (15) 4 5 5 4
(1) Amounts reported for 2021 are expected amounts.
(2) The U.S. pension plans include benefits paid directly by the Company for the nonqualified pension plans.
172

Funded Status and Accumulated Other Comprehensive Income (AOCI)
The following table summarizes the funded status and amounts recognized on the Consolidated Balance Sheet for the Company’s
Significant Plans:
Pension plans Postretirement benefit plans
U.S. plans Non-U.S. plans U.S. plans Non-U.S. plans
In millions of dollars
2020 2019 2020 2019 2020 2019 2020 2019
Change in projected benefit obligation
Projected benefit obligation at beginning of year $ 13,453 $ 12,655 $ 8,105 $ 7,149 $ 692 $ 662 $ 1,384 $ 1,159
Benefits earned during the year — 1 147 146 — — 7 8
Interest cost on benefit obligation 378 469 246 287 17 24 93 104
Plan amendments
(1)
— — (4) 7 (104) — — —
Actuarial loss (gain)
(2)
950 1,263 518 861 (18) 46 30 140
Benefits paid, net of participants’ contributions and
government subsidy
(3)
(966) (936) (298) (304) (28) (40) (64) (72)
Settlement gain
(4)
— — (110) (84) — — — —
Curtailment loss (gain)
(4)
— 1 (14) (4) — — — —
Foreign exchange impact and other — — 39 47 — — (60) 45
Projected benefit obligation at year end $ 13,815 $ 13,453 $ 8,629 $ 8,105 $ 559 $ 692 $ 1,390 $ 1,384
Change in plan assets
Plan assets at fair value at beginning of year $ 12,717 $ 11,490 $ 7,556 $ 6,699 $ 345 $ 345 $ 1,127 $ 1,036
Actual return on assets
(2)
1,502 1,682 584 781 29 36 129 138
Company contributions (reimbursements) 56 481 158 150 (15) 4 9 225
Benefits paid, net of participants’ contributions and
government subsidy
(3)
(966) (936) (298) (304) (28) (40) (64) (72)
Settlement gain
(4)
— — (110) (84) — — — —
Foreign exchange impact and other — — (59) 314 — — (55) (200)
Plan assets at fair value at year end $ 13,309 $ 12,717 $ 7,831 $ 7,556 $ 331 $ 345 $ 1,146 $ 1,127
Funded status of the plans
Qualified plans
(5)
$ 230 $ (23) $ (798) $ (549) $ (228) $ (347) $ (244) $ (257)
Nonqualified plans
(6)
(736) (713) — — — — — —
Funded status of the plans at year end $ (506) $ (736) $ (798) $ (549) $ (228) $ (347) $ (244) $ (257)
Net amount recognized
Qualified plans
Benefit asset $ 230 $ — $ 741 $ 808 $ — $ — $ 25 $ 57
Benefit liability — (23) (1,539) (1,357) (228) (347) (269) (314)
Qualified plans $ 230 $ (23) $ (798) $ (549) $ (228) $ (347) $ (244) $ (257)
Nonqualified plans (736) (713) — — — — — —
Net amount recognized on the balance sheet $ (506) $ (736) $ (798) $ (549) $ (228) $ (347) $ (244) $ (257)
Amounts recognized in AOCI
Net transition obligation $ — $ — $ — $ — $ — $ — $ — $ —
Prior service (cost) benefit (10) (12) 12 1 101 — 63 76
Net actuarial (loss) gain (7,132) (7,092) (1,863) (1,735) 56 24 (348) (416)
Net amount recognized in equity (pretax) $ (7,142) $ (7,104) $ (1,851) $ (1,734) $ 157 $ 24 $ (285) $ (340)
Accumulated benefit obligation at year end $ 13,812 $ 13,447 $ 8,116 $ 7,618 $ 559 $ 692 $ 1,390 $ 1,384
(1) U.S. postretirement benefit plan was amended in 2020 to move grandfathered Medicare-eligible retirees to the Medicare individual marketplace.
(2) During 2020 and 2019, the actuarial loss is primarily due to the decline in global discount rates offset by actual return on assets due to favorable asset returns.
(3) U.S. postretirement benefit plans were net of Employer Group Waiver Plan subsidy of $40 million and $22 million in 2020 and 2019, respectively.
(4) Curtailment and settlement (gains) losses relate to repositioning and divestiture activities.
(5) The U.S. qualified pension plan is fully funded under specified Employee Retirement Income Security Act (ERISA) funding rules as of January 1, 2021 and no
minimum required funding is expected for 2021.
(6) The nonqualified plans of the Company are unfunded.
173
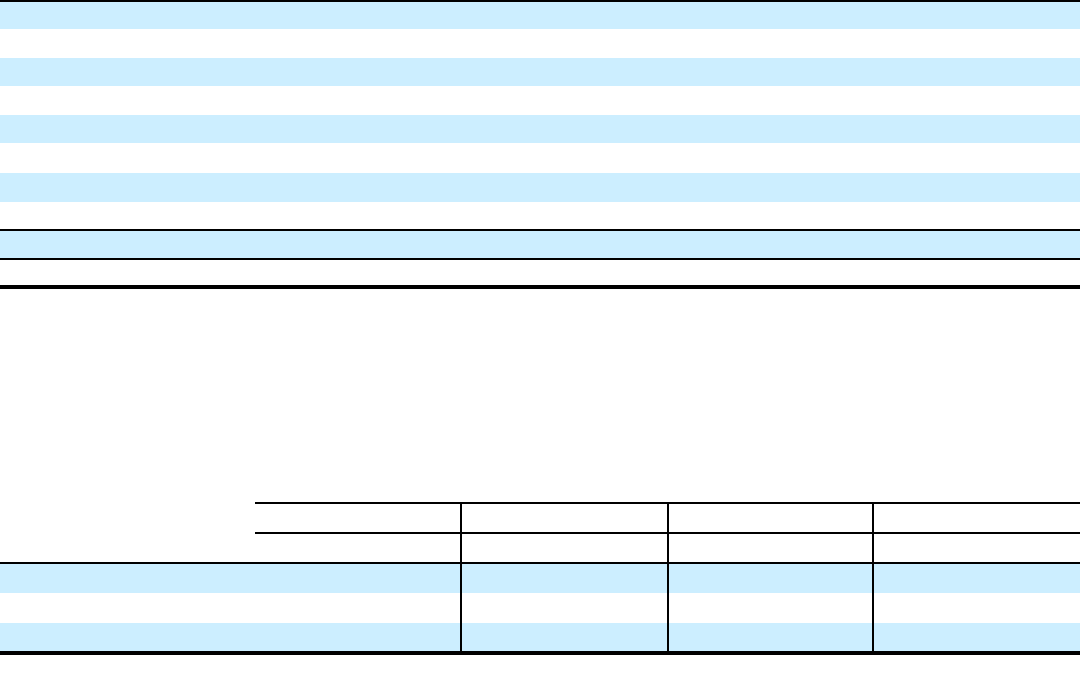
The following table shows the change in AOCI related to the Company’s pension, postretirement and post employment plans:
In millions of dollars
2020 2019 2018
Beginning of year balance, net of tax
(1)(2)
$ (6,809) $ (6,257) $ (6,183)
Actuarial assumptions changes and plan experience (1,464) (2,300) 1,288
Net asset gain (loss) due to difference between actual and expected returns 1,076 1,427 (1,732)
Net amortization 318 274 214
Prior service credit (cost) 108 (7) (7)
Curtailment/settlement gain
(3)
(8) 1 7
Foreign exchange impact and other (108) (66) 136
Change in deferred taxes, net 23 119 20
Change, net of tax $ (55) $ (552) $ (74)
End of year balance, net of tax
(1)(2)
$ (6,864) $ (6,809) $ (6,257)
(1) See Note 19 to the Consolidated Financial Statements for further discussion of net AOCI balance.
(2) Includes net-of-tax amounts for certain profit-sharing plans outside the U.S.
(3) Curtailment and settlement relate to repositioning and divestiture activities.
At December 31, 2020 and 2019, the aggregate projected benefit obligation (PBO), the aggregate accumulated benefit obligation
(ABO) and the aggregate fair value of plan assets are presented for all defined benefit pension plans with a PBO in excess of plan
assets and for all defined benefit pension plans with an ABO in excess of plan assets as follows:
PBO exceeds fair value of plan assets ABO exceeds fair value of plan assets
U.S. plans
(1)
Non-U.S. plans U.S. plans
(1)
Non-U.S. plans
In millions of dollars
2020 2019 2020 2019 2020 2019 2020 2019
Projected benefit obligation $ 736 $ 13,453 $ 4,849 $ 4,445 $ 736 $ 13,453 $ 4,723 $ 2,748
Accumulated benefit obligation 734 13,447 4,400 4,041 734 13,447 4,329 2,435
Fair value of plan assets — 12,717 3,310 3,089 — 12,717 3,212 1,429
(1) As of December 31, 2020, only the nonqualified plans’ PBO and ABO exceeded plan assets; As of December 31, 2019, both the qualified and nonqualified plans’
PBO and ABO exceeded plan assets.
Plan Assumptions
The Company utilizes a number of assumptions to determine
plan obligations and expenses. Changes in one or a
combination of these assumptions will have an impact on the
Company’s pension and postretirement PBO, funded status
and (benefit) expense. Changes in the plans’ funded status
resulting from changes in the PBO and fair value of plan
assets will have a corresponding impact on Accumulated other
comprehensive income (loss).
The actuarial assumptions at the respective years ended
December 31 in the table below are used to measure the year-
end PBO and the net periodic (benefit) expense for the
subsequent year (period). Since Citi’s Significant Plans are
measured on a quarterly basis, the year-end rates for those
plans are used to calculate the net periodic (benefit) expense
for the subsequent year’s first quarter.
As a result of the quarterly measurement process, the net
periodic (benefit) expense for the Significant Plans is
calculated at each respective quarter end based on the
preceding quarter-end rates (as shown below for the U.S. and
non-U.S. pension and postretirement plans). The actuarial
assumptions for All Other Plans are measured annually.
174

Certain assumptions used in determining pension and
postretirement benefit obligations and net benefit expense for
the Company’s plans are shown in the following table:
At year end 2020 2019
Discount rate
U.S. plans
Qualified pension 2.45%
3.25%
Nonqualified pension 2.35 3.25
Postretirement 2.20 3.15
Non-U.S. pension plans
Range
(1)
-0.25 to 11.15 -0.10 to 11.30
Weighted average 3.14 3.65
Non-U.S. postretirement plans
Range 0.80 to 8.55 0.90 to 9.10
Weighted average 7.42 7.76
Future compensation increase rate
(2)
Non-U.S. pension plans
Range 1.20 to 11.25 1.50 to 11.50
Weighted average 3.10 3.17
Expected return on assets
U.S. plans
Qualified pension 5.80 6.70
Postretirement
(3)
5.80/1.50 6.70/3.00
Non-U.S. pension plans
Range 0.00 to 11.50 0.00 to 11.50
Weighted average 3.39 3.95
Non-U.S. postretirement plans
Range 5.95 to 8.00 6.20 to 8.00
Weighted average 7.99 7.99
(1) Due to substantial downward movement in yields, there were negative
discount rates for plans with relatively short duration in major markets,
such as the Eurozone and Switzerland.
(2) Not material for U.S. plans.
(3) For the year ended 2020 and 2019, the expected return on assets for the
VEBA Trust was 1.50% and 3.00% respectively.
During the year 2020 2019 2018
Discount rate
U.S. plans
Qualified
pension
3.25%/3.20%/
2.60%/2.55%
4.25%/3.85%/
3.45%/3.10%
3.60%/3.95%/
4.25%/4.30%
Nonqualified
pension
3.25/3.25/
2.55/2.50
4.25/3.90/
3.50/3.10
3.60/3.95/
4.25/4.30
Postretirement
3.15/3.20/
2.45/2.35
4.20/3.80/
3.35/3.00
3.50/3.90/
4.20/4.20
Non-U.S. pension plans
(1)
Range
(2)
-0.10 to 11.30 -0.05 to 12.00 0.00 to 10.75
Weighted
average 3.65 4.47 4.17
Non-U.S. postretirement plans
(1)
Range 0.90 to 9.75 1.75 to 10.75 1.75 to 10.10
Weighted
average 7.76 9.05 8.10
Future compensation increase rate
(3)
Non-U.S. pension plans
(1)
Range 1.50 to 11.50 1.30 to 13.67 1.17 to 13.67
Weighted
average 3.17 3.16 3.08
Expected return on assets
U.S. plans
Qualified
pension
(4)
6.70 6.70 6.80/6.70
Postretirement
(4)
6.70/3.00 6.70/3.00 6.80/6.70/3.00
Non-U.S. pension plans
(1)
Range 0.00 to 11.50 1.00 to 11.50 0.00 to 11.60
Weighted
average 3.95 4.30 4.52
Non-U.S. postretirement plans
(1)
Range 6.20 to 8.00 8.00 to 9.20 8.00 to 9.80
Weighted
average 7.99 8.01 8.01
(1) Reflects rates utilized to determine the quarterly expense for Significant
non-U.S. pension and postretirement plans.
(2) Due to substantial downward movement in yields, there were negative
discount rates for plans with relatively short duration in major markets,
such as the Eurozone and Switzerland.
(3) Not material for U.S. plans.
(4) The expected return on assets for the U.S. pension and postretirement
plans was lowered from 6.70% to 5.80% effective January 1, 2021 to
reflect the lower interest rate environment and a change in target asset
allocation.
175

Discount Rate
The discount rates for the U.S. pension and postretirement
plans were selected by reference to a Citigroup-specific
analysis using each plan’s specific cash flows and compared
with high-quality corporate bond indices for reasonableness.
The discount rates for the non-U.S. pension and postretirement
plans are selected by reference to high-quality corporate bond
rates in countries that have developed corporate bond markets.
However, where developed corporate bond markets do not
exist, the discount rates are selected by reference to local
government bond rates with a premium added to reflect the
additional risk for corporate bonds in certain countries.
Effective December 31, 2019, the established rounding
convention is to the nearest 5 bps for all countries.
Expected Return on Assets
The Company determines its assumptions for the expected
return on assets for its U.S. pension and postretirement plans
using a “building block” approach, which focuses on ranges of
anticipated rates of return for each asset class. A weighted
average range of nominal rates is then determined based on
target allocations to each asset class. Market performance over
a number of earlier years is evaluated covering a wide range of
economic conditions to determine whether there are sound
reasons for projecting any past trends.
The Company considers the expected return on assets to
be a long-term assessment of return expectations and does not
anticipate changing this assumption unless there are
significant changes in investment strategy or economic
conditions. This contrasts with the selection of the discount
rate and certain other assumptions, which are reconsidered
annually (or quarterly for the Significant Plans) in accordance
with GAAP.
The expected return on assets for the U.S. pension and
postretirement plans Trust was 5.80% at December 31, 2020
and 6.70% at December 31, 2019 and 2018. The expected
return on assets reflects the expected annual appreciation of
the plan assets and reduces the Company’s annual pension
expense. The expected return on assets is deducted from the
sum of service cost, interest cost and other components of
pension expense to arrive at the net pension (benefit) expense.
The following table shows the expected return on assets
used in determining the Company’s pension expense
compared to the actual return on assets during 2020, 2019 and
2018 for the U.S. pension and postretirement plans:
U.S. plans
(During the year) 2020 2019 2018
Expected return on
assets
U.S. pension and
postretirement trust 6.70% 6.70% 6.80%/6.70%
VEBA trust 3.00 3.00 3.00
Actual return on
assets
(1)
U.S. pension and
postretirement trust 12.84 15.20 -3.40
VEBA trust 2.11 1.91 to 2.76 0.43 to 1.41
(1) Actual return on assets is presented net of fees.
Sensitivities of Certain Key Assumptions
The following tables summarize the effect on pension
expense:
Discount rate
One-percentage-point increase
In millions of dollars
2020 2019 2018
U.S. plans $ 34 $ 28 $ 25
Non-U.S. plans (16) (19) (22)
One-percentage-point decrease
In millions of dollars
2020 2019 2018
U.S. plans $ (52) $ (44) $ (37)
Non-U.S. plans 25 32 32
The U.S. Qualified Pension Plan was frozen in 2008, and
as a result, most service costs have been eliminated. The
pension expense for the U.S. Qualified Pension Plan is
therefore driven primarily by interest cost rather than by
service cost. An increase in the discount rate generally
increases pension expense.
For Non-U.S. Pension Plans that are not frozen (in
countries such as Mexico, the U.K. and South Korea), there is
more service cost. The pension expense for the Non-U.S.
Plans is driven by both service cost and interest cost. An
increase in the discount rate generally decreases pension
expense due to the greater impact on service cost compared to
interest cost.
Since the U.S. Qualified Pension Plan was frozen, most of
the prospective service cost has been eliminated and the gain/
loss amortization period was changed to the life expectancy
for inactive participants. As a result, pension expense for the
U.S. Qualified Pension Plan is driven more by interest costs
than service costs, and an increase in the discount rate would
increase pension expense, while a decrease in the discount rate
would decrease pension expense.
The following tables summarize the effect on pension
expense:
Expected return on assets
One-percentage-point increase
In millions of dollars
2020 2019 2018
U.S. plans $ (123) $ (123) $ (126)
Non-U.S. plans (66) (64) (64)
One-percentage-point decrease
In millions of dollars
2020 2019 2018
U.S. plans $ 123 $ 123 $ 126
Non-U.S. plans 66 64 64
176
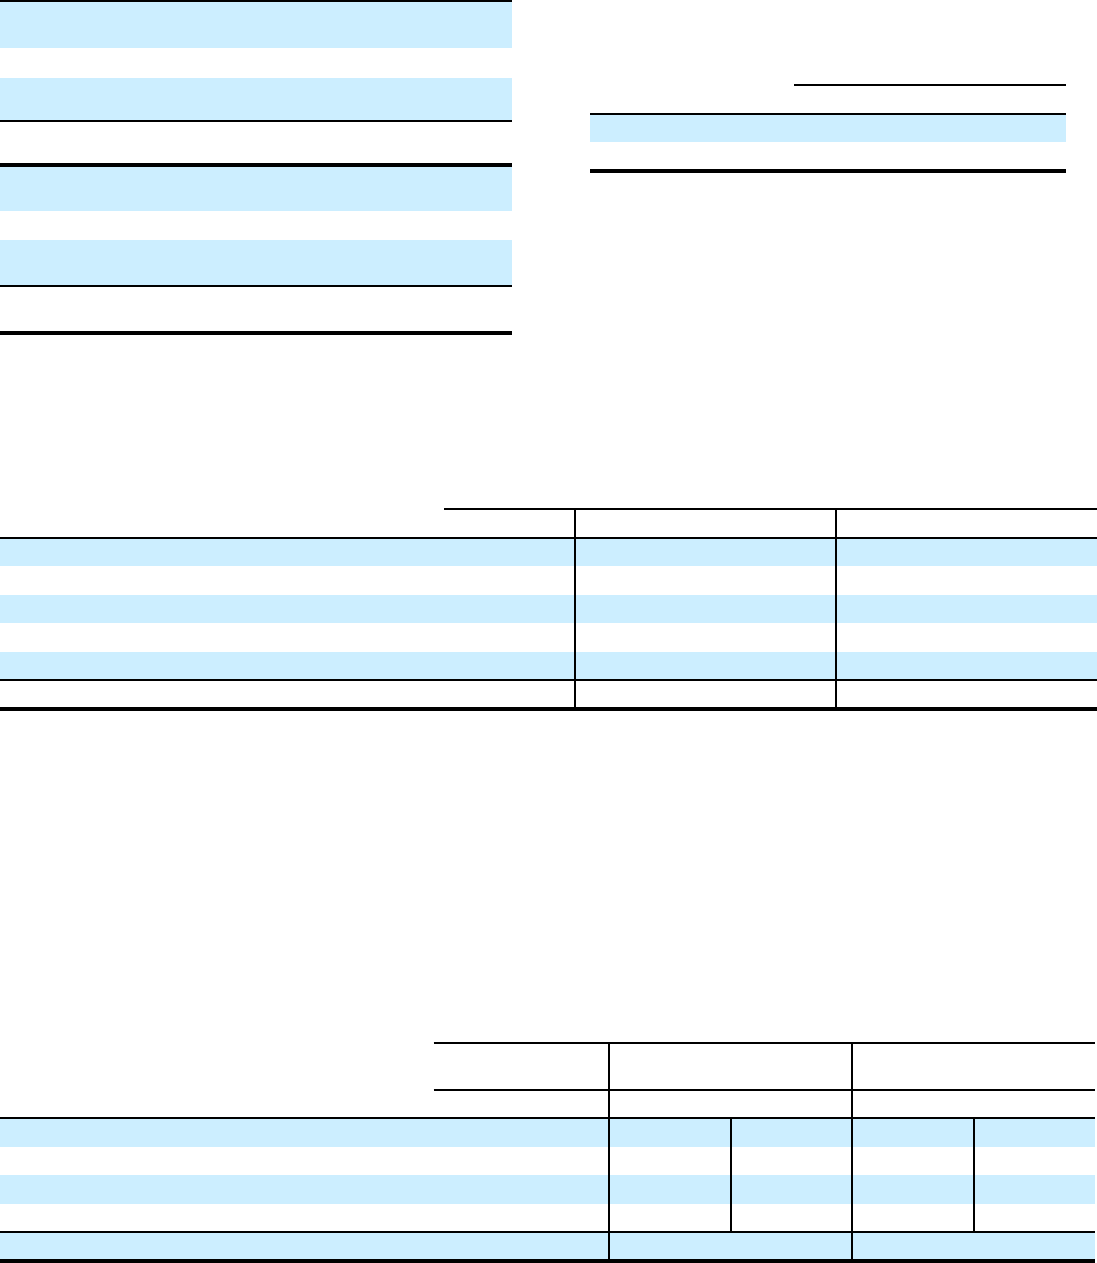
Health Care Cost Trend Rate
Assumed health care cost trend rates were as follows:
2020 2019
Health care cost increase rate for
U.S. plans
Following year 6.50% 6.75%
Ultimate rate to which cost increase is
assumed to decline 5.00 5.00
Year in which the ultimate rate is
reached 2027 2027
Health care cost increase rate for
non-U.S. plans (weighted average)
Following year 6.85% 6.85%
Ultimate rate to which cost increase is
assumed to decline 6.85 6.85
Year in which the ultimate rate
is reached 2021 2020
Interest Crediting Rate
The Company has cash balance plans and other plans with
promised interest crediting rates. For these plans, the interest
crediting rates are set in line with plan rules or country
legislation and do not change with market conditions.
Weighted average interest
crediting rate
At year end 2020 2019 2018
U.S. plans 1.45% 2.25% 3.25%
Non-U.S. plans 1.60 1.61 1.68
Plan Assets
Citigroup’s pension and postretirement plans’ asset allocations for the U.S. plans and the target allocations by asset category based on
asset fair values, are as follows:
Target asset
allocation
U.S. pension assets
at December 31,
U.S. postretirement assets
at December 31,
Asset category
(1)
2021 2020 2019 2020 2019
Equity securities
(2)
0–26% 16 % 17 % 16 % 17 %
Debt securities
(3)
35–82 59 58 59 58
Real estate 0–7 4 4 4 4
Private equity 0–10 3 3 3 3
Other investments 0–30 18 18 18 18
Total 100 % 100 % 100 % 100 %
(1) Asset allocations for the U.S. plans are set by investment strategy, not by investment product. For example, private equities with an underlying investment in real
estate are classified in the real estate asset category, not private equity.
(2) Equity securities in the U.S. pension and postretirement plans do not include any Citigroup common stock at the end of 2020 and 2019.
(3) The VEBA Trust for postretirement benefits is primarily invested in cash equivalents and debt securities in 2020 and 2019 and is not reflected in the table above.
Third-party investment managers and advisors provide
their services to Citigroup’s U.S. pension and postretirement
plans. Assets are rebalanced as the Company’s Pension Plan
Investment Committee deems appropriate. Citigroup’s
investment strategy, with respect to its assets, is to maintain a
globally diversified investment portfolio across several asset
classes that, when combined with Citigroup’s contributions to
the plans, will maintain the plans’ ability to meet all required
benefit obligations.
Citigroup’s pension and postretirement plans’ weighted-
average asset allocations for the non-U.S. plans and the actual
ranges, and the weighted-average target allocations by asset
category based on asset fair values, are as follows:
Non-U.S. pension plans
Target asset
allocation
Actual range
at December 31,
Weighted-average
at December 31,
Asset category
(1)
2021 2020 2019 2020 2019
Equity securities 0–100% 0–100% 0–100% 15 % 13 %
Debt securities 0–100 0–100 0–100 77 80
Real estate 0–15 0–12 0–15 1 1
Other investments 0–100 0–100 0–100 7 6
Total 100 % 100 %
(1) Similar to the U.S. plans, asset allocations for certain non-U.S. plans are set by investment strategy, not by investment product.
177
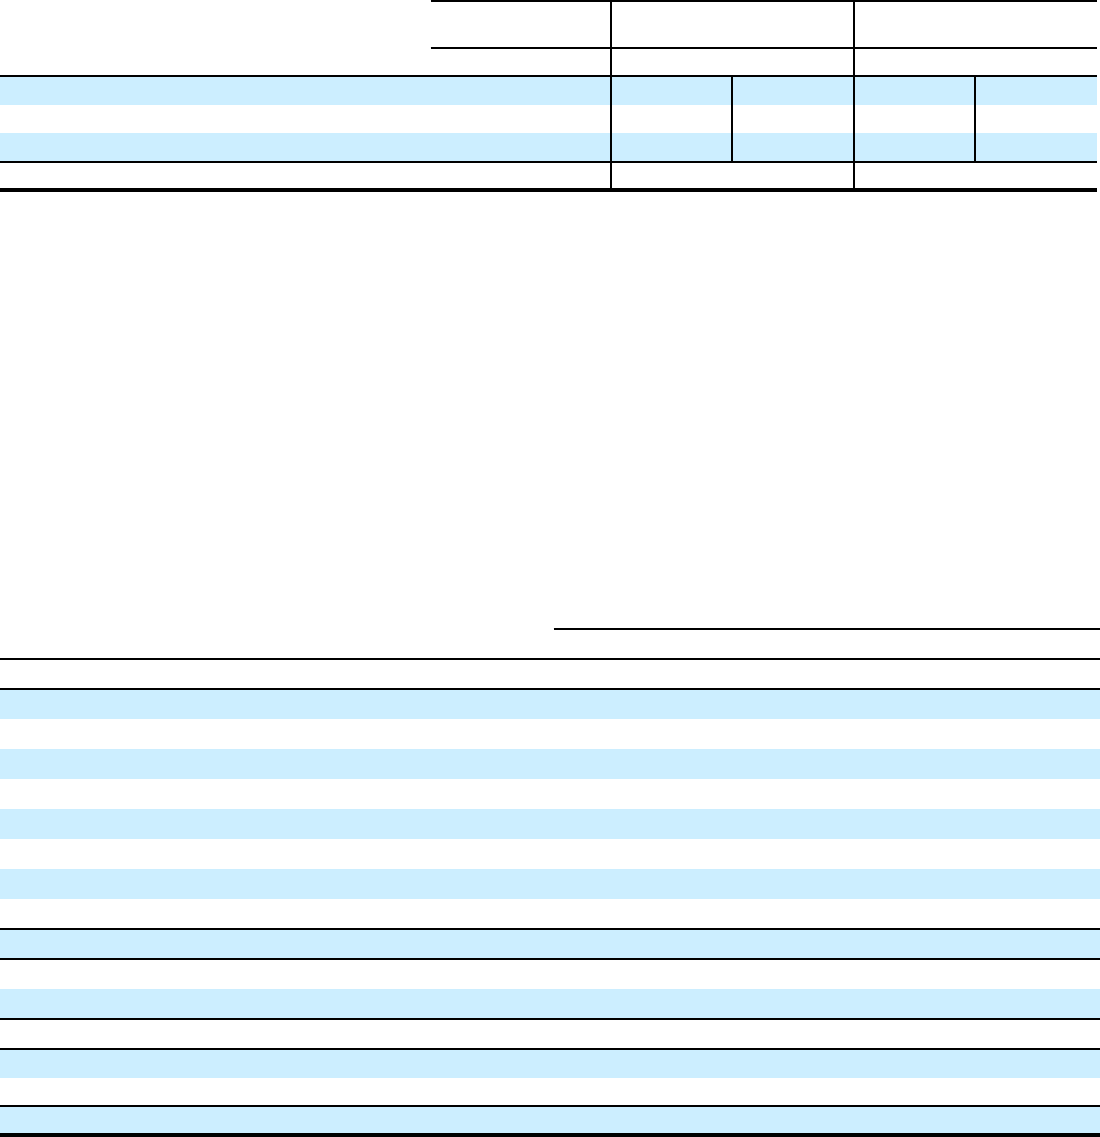
Non-U.S. postretirement plans
Target asset
allocation
Actual range
at December 31,
Weighted-average
at December 31,
Asset category
(1)
2021 2020 2019 2020 2019
Equity securities 0–38% 0–38% 0–31% 38 % 27 %
Debt securities 56–100 56–100 66–100 56 71
Other investments 0–6 0–6 0–3 6 2
Total 100 % 100 %
(1) Similar to the U.S. plans, asset allocations for certain non-U.S. plans are set by investment strategy, not by investment product.
Fair Value Disclosure
For information on fair value measurements, including
descriptions of Levels 1, 2 and 3 of the fair value hierarchy
and the valuation methodology utilized by the Company, see
Notes 1 and 24 to the Consolidated Financial Statements.
Investments measured using the NAV per share practical
expedient are excluded from Level 1, Level 2 and Level 3 in
the tables below.
Certain investments may transfer between the fair value
hierarchy classifications during the year due to changes in
valuation methodology and pricing sources.
Plan assets by detailed asset categories and the fair value
hierarchy are as follows:
U.S. pension and postretirement benefit plans
(1)
In millions of dollars
Fair value measurement at December 31, 2020
Asset categories Level 1 Level 2 Level 3 Total
U.S. equities $ 813 $ — $ — $ 813
Non-U.S. equities 725 — — 725
Mutual funds and other registered investment companies 447 — — 447
Commingled funds — 1,074 — 1,074
Debt securities 1,275 4,429 — 5,704
Annuity contracts — — 1 1
Derivatives 8 6 — 14
Other investments 16 — 57 73
Total investments $ 3,284 $ 5,509 $ 58 $ 8,851
Cash and short-term investments $ 72 $ 1,035 $ — $ 1,107
Other investment liabilities (2) (10) — (12)
Net investments at fair value $ 3,354 $ 6,534 $ 58 $ 9,946
Other investment receivables redeemed at NAV $ 99
Securities valued at NAV 3,595
Total net assets $ 13,640
(1) The investments of the U.S. pension and postretirement plans are commingled in one trust. At December 31, 2020, the allocable interests of the U.S. pension and
postretirement plans were 98.0% and 2.0%, respectively. The investments of the VEBA Trust for postretirement benefits are reflected in the above table.
178

U.S. pension and postretirement benefit plans
(1)
In millions of dollars
Fair value measurement at December 31, 2019
Asset categories Level 1 Level 2 Level 3 Total
U.S. equities $ 739 $ — $ — $ 739
Non-U.S. equities 553 — — 553
Mutual funds and other registered investment companies 280 — — 280
Commingled funds — 1,410 — 1,410
Debt securities 1,534 4,046 — 5,580
Annuity contracts — — 1 1
Derivatives 10 7 — 17
Other investments — — 75 75
Total investments $ 3,116 $ 5,463 $ 76 $ 8,655
Cash and short-term investments $ 93 $ 1,080 $ — $ 1,173
Other investment liabilities (87) (11) — (98)
Net investments at fair value $ 3,122 $ 6,532 $ 76 $ 9,730
Other investment receivables redeemed at NAV $ 22
Securities valued at NAV 3,310
Total net assets $ 13,062
(1) The investments of the U.S. pension and postretirement plans are commingled in one trust. At December 31, 2019, the allocable interests of the U.S. pension and
postretirement plans were 98.0% and 2.0%, respectively. The investments of the VEBA Trust for postretirement benefits are reflected in the above table.
Non-U.S. pension and postretirement benefit plans
In millions of dollars
Fair value measurement at December 31, 2020
Asset categories Level 1 Level 2 Level 3 Total
U.S. equities $ 5 $ 16 $ — $ 21
Non-U.S. equities 105 670 — 775
Mutual funds and other registered investment companies 3,137 73 — 3,210
Commingled funds 24 — — 24
Debt securities 6,705 1,420 — 8,125
Real estate — 2 2 4
Annuity contracts — — 5 5
Derivatives — 1,005 — 1,005
Other investments — — 312 312
Total investments $ 9,976 $ 3,186 $ 319 $ 13,481
Cash and short-term investments $ 129 $ 3 $ — $ 132
Other investment liabilities — (4,650) — (4,650)
Net investments at fair value $ 10,105 $ (1,461) $ 319 $ 8,963
Securities valued at NAV $ 14
Total net assets $ 8,977
179
Non-U.S. pension and postretirement benefit plans
In millions of dollars
Fair value measurement at December 31, 2019
Asset categories Level 1 Level 2 Level 3 Total
U.S. equities $ 4 $ 12 $ — $ 16
Non-U.S. equities 127 262 — 389
Mutual funds and other registered investment companies 3,223 63 — 3,286
Commingled funds 23 — — 23
Debt securities 4,307 1,615 10 5,932
Real estate — 3 1 4
Annuity contracts — — 5 5
Derivatives — 1,590 — 1,590
Other investments 1 — 274 275
Total investments $ 7,685 $ 3,545 $ 290 $ 11,520
Cash and short-term investments $ 86 $ 3 $ — $ 89
Other investment liabilities (3) (2,938) — (2,941)
Net investments at fair value $ 7,768 $ 610 $ 290 $ 8,668
Securities valued at NAV $ 15
Total net assets $ 8,683
180

Level 3 Rollforward
The reconciliations of the beginning and ending balances during the year for Level 3 assets are as follows:
In millions of dollars
U.S. pension and postretirement benefit plans
Asset categories
Beginning Level 3
fair value at
Dec. 31, 2019 Realized (losses) Unrealized gains
Purchases,
sales and
issuances
Transfers in and/
or out of Level 3
Ending Level 3
fair value at
Dec. 31, 2020
Annuity contracts $ 1 $ — $ — $ — $ — $ 1
Other investments 75 (3) 3 (18) — 57
Total investments $ 76 $ (3) $ 3 $ (18) $ — $ 58
In millions of dollars
U.S. pension and postretirement benefit plans
Asset categories
Beginning Level 3
fair value at
Dec. 31, 2018 Realized (losses) Unrealized (losses)
Purchases,
sales and issuances
Transfers in and/
or out of Level 3
Ending Level 3
fair value at
Dec. 31, 2019
Annuity contracts $ 1 $ — $ — $ — $ — $ 1
Other investments 127 (7) 12 (57) — 75
Total investments $ 128 $ (7) $ 12 $ (57) $ — $ 76
In millions of dollars
Non-U.S. pension and postretirement benefit plans
Asset categories
Beginning Level 3
fair value at
Dec. 31, 2019 Unrealized gains
Purchases, sales and
issuances
Transfers in and/
or out of Level 3
Ending Level 3
fair value at
Dec. 31, 2020
Debt securities $ 10 $ — $ (10) $ — $ —
Real estate 1 1 — — 2
Annuity contracts 5 — — — 5
Other investments 274 23 15 — 312
Total investments $ 290 $ 24 $ 5 $ — $ 319
In millions of dollars
Non-U.S. pension and postretirement benefit plans
Asset categories
Beginning Level 3
fair value at
Dec. 31, 2018 Unrealized (losses)
Purchases, sales and
issuances
Transfers in and/
or out of Level 3
Ending Level 3
fair value at
Dec. 31, 2019
Debt securities $ 9 $ 1 $ — $ — $ 10
Real estate 1 — — — 1
Annuity contracts 10 — (5) — 5
Other investments 210 7 57 — 274
Total investments $ 230 $ 8 $ 52 $ — $ 290
181
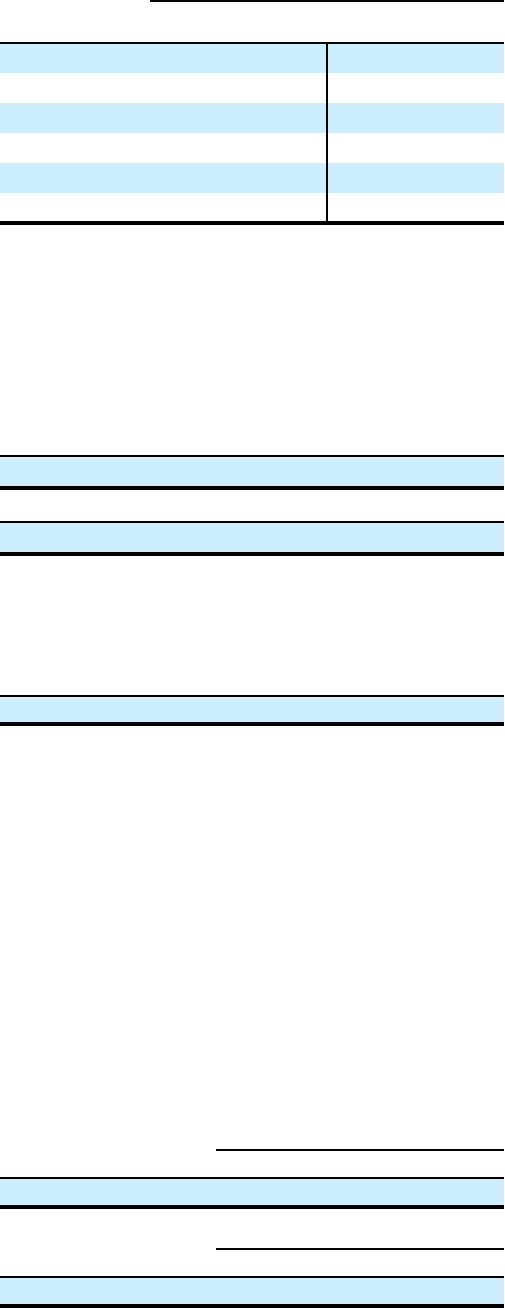
Investment Strategy
The Company’s global pension and postretirement funds’
investment strategy is to invest in a prudent manner for the
exclusive purpose of providing benefits to participants. The
investment strategies are targeted to produce a total return that,
when combined with the Company’s contributions to the
funds, will maintain the funds’ ability to meet all required
benefit obligations. Risk is controlled through diversification
of asset types and investments in domestic and international
equities, fixed income securities and cash and short-term
investments. The target asset allocation in most locations
outside the U.S. is primarily in equity and debt securities.
These allocations may vary by geographic region and country
depending on the nature of applicable obligations and various
other regional considerations. The wide variation in the actual
range of plan asset allocations for the funded non-U.S. plans is
a result of differing local statutory requirements and economic
conditions. For example, in certain countries local law requires
that all pension plan assets must be invested in fixed income
investments, government funds or local-country securities.
Significant Concentrations of Risk in Plan Assets
The assets of the Company’s pension plans are diversified to
limit the impact of any individual investment. The U.S.
qualified pension plan is diversified across multiple asset
classes, with publicly traded fixed income, publicly traded
equity, hedge funds, and real estate representing the most
significant asset allocations. Investments in these four asset
classes are further diversified across funds, managers,
strategies, vintages, sectors and geographies, depending on the
specific characteristics of each asset class. The pension assets
for the Company’s non-U.S. Significant Plans are primarily
invested in publicly traded fixed income and publicly traded
equity securities.
Oversight and Risk Management Practices
The framework for the Company’s pension oversight process
includes monitoring of retirement plans by plan fiduciaries
and/or management at the global, regional or country level, as
appropriate. Independent Risk Management contributes to the
risk oversight and monitoring for the Company’s U.S.
qualified pension plan and non-U.S. Significant Pension Plans.
Although the specific components of the oversight process are
tailored to the requirements of each region, country and plan,
the following elements are common to the Company’s
monitoring and risk management process:
• periodic asset/liability management studies and strategic
asset allocation reviews;
• periodic monitoring of funding levels and funding ratios;
• periodic monitoring of compliance with asset allocation
guidelines;
• periodic monitoring of asset class and/or investment
manager performance against benchmarks; and
• periodic risk capital analysis and stress testing.
Estimated Future Benefit Payments
The Company expects to pay the following estimated benefit
payments in future years:
Pension plans
Postretirement
benefit plans
In millions of dollars
U.S.
plans
Non-
U.S. plans
U.S.
plans
Non-
U.S. plans
2021 $ 820 $ 566 $ 58 $ 76
2022 832 504 55 80
2023 847 507 52 85
2024 852 521 49 90
2025 857 527 45 96
2026–2030 4,101 2,698 181 550
Post Employment Plans
The Company sponsors U.S. post employment plans that
provide income continuation and health and welfare benefits
to certain eligible U.S. employees on long-term disability.
The following table summarizes the funded status and
amounts recognized in the Company’s Consolidated Balance
Sheet:
In millions of dollars
2020 2019
Funded status of the plan at year end $ (40) $ (38)
Net amount recognized in AOCI (pretax) $ (17) $ (15)
The following table summarizes the net expense (benefit)
recognized in the Consolidated Statement of Income for the
Company’s U.S. post employment plans:
In millions of dollars
2020 2019 2018
Net expense (benefit) $ 9 $ 9 $ (18)
Defined Contribution Plans
The Company sponsors defined contribution plans in the U.S.
and in certain non-U.S. locations, all of which are
administered in accordance with local laws. The most
significant defined contribution plan is the Citi Retirement
Savings Plan sponsored by the Company in the U.S.
Under the Citi Retirement Savings Plan, eligible U.S.
employees received matching contributions of up to 6% of
their eligible compensation for 2020 and 2019, subject to
statutory limits. In addition, for eligible employees whose
eligible compensation is $100,000 or less, a fixed contribution
of up to 2% of eligible compensation is provided. All
Company contributions are invested according to participants’
individual elections. The following tables summarize the
Company contributions for the defined contribution plans:
U.S. plans
In millions of dollars
2020 2019 2018
Company contributions $ 414 $ 404 $ 396
Non-U.S. plans
In millions of dollars
2020 2019 2018
Company contributions $ 304 $ 281 $ 283
182

9. INCOME TAXES
Income Tax Provision
Details of the Company’s income tax provision are presented
below:
In millions of dollars
2020 2019 2018
Current
Federal $ 305 $ 365 $ 834
Non-U.S. 4,113 4,352 4,290
State 440 323 284
Total current income taxes $ 4,858 $ 5,040 $ 5,408
Deferred
Federal $ (1,430) $ (907) $ (620)
Non-U.S. (690) 10 371
State (213) 287 198
Total deferred income taxes $ (2,333) $ (610) $ (51)
Provision for income tax on
continuing operations before
noncontrolling interests
(1)
$ 2,525 $ 4,430 $ 5,357
Provision (benefit) for income taxes on
discontinued operations — (27) (18)
Income tax expense (benefit) reported
in stockholders’ equity related to:
FX translation 23 (11) (263)
Investment securities 1,214 648 (346)
Employee stock plans (4) (16) (2)
Cash flow hedges 455 269 (8)
Benefit plans (23) (119) (20)
FVO DVA (141) (337) 302
Excluded fair value hedges (8) 8 (17)
Retained earnings
(2)
(911) 46 (305)
Income taxes before noncontrolling
interests $ 3,130 $ 4,891 $ 4,680
(1) Includes the tax on realized investment gains and impairment losses
resulting in a provision (benefit) of $454 million and $(14) million in
2020, $373 million and $(9) million in 2019 and $104 million and $(32)
million in 2018, respectively.
(2) 2020 reflects the tax effect of ASU 2016-13 for current expected credit
losses (CECL). 2019 reflects the tax effect of the accounting change for
ASU 2016-02 for lease transactions. 2018 reflects the tax effect of the
accounting change for ASU 2016-16 for intra-entity transfers of assets
and the tax effect of the accounting change for ASU 2018-03, to report
the net unrealized gains on former AFS equity securities. See Note 1 to
the Consolidated Financial Statements.
Tax Rate
The reconciliation of the federal statutory income tax rate to
the Company’s effective income tax rate applicable to income
from continuing operations (before noncontrolling interests
and the cumulative effect of accounting changes) for each of
the periods indicated is as follows:
2020 2019 2018
Federal statutory rate 21.0 % 21.0 % 21.0 %
State income taxes, net of federal
benefit 1.3 1.9 1.8
Non-U.S. income tax rate differential 3.5 1.3 5.3
Effect of tax law changes
(1)
— (0.5) (0.6)
Nondeductible FDIC premiums 1.3 0.4 0.7
Basis difference in affiliates (0.1) (0.1) (2.4)
Tax advantaged investments (4.4) (2.3) (2.0)
Valuation allowance releases
(2)
(4.4) (3.0) —
Other, net 0.3 (0.2) (1.0)
Effective income tax rate 18.5 % 18.5 % 22.8 %
(1) 2018 includes one-time Tax Reform benefits of $94 million for amounts
that were considered provisional pursuant to SAB 118.
(2) See “Deferred Tax Assets” below for a description of the components.
As set forth in the table above, Citi’s effective tax rate for
2020 was 18.5%, the same as 2019.
Deferred Income Taxes
Deferred income taxes at December 31 related to the
following:
In millions of dollars
2020 2019
Deferred tax assets
Credit loss deduction $ 6,791 $ 3,809
Deferred compensation and employee benefits 2,510 2,224
U.S. tax on non-U.S. earnings 1,195 1,030
Investment and loan basis differences 1,486 2,727
Tax credit and net operating loss carry-forwards 17,416 19,711
Fixed assets and leases 2,935 2,607
Other deferred tax assets 3,832 3,341
Gross deferred tax assets $ 36,165 $ 35,449
Valuation allowance $ 5,177 $ 6,476
Deferred tax assets after valuation allowance $ 30,988 $ 28,973
Deferred tax liabilities
Intangibles and leases $ (2,526) $ (2,640)
Debt issuances (50) (201)
Non-U.S. withholding taxes (921) (974)
Interest-related items (597) (587)
Other deferred tax liabilities (2,054) (1,477)
Gross deferred tax liabilities $ (6,148) $ (5,879)
Net deferred tax assets $ 24,840 $ 23,094
183
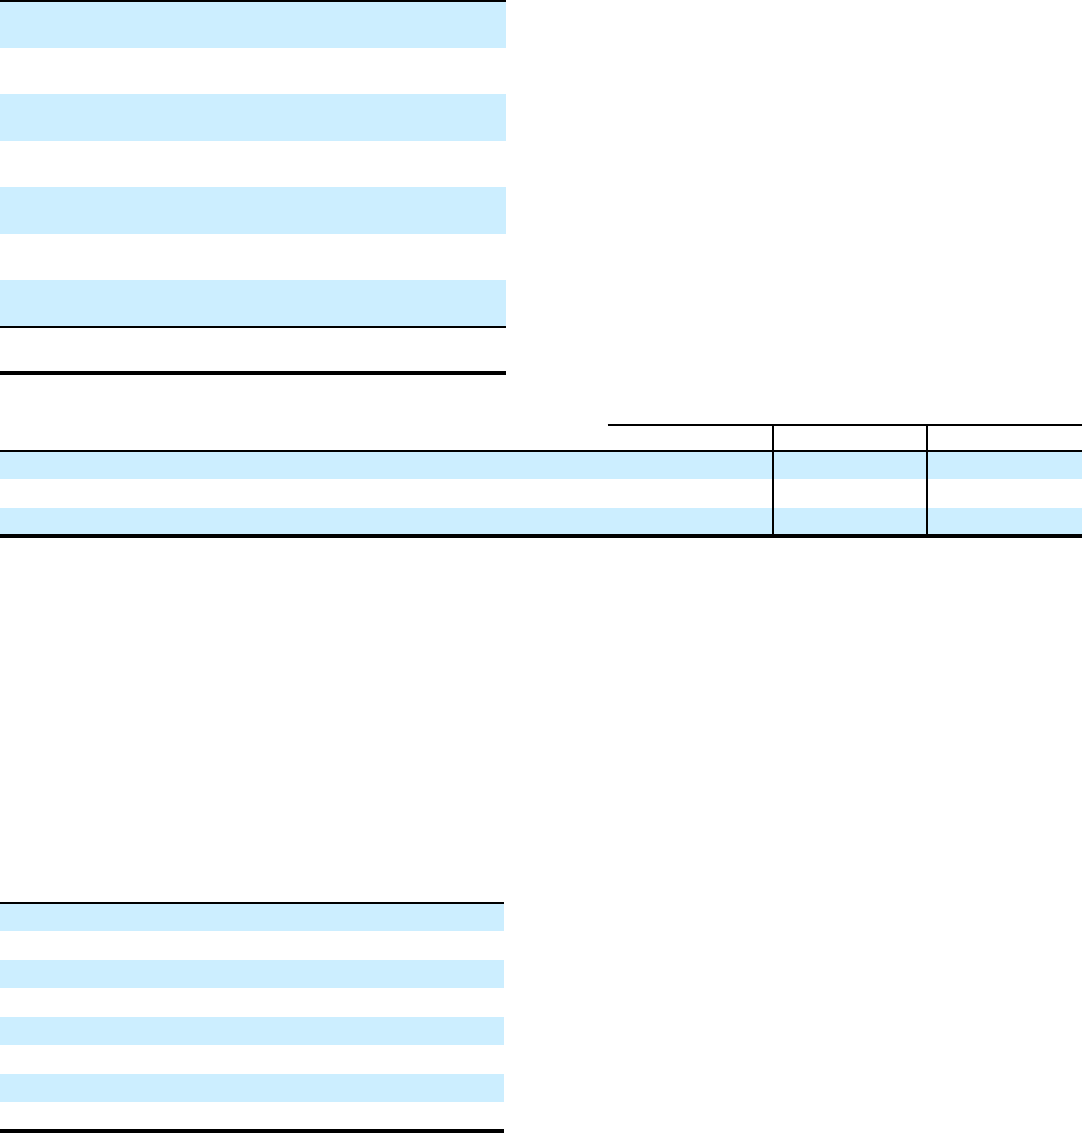
Unrecognized Tax Benefits
The following is a rollforward of the Company’s unrecognized
tax benefits:
In millions of dollars
2020 2019 2018
Total unrecognized tax benefits at
January 1 $ 721 $ 607 $ 1,013
Net amount of increases for current
year’s tax positions 51 50 40
Gross amount of increases for prior
years’ tax positions 217 151 46
Gross amount of decreases for prior
years’ tax positions (74) (44) (174)
Amounts of decreases relating to
settlements (40) (21) (283)
Reductions due to lapse of statutes of
limitation (13) (23) (23)
Foreign exchange, acquisitions and
dispositions (1) 1 (12)
Total unrecognized tax benefits at
December 31 $ 861 $ 721 $ 607
The total amounts of unrecognized tax benefits at
December 31, 2020, 2019 and 2018 that, if recognized, would
affect Citi’s tax expense are $0.7 billion, $0.6 billion and $0.4
billion, respectively. The remaining uncertain tax positions
have offsetting amounts in other jurisdictions or are temporary
differences.
Interest and penalties (not included in unrecognized tax
benefits above) are a component of Provision for income
taxes.
2020 2019 2018
In millions of dollars
Pretax Net of tax Pretax Net of tax Pretax Net of tax
Total interest and penalties on the Consolidated Balance Sheet at January 1 $ 100 $ 82 $ 103 $ 85 $ 121 $ 101
Total interest and penalties in the Consolidated Statement of Income 14 10 (4) (4) 6 6
Total interest and penalties on the Consolidated Balance Sheet at December 31
(1)
118 96 100 82 103 85
(1) Includes $4 million, $3 million and $2 million for non-U.S. penalties in 2020, 2019 and 2018. Also includes $1 million, $1 million and $1 million for state
penalties in 2020, 2019 and 2018.
As of December 31, 2020, Citi was under audit by the
Internal Revenue Service and other major taxing jurisdictions
around the world. It is thus reasonably possible that significant
changes in the gross balance of unrecognized tax benefits may
occur within the next 12 months.The potential range of
amounts that could affect Citi’s effective tax rate is between
$0 and $150 million.
The following are the major tax jurisdictions in which the
Company and its affiliates operate and the earliest tax year
subject to examination:
Jurisdiction Tax year
United States 2016
Mexico 2016
New York State and City 2009
United Kingdom 2016
India 2016
Singapore 2011
Hong Kong 2014
Ireland 2016
Non-U.S. Earnings
Non-U.S. pretax earnings approximated $13.8 billion in 2020,
$16.7 billion in 2019 and $16.1 billion in 2018. As a U.S.
corporation, Citigroup and its U.S. subsidiaries are currently
subject to U.S. taxation on all non-U.S. pretax earnings of
non-U.S. branches. Beginning in 2018, there is a separate
foreign tax credit (FTC) basket for branches. Also, dividends
from a non-U.S. subsidiary or affiliate are effectively exempt
from U.S. taxation. The Company provides income taxes on
the book over tax basis differences of non-U.S. subsidiaries
except to the extent that such differences are indefinitely
reinvested outside the U.S.
At December 31, 2020, $11.0 billion of basis differences
of non-U.S. entities was indefinitely invested. At the existing
tax rates, additional taxes (net of U.S. FTCs) of $4.3 billion
would have to be provided if such assertions were reversed.
Income taxes are not provided for the Company’s
“savings bank base year bad debt reserves” that arose before
1988, because under current U.S. tax rules, such taxes will
become payable only to the extent that such amounts are
distributed in excess of limits prescribed by federal law. At
December 31, 2020, the amount of the base year reserves
totaled approximately $358 million (subject to a tax of $75
million).
184
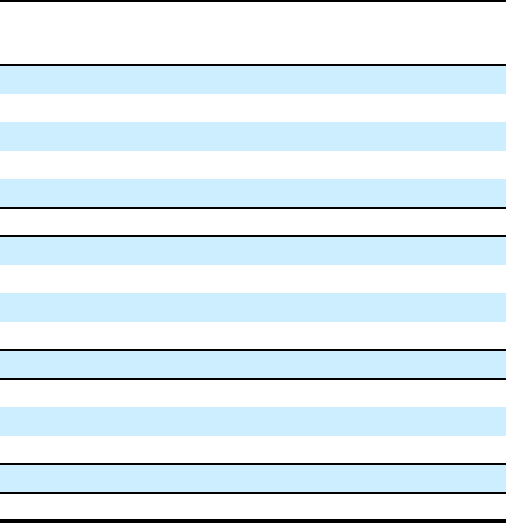
Deferred Tax Assets
As of December 31, 2020, Citi had a valuation allowance of
$5.2 billion, composed of valuation allowances of $1.0 billion
on its general basket FTC carry-forwards, $2.4 billion on its
branch basket FTC carry-forwards, $1.0 billion on its U.S.
residual DTA related to its non-U.S. branches, $0.6 billion on
local non-U.S. DTAs and $0.2 billion on state net operating
loss carry-forwards. The amount of Citi’s valuation
allowances (VA) may change in future years.
In 2020, Citi’s VA for carry-forward FTCs in its branch
basket decreased by $1.0 billion and the related VA for the
U.S. tax effect on non-U.S. branch temporary differences
increased by $0.2 billion. Of this total branch-related change
of $0.8 billion, $0.6 billion impacted the tax provision as
discussed below. The remainder of the branch basket-related
VA decrease of $0.2 billion was primarily due to carry-
forward expirations and changes in foreign exchange rates.
The level of branch pretax income, the local branch tax rate
and the allocations of Overall Domestic Loss (ODL) and
expenses for U.S. tax purposes to the branch basket are the
main factors in determining the branch VA. Citi computed
these factors for 2020. While the COVID-19 pandemic
reduced branch earnings, the allocated ODL was not
diminished since a large portion of the pandemic losses will
not be recognizable for U.S. taxable income until a future
period. In addition, lower than forecasted U.S. interest rates
resulted in a lower allocation of interest expense to non-U.S.
branches. The combination of the factors enumerated are
reflected in the VA release of $0.5 billion in Citi’s full-year
effective tax rate. Citi also released branch basket VA of
$0.1 billion in the fourth quarter, with respect to future years,
based upon Citi’s Operating Plan and estimates of future
branch basket factors, as outlined above.
In Citi’s general basket for FTCs, changes in the
forecasted amount of income in U.S. locations derived from
sources outside the U.S., in addition to tax examination
changes from prior years, could alter the amount of valuation
allowance that is needed against such FTCs. The valuation
allowance for the general basket decreased by $0.1 billion to
$1.0 billion, primarily due to the expiration of carry-forwards
in 2020. In the general FTC basket, foreign source income, an
important driver in the utilization of FTC carry-forwards for
the current year and future years, has been reduced due to the
compression in interest rate spreads. The pandemic has
otherwise reduced U.S. income, which impacts ODL usage
and, correspondingly, the utilization of FTC carry-forwards.
Accordingly, management identified actions, which became
prudent due to the effects of the pandemic, to increase future
foreign source income and U.S. taxable income. These
planning actions include geographic asset movements, deferral
of future FTC recognition and capitalization of expenses for
tax purposes, resulting in no tax provision change to Citi’s
general basket VA in 2020. In light of the pandemic, Citi will
continue to monitor its forecasts and mix of earnings, which
could affect Citi’s valuation allowance against FTC carry-
forwards. Citi continues to look for additional actions that are
prudent and feasible, taking into account client, regulatory and
operational considerations.
The valuation allowance for U.S. residual DTA related to
its non-U.S. branches increased from $0.8 billion to $1.0
billion, primarily due to higher capitalized expenses. In
addition, the non-U.S. local valuation allowance was reduced
from $1.0 billion to $0.6 billion, primarily due to an expiration
of NOL carry-forwards in a non-U.S. jurisdiction. The
following table summarizes Citi’s DTAs:
In billions of dollars
Jurisdiction/component
(1)
DTAs balance
December 31,
2020
DTAs balance
December 31,
2019
U.S. federal
(2)
Net operating losses (NOLs)
(3)
$ 3.0 $ 2.8
Foreign tax credits (FTCs) 4.4 6.3
General business credits (GBCs) 3.6 2.5
Future tax deductions and credits 7.9 6.2
Total U.S. federal $ 18.9 $ 17.8
State and local
New York NOLs $ 1.5 $ 1.7
Other state NOLs 0.1 0.2
Future tax deductions 1.7 1.3
Total state and local $ 3.3 $ 3.2
Non-U.S.
NOLs $ 0.6 $ 0.5
Future tax deductions 2.0 1.6
Total non-U.S. $ 2.6 $ 2.1
Total $ 24.8 $ 23.1
(1) All amounts are net of valuation allowances.
(2) Included in the net U.S. federal DTAs of $18.9 billion as of December
31, 2020 were deferred tax liabilities of $3.7 billion that will reverse in
the relevant carry-forward period and may be used to support the DTAs.
(3) Consists of non-consolidated tax return NOL carry-forwards that are
eventually expected to be utilized in Citigroup’s consolidated tax return.
185
The following table summarizes the amounts of tax carry-
forwards and their expiration dates:
In billions of dollars
Year of expiration
December
31, 2020
December
31, 2019
U.S. tax return general basket foreign
tax credit carry-forwards
(1)
2020 $ — $ 0.9
2021 — 1.1
2022 2.3 2.4
2023 0.4 0.4
2025 1.4 1.4
2027 1.2 1.2
Total U.S. tax return general basket
foreign tax credit carry-forwards $ 5.3 $ 7.4
U.S. tax return branch basket foreign
tax credit carry-forwards
(1)
2020 $ — $ 0.7
2021 0.7 0.6
2022 1.0 1.0
2028 0.6 0.9
2029 0.2 0.3
Total U.S. tax return branch basket
foreign tax credit carry-forwards $ 2.5 $ 3.5
U.S. tax return general business credit
carry-forwards
2032 $ 0.3 $ —
2033 0.3 0.3
2034 0.2 0.2
2035 0.2 0.2
2036 0.2 0.1
2037 0.5 0.5
2038 0.5 0.5
2039 0.7 0.7
2040 0.7 —
Total U.S. tax return general business
credit carry-forwards $ 3.6 $ 2.5
U.S. subsidiary separate federal NOL
carry-forwards
2027 $ 0.1 $ 0.1
2028 0.1 0.1
2030 0.3 0.3
2033 1.5 1.6
2034 2.0 2.0
2035 3.3 3.3
2036 2.1 2.1
2037 1.0 1.0
Unlimited carry-forward period 3.9 3.0
Total U.S. subsidiary separate federal
NOL carry-forwards
(2)
$ 14.3 $ 13.5
New York State NOL carry-forwards
(2)
2034 $ 8.1 $ 9.9
New York City NOL carry-forwards
(2)
2034 $ 8.7 $ 10.0
Non-U.S. NOL carry-forwards
(1)
Various $ 1.2 $ 1.5
(1) Before valuation allowance.
(2) Pretax.
The time remaining for utilization of the FTC component
has shortened, given the passage of time. Although realization
is not assured, Citi believes that the realization of the
recognized net DTAs of $24.8 billion at December 31, 2020 is
more-likely-than-not, based upon expectations as to future
taxable income in the jurisdictions in which the DTAs arise
and consideration of available tax planning strategies (as
defined in ASC 740, Income Taxes).
The majority of Citi’s U.S. federal net operating loss
carry-forward and all of its New York State and City net
operating loss carry-forwards, are subject to a carry-forward
period of 20 years. This provides enough time to fully utilize
the DTAs pertaining to these existing NOL carry-forwards.
This is due to Citi’s forecast of sufficient U.S. taxable income
and the fact that New York State and City continue to tax
Citi’s non-U.S. income.
With respect to the FTCs component of the DTAs, the
carry-forward period is 10 years. Utilization of FTCs in any
year is generally limited to 21% of foreign source taxable
income in that year. However, overall domestic losses that Citi
has incurred of approximately $26 billion as of December 31,
2020 are allowed to be reclassified as foreign source income to
the extent of 50%–100% (at taxpayer’s election) of domestic
source income produced in subsequent years. Such resulting
foreign source income would substantially cover the FTC
carry-forwards after valuation allowance. As noted in the
tables above, Citi’s FTC carry-forwards were $4.4 billion
($7.8 billion before valuation allowance) as of December 31,
2020, compared to $6.3 billion as of December 31, 2019. Citi
believes that it will generate sufficient U.S. taxable income
within the 10-year carry-forward period to be able to utilize
the net FTCs after the valuation allowance, after considering
any FTCs produced in the tax return for such period, which
must be used prior to any carry-forward utilization.
186

10. EARNINGS PER SHARE
The following table reconciles the income and share data used in the basic and diluted earnings per share (EPS) computations:
In millions of dollars, except per share amounts
2020 2019 2018
Earnings per common share
Income from continuing operations before attribution of noncontrolling interests $ 11,107 $ 19,471 $ 18,088
Less: Noncontrolling interests from continuing operations 40 66 35
Net income from continuing operations (for EPS purposes) $ 11,067 $ 19,405 $ 18,053
Loss from discontinued operations, net of taxes (20) (4) (8)
Citigroup’s net income $ 11,047 $ 19,401 $ 18,045
Less: Preferred dividends
(1)
1,095 1,109 1,174
Net income available to common shareholders $ 9,952 $ 18,292 $ 16,871
Less: Dividends and undistributed earnings allocated to employee restricted and deferred shares
with rights to dividends, applicable to basic EPS 73 121 200
Net income allocated to common shareholders for basic EPS $ 9,879 $ 18,171 $ 16,671
Weighted-average common shares outstanding applicable to basic EPS (in millions) 2,085.8 2,249.2 2,493.3
Basic earnings per share
(2)
Income from continuing operations $ 4.75 $ 8.08 $ 6.69
Discontinued operations (0.01) — —
Net income per share—basic $ 4.74 $ 8.08 $ 6.69
Net income allocated to common shareholders for basic EPS $ 9,879 $ 18,171 $ 16,671
Add back: Dividends allocated to employee restricted and deferred shares with rights to dividends
that are forfeitable 30 33 —
Net income allocated to common shareholders for diluted EPS $ 9,909 $ 18,204 $ 16,671
Weighted-average common shares outstanding applicable to basic EPS (in millions) $ 2,085.8 $ 2,249.2 $ 2,493.3
Effect of dilutive securities
Options
(3)
0.1 0.1 0.1
Other employee plans 13.1 16.0 1.4
Adjusted weighted-average common shares outstanding applicable to diluted EPS (in millions)
(4)
2,099.0 2,265.3 2,494.8
Diluted earnings per share
(2)
Income from continuing operations $ 4.73 $ 8.04 $ 6.69
Discontinued operations (0.01) — —
Net income per share—diluted $ 4.72 $ 8.04 $ 6.68
(1) See Note 20 to the Consolidated Financial Statements for the potential future impact of preferred stock dividends.
(2) Due to rounding, earnings per share on continuing operations and discontinued operations may not sum to earnings per share on net income.
(3) During 2020, weighted-average options to purchase 0.1 million shares of common stock were outstanding but not included in the computation of earnings per
share because the weighted-average exercise price of $56.25 per share was anti-dilutive. During 2019, no significant options to purchase shares of common stock
were outstanding. During 2018, weighted-average options to purchase 0.5 million shares of common stock were outstanding but not included in the computation
of earnings per share because the weighted-average exercise prices of $145.69 per share was anti-dilutive.
(4) Due to rounding, weighted-average common shares outstanding applicable to basic EPS and the effect of dilutive securities may not sum to weighted-average
common shares outstanding applicable to diluted EPS.
187
11. SECURITIES BORROWED, LOANED AND
SUBJECT TO REPURCHASE AGREEMENTS
Securities borrowed and purchased under agreements to
resell, at their respective carrying values, consisted of the
following:
December 31,
In millions of dollars
2020 2019
Securities purchased under
agreements to resell $ 204,655 $ 169,874
Deposits paid for securities
borrowed 90,067 81,448
Total, net
(1)
$ 294,722 $ 251,322
Allowance for credit losses on
securities purchased and
borrowed
(2)
(10) —
Total, net of allowance $ 294,712 $ 251,322
Securities loaned and sold under agreements to
repurchase, at their respective carrying values, consisted of
the following:
December 31,
In millions of dollars
2020 2019
Securities sold under agreements
to repurchase $ 181,194 $ 155,164
Deposits received for securities
loaned 18,331 11,175
Total, net
(1)
$ 199,525 $ 166,339
(1) The above tables do not include securities-for-securities lending
transactions of $6.8 billion and $6.3 billion at December 31, 2020 and
2019, respectively, where the Company acts as lender and receives
securities that can be sold or pledged as collateral. In these transactions,
the Company recognizes the securities received at fair value within
Other assets and the obligation to return those securities as a liability
within Brokerage payables.
(2) See Note 15 to the Consolidated Financial Statements for further
information.
The resale and repurchase agreements represent
collateralized financing transactions. Citi executes these
transactions primarily through its broker-dealer subsidiaries to
facilitate customer matched-book activity and to efficiently
fund a portion of Citi’s trading inventory. Transactions
executed by Citi’s bank subsidiaries primarily facilitate
customer financing activity.
To maintain reliable funding under a wide range of
market conditions, including under periods of stress, Citi
manages these activities by taking into consideration the
quality of the underlying collateral and stipulating financing
tenor. Citi manages the risks in its collateralized financing
transactions by conducting daily stress tests to account for
changes in capacity, tenors, haircut, collateral profile and
client actions. In addition, Citi maintains counterparty
diversification by establishing concentration triggers and
assessing counterparty reliability and stability under stress.
It is the Company’s policy to take possession of the
underlying collateral, monitor its market value relative to the
amounts due under the agreements and, when necessary,
require prompt transfer of additional collateral in order to
maintain contractual margin protection. For resale and
repurchase agreements, when necessary, the Company posts
additional collateral in order to maintain contractual margin
protection.
Collateral typically consists of government and
government-agency securities, corporate and municipal bonds,
equities and mortgage- and other asset-backed securities.
The resale and repurchase agreements are generally
documented under industry standard agreements that allow the
prompt close-out of all transactions (including the liquidation
of securities held) and the offsetting of obligations to return
cash or securities by the non-defaulting party, following a
payment default or other type of default under the relevant
master agreement. Events of default generally include
(i) failure to deliver cash or securities as required under the
transaction, (ii) failure to provide or return cash or securities
as used for margining purposes, (iii) breach of representation,
(iv) cross-default to another transaction entered into among the
parties, or, in some cases, their affiliates and (v) a repudiation
of obligations under the agreement. The counterparty that
receives the securities in these transactions is generally
unrestricted in its use of the securities, with the exception of
transactions executed on a tri-party basis, where the collateral
is maintained by a custodian and operational limitations may
restrict its use of the securities.
A substantial portion of the resale and repurchase
agreements is recorded at fair value, as described in Notes 24
and 25 to the Consolidated Financial Statements. The
remaining portion is carried at the amount of cash initially
advanced or received, plus accrued interest, as specified in the
respective agreements.
The securities borrowing and lending agreements also
represent collateralized financing transactions similar to the
resale and repurchase agreements. Collateral typically consists
of government and government-agency securities and
corporate debt and equity securities.
Similar to the resale and repurchase agreements, securities
borrowing and lending agreements are generally documented
under industry standard agreements that allow the prompt
close-out of all transactions (including the liquidation of
securities held) and the offsetting of obligations to return cash
or securities by the non-defaulting party, following a payment
default or other default by the other party under the relevant
master agreement. Events of default and rights to use
securities under the securities borrowing and lending
agreements are similar to the resale and repurchase agreements
referenced above.
A substantial portion of securities borrowing and lending
agreements is recorded at the amount of cash advanced or
received. The remaining portion is recorded at fair value as the
Company elected the fair value option for certain securities
borrowed and loaned portfolios, as described in Note 25 to the
Consolidated Financial Statements. With respect to securities
loaned, the Company receives cash collateral in an amount
generally in excess of the market value of the securities
loaned. The Company monitors the market value of securities
borrowed and securities loaned on a daily basis and obtains or
posts additional collateral in order to maintain contractual
margin protection.
188

The enforceability of offsetting rights incorporated in the
master netting agreements for resale and repurchase
agreements, and securities borrowing and lending agreements,
is evidenced to the extent that (i) a supportive legal opinion
has been obtained from counsel of recognized standing that
provides the requisite level of certainty regarding the
enforceability of these agreements and (ii) the exercise of
rights by the non-defaulting party to terminate and close out
transactions on a net basis under these agreements will not be
stayed or avoided under applicable law upon an event of
default including bankruptcy, insolvency or similar
proceeding.
A legal opinion may not have been sought or obtained for
certain jurisdictions where local law is silent or sufficiently
ambiguous to determine the enforceability of offsetting rights
or where adverse case law or conflicting regulation may cast
doubt on the enforceability of such rights. In some
jurisdictions and for some counterparty types, the insolvency
law for a particular counterparty type may be nonexistent or
unclear as overlapping regimes may exist. For example, this
may be the case for certain sovereigns, municipalities, central
banks and U.S. pension plans.
The following tables present the gross and net resale and
repurchase agreements and securities borrowing and lending
agreements and the related offsetting amounts permitted under
ASC 210-20-45. The tables also include amounts related to
financial instruments that are not permitted to be offset under
ASC 210-20-45, but would be eligible for offsetting to the
extent that an event of default has occurred and a legal opinion
supporting enforceability of the offsetting rights has been
obtained. Remaining exposures continue to be secured by
financial collateral, but the Company may not have sought or
been able to obtain a legal opinion evidencing enforceability
of the offsetting right.
As of December 31, 2020
In millions of dollars
Gross amounts
of recognized
assets
Gross amounts
offset on the
Consolidated
Balance Sheet
(1)
Net amounts of
assets included on
the Consolidated
Balance Sheet
Amounts
not offset on the
Consolidated Balance
Sheet but eligible for
offsetting upon
counterparty default
(2)
Net
amounts
(3)
Securities purchased under agreements to
resell $ 362,025 $ 157,370 $ 204,655 $ 159,232 $ 45,423
Deposits paid for securities borrowed 96,425 6,358 90,067 13,474 76,593
Total $ 458,450 $ 163,728 $ 294,722 $ 172,706 $ 122,016
In millions of dollars
Gross amounts
of recognized
liabilities
Gross amounts
offset on the
Consolidated
Balance Sheet
(1)
Net amounts of
liabilities included on
the Consolidated
Balance Sheet
Amounts
not offset on the
Consolidated Balance
Sheet but eligible for
offsetting upon
counterparty default
(2)
Net
amounts
(3)
Securities sold under agreements to
repurchase $ 338,564 $ 157,370 $ 181,194 $ 95,563 $ 85,631
Deposits received for securities loaned 24,689 6,358 18,331 7,982 10,349
Total $ 363,253 $ 163,728 $ 199,525 $ 103,545 $ 95,980
As of December 31, 2019
In millions of dollars
Gross amounts
of recognized
assets
Gross amounts
offset on the
Consolidated
Balance Sheet
(1)
Net amounts of
assets included on
the Consolidated
Balance Sheet
Amounts
not offset on the
Consolidated Balance
Sheet but eligible for
offsetting upon
counterparty default
(2)
Net
amounts
(3)
Securities purchased under agreements to
resell $ 281,274 $ 111,400 $ 169,874 $ 134,150 $ 35,724
Deposits paid for securities borrowed 90,047 8,599 81,448 27,067 54,381
Total $ 371,321 $ 119,999 $ 251,322 $ 161,217 $ 90,105
In millions of dollars
Gross amounts
of recognized
liabilities
Gross amounts
offset on the
Consolidated
Balance Sheet
(1)
Net amounts of
liabilities included on
the Consolidated
Balance Sheet
Amounts
not offset on the
Consolidated Balance
Sheet but eligible for
offsetting upon
counterparty default
(2)
Net
amounts
(3)
Securities sold under agreements to
repurchase $ 266,564 $ 111,400 $ 155,164 $ 91,034 $ 64,130
Deposits received for securities loaned 19,774 8,599 11,175 3,138 8,037
Total $ 286,338 $ 119,999 $ 166,339 $ 94,172 $ 72,167
189
(1) Includes financial instruments subject to enforceable master netting agreements that are permitted to be offset under ASC 210-20-45.
(2) Includes financial instruments subject to enforceable master netting agreements that are not permitted to be offset under ASC 210-20-45, but would be eligible for
offsetting to the extent that an event of default has occurred and a legal opinion supporting enforceability of the offsetting right has been obtained.
(3) Remaining exposures continue to be secured by financial collateral, but the Company may not have sought or been able to obtain a legal opinion evidencing
enforceability of the offsetting right.
The following tables present the gross amounts of liabilities associated with repurchase agreements and securities lending
agreements by remaining contractual maturity:
As of December 31, 2020
In millions of dollars
Open and
overnight Up to 30 days 31–90 days
Greater than
90 days Total
Securities sold under agreements to repurchase $ 160,754 $ 98,226 $ 41,679 $ 37,905 $ 338,564
Deposits received for securities loaned 17,038 3 2,770 4,878 24,689
Total $ 177,792 $ 98,229 $ 44,449 $ 42,783 $ 363,253
As of December 31, 2019
In millions of dollars
Open and
overnight Up to 30 days 31–90 days
Greater than
90 days Total
Securities sold under agreements to repurchase $ 108,534 $ 82,749 $ 35,108 $ 40,173 $ 266,564
Deposits received for securities loaned 15,758 208 1,789 2,019 19,774
Total $ 124,292 $ 82,957 $ 36,897 $ 42,192 $ 286,338
The following tables present the gross amounts of liabilities associated with repurchase agreements and securities lending
agreements by class of underlying collateral:
As of December 31, 2020
In millions of dollars
Repurchase
agreements
Securities lending
agreements Total
U.S. Treasury and federal agency securities $ 112,437 $ — $ 112,437
State and municipal securities 664 2 666
Foreign government securities 130,017 194 130,211
Corporate bonds 20,149 78 20,227
Equity securities 21,497 24,149 45,646
Mortgage-backed securities 45,566 — 45,566
Asset-backed securities 3,307 — 3,307
Other 4,927 266 5,193
Total $ 338,564 $ 24,689 $ 363,253
As of December 31, 2019
In millions of dollars
Repurchase
agreements
Securities lending
agreements Total
U.S. Treasury and federal agency securities $ 100,781 $ 27 $ 100,808
State and municipal securities 1,938 5 1,943
Foreign government securities 95,880 272 96,152
Corporate bonds 18,761 249 19,010
Equity securities 12,010 19,069 31,079
Mortgage-backed securities 28,458 — 28,458
Asset-backed securities 4,873 — 4,873
Other 3,863 152 4,015
Total $ 266,564 $ 19,774 $ 286,338
190

12. BROKERAGE RECEIVABLES AND BROKERAGE
PAYABLES
The Company has receivables and payables for financial
instruments sold to and purchased from brokers, dealers and
customers, which arise in the ordinary course of business. Citi
is exposed to risk of loss from the inability of brokers, dealers
or customers to pay for purchases or to deliver the financial
instruments sold, in which case Citi would have to sell or
purchase the financial instruments at prevailing market prices.
Credit risk is reduced to the extent that an exchange or
clearing organization acts as a counterparty to the transaction
and replaces the broker, dealer or customer in question.
Citi seeks to protect itself from the risks associated with
customer activities by requiring customers to maintain margin
collateral in compliance with regulatory and internal
guidelines. Margin levels are monitored daily, and customers
deposit additional collateral as required. Where customers
cannot meet collateral requirements, Citi may liquidate
sufficient underlying financial instruments to bring the
customer into compliance with the required margin level.
Exposure to credit risk is impacted by market volatility,
which may impair the ability of clients to satisfy their
obligations to Citi. Credit limits are established and closely
monitored for customers and for brokers and dealers engaged
in forwards, futures and other transactions deemed to be credit
sensitive.
Brokerage receivables and Brokerage payables consisted
of the following:
December 31,
In millions of dollars
2020 2019
Receivables from customers
$ 18,097 $ 15,912
Receivables from brokers,
dealers and clearing
organizations
26,709 23,945
Total brokerage receivables
(1)
$ 44,806 $ 39,857
Payables to customers
$ 39,319 $ 37,613
Payables to brokers, dealers and
clearing organizations
11,165 10,988
Total brokerage payables
(1)
$ 50,484 $ 48,601
(1) Includes brokerage receivables and payables recorded by Citi broker-
dealer entities that are accounted for in accordance with the AICPA
Accounting Guide for Brokers and Dealers in Securities as codified in
ASC 940-320.
191

13. INVESTMENTS
The following table presents Citi’s investments by category:
December 31,
In millions of dollars
2020 2019
Debt securities available-for-sale (AFS) $ 335,084 $ 280,265
Debt securities held-to-maturity (HTM)
(1)
104,943 80,775
Marketable equity securities carried at fair value
(2)
515 458
Non-marketable equity securities carried at fair value
(2)
551 704
Non-marketable equity securities measured using the measurement alternative
(3)
962 700
Non-marketable equity securities carried at cost
(4)
5,304 5,661
Total investments $ 447,359 $ 368,563
(1) Carried at adjusted amortized cost basis, net of any ACL.
(2) Unrealized gains and losses are recognized in earnings.
(3) Impairment losses and adjustments to the carrying value as a result of observable price changes are recognized in earnings. See “Non-Marketable Equity
Securities Not Carried at Fair Value” below.
(4) Represents shares issued by the Federal Reserve Bank, Federal Home Loan Banks and certain exchanges of which Citigroup is a member.
The following table presents interest and dividend income on investments:
In millions of dollars
2020 2019 2018
Taxable interest $ 7,554 $ 9,269 $ 8,704
Interest exempt from U.S. federal income tax 301 404 521
Dividend income 134 187 269
Total interest and dividend income on investments $ 7,989 $ 9,860 $ 9,494
The following table presents realized gains and losses on the sales of investments, which exclude impairment losses:
In millions of dollars
2020 2019 2018
Gross realized investment gains $ 1,895 $ 1,599 $ 682
Gross realized investment losses (139) (125) (261)
Net realized gains on sales of investments $ 1,756 $ 1,474 $ 421
192
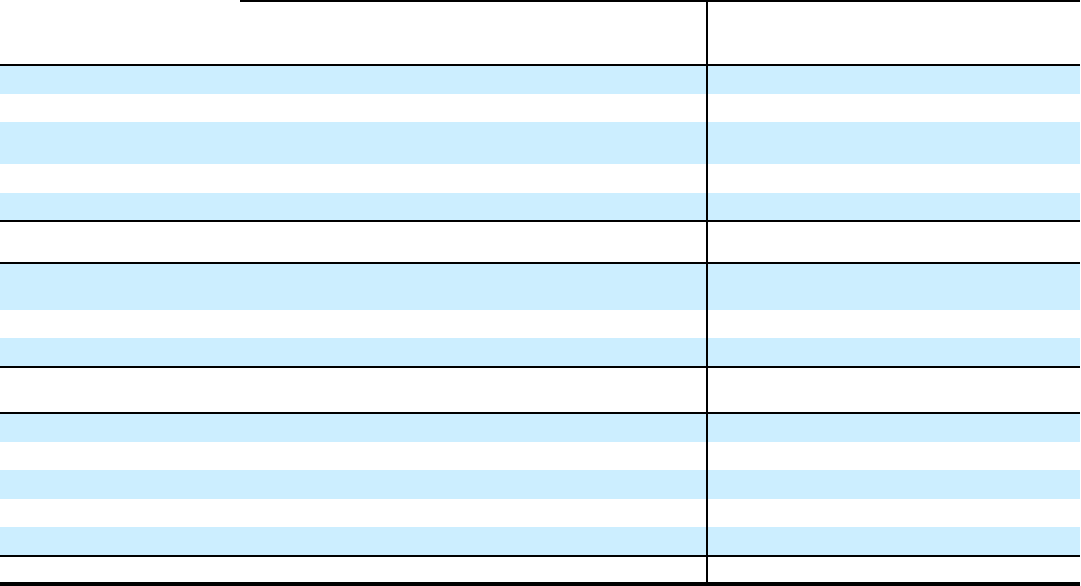
The Company from time to time may sell certain debt
securities that were classified as HTM. These sales are in
response to significant deterioration in the creditworthiness of
the issuers or securities or because the Company has collected
a substantial portion (at least 85%) of the principal outstanding
at acquisition of the security. In addition, certain other debt
securities were reclassified to AFS investments in response to
significant credit deterioration. Because the Company
generally intends to sell these reclassified debt securities, Citi
recorded impairment on the securities. In 2018, $61 million of
HTM debt securities were sold and $8 million of HTM debt
securities were reclassified to AFS in accordance with
generally accepting accounting standards. There were no such
activities during 2019 and 2020.
Debt Securities Available-for-Sale
The amortized cost and fair value of AFS debt securities were as follows:
December 31, 2020 December 31, 2019
In millions of dollars
Amortized
cost
Gross
unrealized
gains
Gross
unrealized
losses
Allowance
for credit
losses
Fair
value
Amortized
cost
Gross
unrealized
gains
Gross
unrealized
losses
Fair
value
Debt securities AFS
Mortgage-backed securities
(1)
U.S. government-sponsored
agency guaranteed $ 42,836 $ 1,134 $ 52 $ — $ 43,918 $ 34,963 $ 547 $ 280 $ 35,230
Non-U.S. residential 568 3 — — 571 789 3 — 792
Commercial 49 1 — — 50 75 — — 75
Total mortgage-backed
securities $ 43,453 $ 1,138 $ 52 $ — $ 44,539 $ 35,827 $ 550 $ 280 $ 36,097
U.S. Treasury and federal
agency securities
U.S. Treasury $ 144,094 $ 2,108 $ 49 $ — $ 146,153 $ 106,429 $ 50 $ 380 $ 106,099
Agency obligations 50 1 — — 51 5,336 3 20 5,319
Total U.S. Treasury and federal
agency securities $ 144,144 $ 2,109 $ 49 $ — $ 146,204 $ 111,765 $ 53 $ 400 $ 111,418
State and municipal $ 3,753 $ 13 $ 47 $ — $ 3,719 $ 5,024 $ 43 $ 89 $ 4,978
Foreign government 123,467 1,623 122 — 124,968 110,958 586 241 111,303
Corporate 10,444 152 91 5 10,500 11,266 52 101 11,217
Asset-backed securities
(1)
277 5 4 — 278 524 — 2 522
Other debt securities 4,871 5 — — 4,876 4,729 1 — 4,730
Total debt securities AFS $ 330,409 $ 5,045 $ 365 $ 5 $ 335,084 $ 280,093 $ 1,285 $ 1,113 $ 280,265
(1) The Company invests in mortgage- and asset-backed securities, which are typically issued by VIEs through securitization transactions. The Company’s maximum
exposure to loss from these VIEs is equal to the carrying amount of the securities, which is reflected in the table above. For mortgage- and asset-backed
securitizations in which the Company has other involvement, see Note 21 to the Consolidated Financial Statements.
At December 31, 2020, the amortized cost of fixed
income securities exceeded their fair value by $365 million.
Of the $365 million, $280 million represented unrealized
losses on fixed income investments that have been in a gross-
unrealized-loss position for less than a year and, of these, 70%
were rated investment grade; and $85 million represented
unrealized losses on fixed income investments that have been
in a gross-unrealized-loss position for a year or more and, of
these, 78% were rated investment grade. Of the $85 million,
$61 million represents foreign government securities.
193
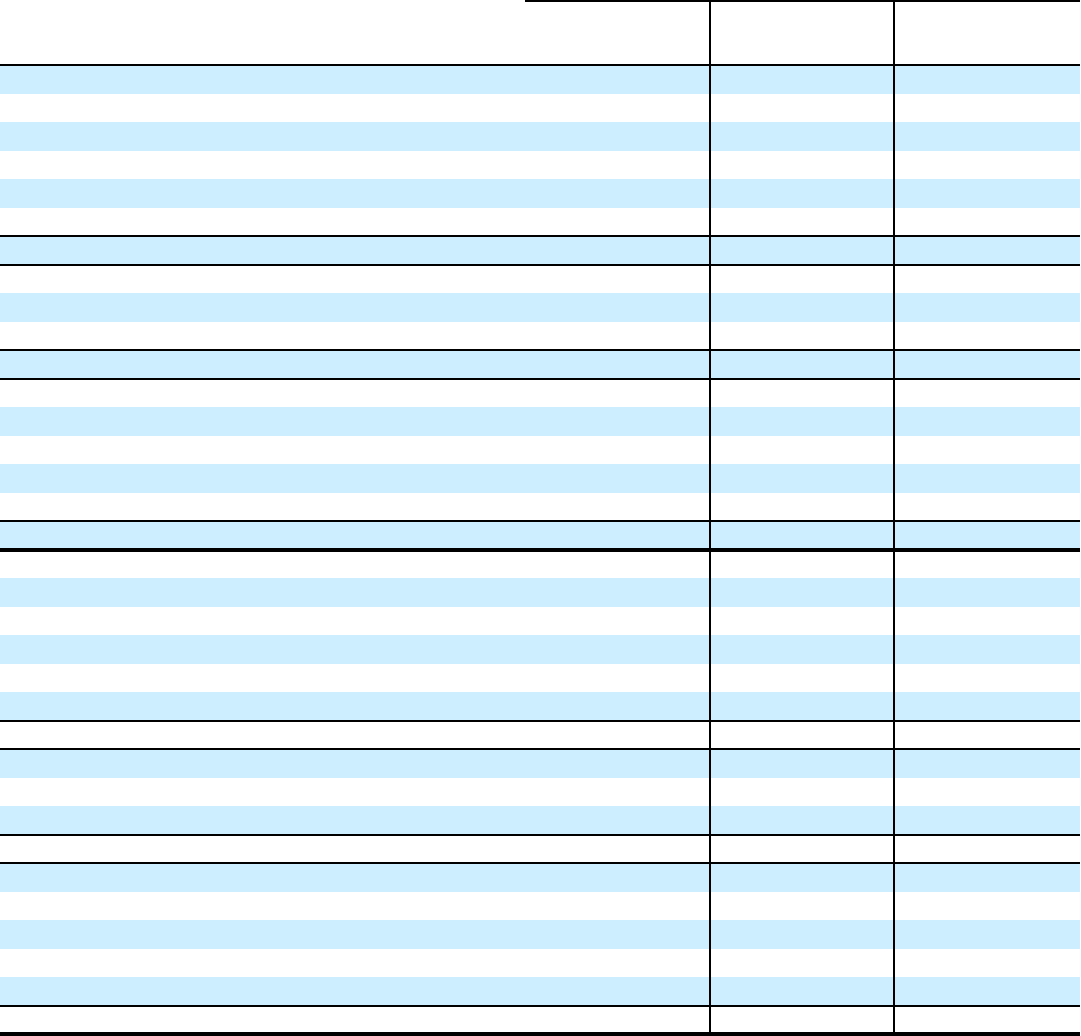
The following table shows the fair value of AFS debt securities that have been in an unrealized loss position:
Less than 12 months 12 months or longer Total
In millions of dollars
Fair
value
Gross
unrealized
losses
Fair
value
Gross
unrealized
losses
Fair
value
Gross
unrealized
losses
December 31, 2020
Debt securities AFS
Mortgage-backed securities
U.S. government-sponsored agency guaranteed $ 3,588 $ 30 $ 298 $ 22 $ 3,886 $ 52
Non-U.S. residential 1 — — — 1 —
Commercial 7 — 4 — 11 —
Total mortgage-backed securities $ 3,596 $ 30 $ 302 $ 22 $ 3,898 $ 52
U.S. Treasury and federal agency securities
U.S. Treasury $ 25,031 $ 49 $ — $ — $ 25,031 $ 49
Agency obligations 50 — — — 50 —
Total U.S. Treasury and federal agency securities $ 25,081 $ 49 $ — $ — $ 25,081 $ 49
State and municipal $ 3,214 $ 47 $ 24 $ — $ 3,238 $ 47
Foreign government 29,344 61 3,502 61 32,846 122
Corporate 1,083 90 24 1 1,107 91
Asset-backed securities 194 3 39 1 233 4
Other debt securities 182 — — — 182 —
Total debt securities AFS $ 62,694 $ 280 $ 3,891 $ 85 $ 66,585 $ 365
December 31, 2019
Debt securities AFS
Mortgage-backed securities
U.S. government-sponsored agency guaranteed $ 9,780 $ 242 $ 1,877 $ 38 $ 11,657 $ 280
Non-U.S. residential 208 — 1 — 209 —
Commercial 16 — 27 — 43 —
Total mortgage-backed securities $ 10,004 $ 242 $ 1,905 $ 38 $ 11,909 $ 280
U.S. Treasury and federal agency securities
U.S. Treasury $ 45,484 $ 248 $ 26,907 $ 132 $ 72,391 $ 380
Agency obligations 781 2 3,897 18 4,678 20
Total U.S. Treasury and federal agency securities $ 46,265 $ 250 $ 30,804 $ 150 $ 77,069 $ 400
State and municipal $ 362 $ 62 $ 266 $ 27 $ 628 $ 89
Foreign government 35,485 149 8,170 92 43,655 241
Corporate 2,916 98 123 3 3,039 101
Asset-backed securities 112 1 166 1 278 2
Other debt securities 1,307 — — — 1,307 —
Total debt securities AFS $ 96,451 $ 802 $ 41,434 $ 311 $ 137,885 $ 1,113
194
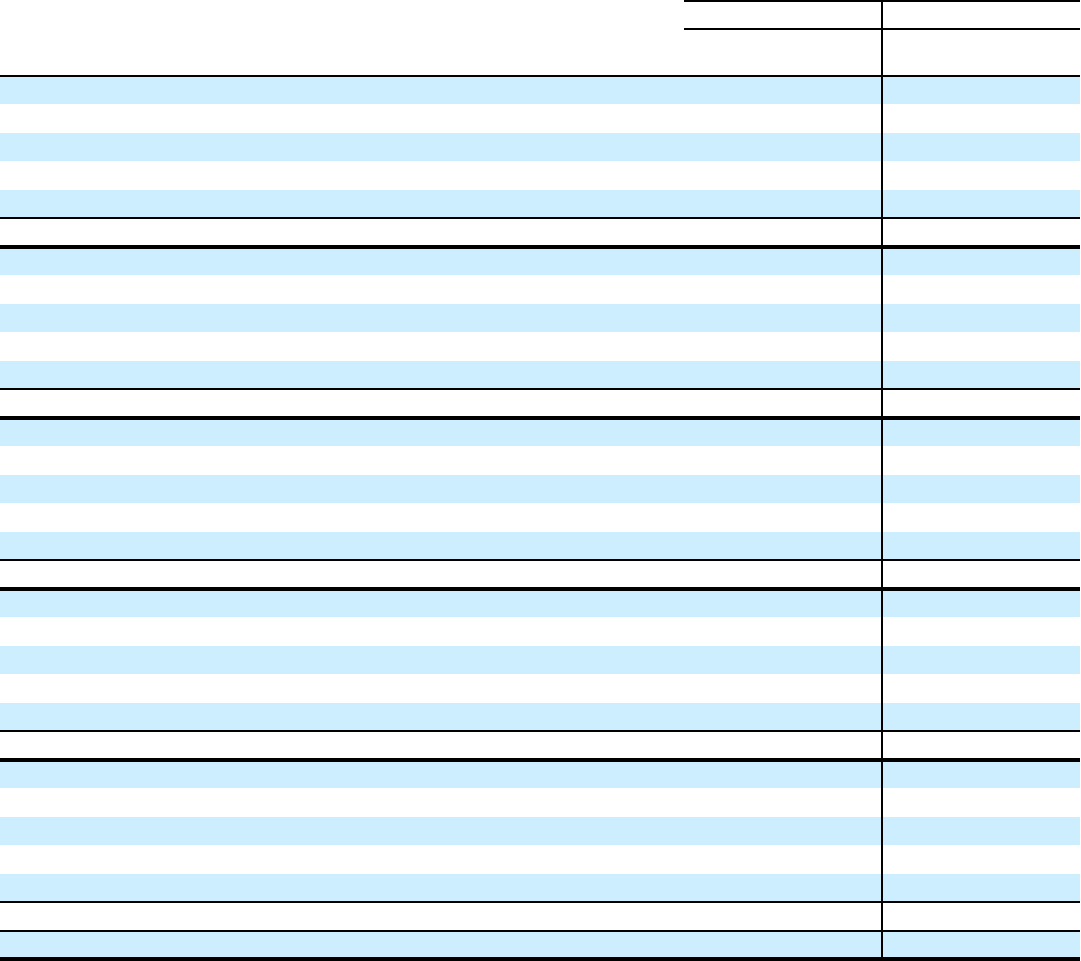
The following table presents the amortized cost and fair value of AFS debt securities by contractual maturity dates:
December 31,
2020 2019
In millions of dollars
Amortized
cost
Fair
value
Amortized
cost
Fair
value
Mortgage-backed securities
(1)
Due within 1 year $ 27 $ 27 $ 20 $ 20
After 1 but within 5 years 567 571 573 574
After 5 but within 10 years 688 757 594 626
After 10 years
(2)
42,171 43,184 34,640 34,877
Total $ 43,453 $ 44,539 $ 35,827 $ 36,097
U.S. Treasury and federal agency securities
Due within 1 year $ 34,834 $ 34,951 $ 40,757 $ 40,688
After 1 but within 5 years 108,160 110,091 70,128 69,850
After 5 but within 10 years 1,150 1,162 854 851
After 10 years
(2)
— — 26 29
Total $ 144,144 $ 146,204 $ 111,765 $ 111,418
State and municipal
Due within 1 year $ 427 $ 428 $ 932 $ 932
After 1 but within 5 years 189 198 714 723
After 5 but within 10 years 276 267 195 215
After 10 years
(2)
2,861 2,826 3,183 3,108
Total $ 3,753 $ 3,719 $ 5,024 $ 4,978
Foreign government
Due within 1 year $ 48,133 $ 48,258 $ 42,611 $ 42,666
After 1 but within 5 years 67,365 68,586 58,820 59,071
After 5 but within 10 years 5,908 6,011 8,192 8,198
After 10 years
(2)
2,061 2,113 1,335 1,368
Total $ 123,467 $ 124,968 $ 110,958 $ 111,303
All other
(3)
Due within 1 year $ 6,661 $ 6,665 $ 7,306 $ 7,311
After 1 but within 5 years 7,814 7,891 8,279 8,275
After 5 but within 10 years 1,018 1,034 818 797
After 10 years
(2)
99 64 116 86
Total $ 15,592 $ 15,654 $ 16,519 $ 16,469
Total debt securities AFS $ 330,409 $ 335,084 $ 280,093 $ 280,265
(1) Includes mortgage-backed securities of U.S. government-sponsored agencies. The Company invests in mortgage- and asset-backed securities, which are typically
issued by VIEs through securitization transactions.
(2) Investments with no stated maturities are included as contractual maturities of greater than 10 years. Actual maturities may differ due to call or prepayment rights.
(3) Includes corporate, asset-backed and other debt securities.
195

Debt Securities Held-to-Maturity
The carrying value and fair value of debt securities HTM were as follows:
In millions of dollars
Amortized cost,
net
(1)
Gross
unrealized
gains
Gross
unrealized
losses
Fair
value
December 31, 2020
Debt securities HTM
Mortgage-backed securities
(2)
U.S. government-sponsored agency guaranteed $ 49,004 $ 2,162 $ 15 $ 51,151
Non-U.S. residential 1,124 3 1 1,126
Commercial 825 1 1 825
Total mortgage-backed securities $ 50,953 $ 2,166 $ 17 $ 53,102
U.S. Treasury securities
(3)
$ 21,293 $ 4 $ 55 $ 21,242
State and municipal 9,185 755 11 9,929
Foreign government 1,931 91 — 2,022
Asset-backed securities
(2)
21,581 6 92 21,495
Total debt securities HTM, net $ 104,943 $ 3,022 $ 175 $ 107,790
December 31, 2019
Debt securities HTM
Mortgage-backed securities
(2)(4)
U.S. government-sponsored agency guaranteed $ 46,637 $ 1,047 $ 21 $ 47,663
Non-U.S. residential 1,039 5 — 1,044
Commercial 582 1 — 583
Total mortgage-backed securities $ 48,258 $ 1,053 $ 21 $ 49,290
State and municipal
(5)
$ 9,104 $ 455 $ 28 $ 9,531
Foreign government 1,934 37 1 1,970
Asset-backed securities
(2)
21,479 12 59 21,432
Total debt securities HTM $ 80,775 $ 1,557 $ 109 $ 82,223
(1) Amortized cost is reported net of ACL of $86 million at December 31, 2020. There was no allowance as of December 31, 2019 due to CECL not being adopted
until January 1, 2020.
(2) The Company invests in mortgage- and asset-backed securities. These securitizations are generally considered VIEs. The Company’s maximum exposure to loss
from these VIEs is equal to the carrying amount of the securities, which is reflected in the table above. For mortgage- and asset-backed securitizations in which the
Company has other involvement, see Note 21 to the Consolidated Financial Statements.
(3) In August 2020, Citibank transferred $13.1 billion of investments in U.S. Treasury securities from AFS classification to HTM classification in accordance with
ASC 320. At the time of transfer, the securities were in an unrealized gain position of $144 million. The gain amounts will remain in AOCI and will be amortized
over the remaining life of the securities.
(4) In March 2019, Citibank transferred $5 billion of agency residential mortgage-backed securities (RMBS) from AFS classification to HTM classification in
accordance with ASC 320. At the time of transfer, the securities were in an unrealized loss position of $56 million. The loss amounts will remain in AOCI and be
amortized over the remaining life of the securities.
(5) In December 2019, Citibank transferred $173 million of state and municipal bonds from AFS classification to HTM classification in accordance with ASC 320. At
the time of transfer, the bonds were in an unrealized gain position of $5 million. The gain amounts will remain in AOCI and be amortized over the remaining life
of the securities.
196
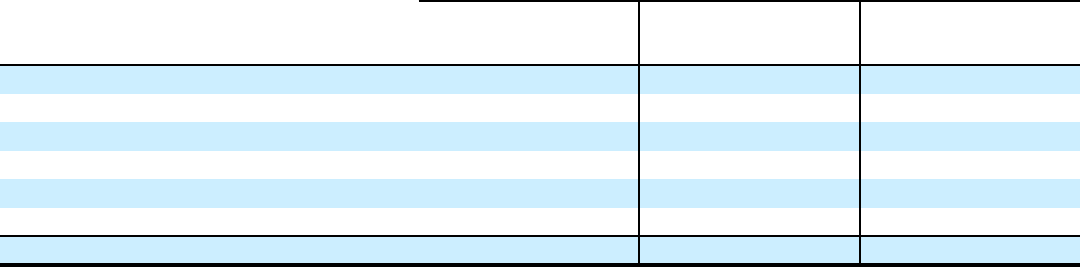
The Company has the positive intent and ability to hold
these securities to maturity or, where applicable, to exercise
any issuer call options, absent any unforeseen significant
changes in circumstances, including deterioration in credit or
changes in regulatory capital requirements.
The net unrealized losses classified in AOCI for HTM
securities primarily relate to debt securities previously
classified as AFS that were transferred to HTM, and include
any cumulative fair value hedge adjustments. The net
unrealized loss amount also includes any non-credit-related
changes in fair value of HTM debt securities that have
suffered credit impairment recorded in earnings. The AOCI
balance related to HTM debt securities is amortized as an
adjustment of yield, in a manner consistent with the accretion
of any difference between the carrying value at the transfer
date and par value of the same debt securities.
The table below shows the fair value of debt securities HTM that have been in an unrecognized loss position at December 31, 2019:
Less than 12 months 12 months or longer Total
In millions of dollars
Fair
value
Gross
unrecognized
losses
Fair
value
Gross
unrecognized
losses
Fair
value
Gross
unrecognized
losses
December 31, 2019
Debt securities HTM
Mortgage-backed securities $ 3,590 $ 10 $ 1,116 $ 11 $ 4,706 $ 21
State and municipal 34 1 1,125 27 1,159 28
Foreign government 1,970 1 — — 1,970 1
Asset-backed securities 7,972 11 765 48 8,737 59
Total debt securities HTM $ 13,566 $ 23 $ 3,006 $ 86 $ 16,572 $ 109
Note: Excluded from the gross unrecognized losses presented in the table above are $(582) million of net unrealized losses recorded in AOCI as of December 31, 2019,
primarily related to the difference between the amortized cost and carrying value of HTM debt securities that were reclassified from AFS. Substantially all of these net
unrecognized losses relate to securities that have been in a loss position for 12 months or longer at December 31, 2019.
197

The following table presents the carrying value and fair value of HTM debt securities by contractual maturity dates:
December 31,
2020 2019
In millions of dollars
Amortized
cost
(1)
Fair value
Amortized
cost Fair value
Mortgage-backed securities
Due within 1 year $ 81 $ 81 $ 17 $ 17
After 1 but within 5 years 463 477 458 463
After 5 but within 10 years 1,699 1,873 1,662 1,729
After 10 years
(2)
48,710 50,671 46,121 47,081
Total $ 50,953 $ 53,102 $ 48,258 $ 49,290
U.S. Treasury securities
Due within 1 year $ — $ — $ — $ —
After 1 but within 5 years 18,955 19,127 — —
After 5 but within 10 years 2,338 2,115 — —
After 10 years
(2)
— — — —
Total $ 21,293 $ 21,242 $ — $ —
State and municipal
Due within 1 year $ 6 $ 6 $ 2 $ 26
After 1 but within 5 years 139 142 123 160
After 5 but within 10 years 818 869 597 590
After 10 years
(2)
8,222 8,912 8,382 8,755
Total $ 9,185 $ 9,929 $ 9,104 $ 9,531
Foreign government
Due within 1 year $ 361 $ 360 $ 650 $ 652
After 1 but within 5 years 1,570 1,662 1,284 1,318
After 5 but within 10 years — — — —
After 10 years
(2)
— — — —
Total $ 1,931 $ 2,022 $ 1,934 $ 1,970
All other
(3)
Due within 1 year $ — $ — $ — $ —
After 1 but within 5 years — — — —
After 5 but within 10 years 11,795 15,020 8,545 8,543
After 10 years
(2)
9,786 6,475 12,934 12,889
Total $ 21,581 $ 21,495 $ 21,479 $ 21,432
Total debt securities HTM $ 104,943 $ 107,790 $ 80,775 $ 82,223
(1) Amortized cost is reported net of ACL of $86 million at December 31, 2020. There was no allowance as of December 31, 2019 due to CECL not being adopted
until January 1, 2020.
(2) Investments with no stated maturities are included as contractual maturities of greater than 10 years. Actual maturities may differ due to call or prepayment rights.
(3) Includes corporate and asset-backed securities.
HTM Debt Securities Delinquency and Non-Accrual
Details
Citi did not have any HTM securities that were delinquent or
on non-accrual status at December 31, 2020.
There were no purchased credit-deteriorated HTM debt
securities held by the Company as of December 31, 2020.
198
Evaluating Investments for Impairment
AFS Debt Securities
Overview—AFS Debt Securities
The Company conducts periodic reviews of all AFS debt
securities with unrealized losses to evaluate whether the
impairment resulted from expected credit losses or from other
factors and to evaluate the Company’s intent to sell such
securities.
An AFS debt security is impaired when the current fair
value of an individual AFS debt security is less than its
amortized cost basis.
The Company recognizes the entire difference between
amortized cost basis and fair value in earnings for impaired
AFS debt securities that Citi has an intent to sell or for which
Citi believes it will more-likely-than-not be required to sell
prior to recovery of the amortized cost basis. However, for
those AFS debt securities that the Company does not intend to
sell and is not likely to be required to sell, only the credit-
related impairment is recognized in earnings by recording an
ACL. Any remaining fair value decline for such securities is
recorded in AOCI. The Company does not consider the length
of time that the fair value of a security is below its amortized
cost when determining if a credit loss exists.
For AFS debt securities, credit losses exist where Citi
does not expect to receive contractual principal and interest
cash flows sufficient to recover the entire amortized cost basis
of a security. The ACL is limited to the amount by which the
AFS debt security’s amortized cost basis exceeds its fair value.
The allowance is increased or decreased if credit conditions
subsequently worsen or improve. Reversals of credit losses are
recognized in earnings.
The Company’s review for impairment of AFS debt
securities generally entails:
• identification and evaluation of impaired investments;
• consideration of evidential matter, including an evaluation
of factors or triggers that could cause individual positions
to qualify as credit impaired and those that would not
support credit impairment; and
• documentation of the results of these analyses, as required
under business policies.
The sections below describe the Company’s process for
identifying expected credit impairments for debt security types
that have the most significant unrealized losses as of
December 31, 2020.
Mortgage-Backed Securities
Citi records no allowances for credit losses on U.S.
government-agency-guaranteed mortgage-backed securities,
because the Company expects to incur no credit losses in the
event of default due to a history of incurring no credit losses
and due to the nature of the counterparties.
State and Municipal Securities
The process for estimating credit losses in Citigroup’s AFS
state and municipal bonds is primarily based on a credit
analysis that incorporates third-party credit ratings. Citi
monitors the bond issuers and any insurers providing default
protection in the form of financial guarantee insurance. The
average external credit rating, ignoring any insurance, is Aa2/
AA. In the event of an external rating downgrade or other
indicator of credit impairment (i.e., based on instrument-
specific estimates of cash flows or probability of issuer
default), the subject bond is specifically reviewed for adverse
changes in the amount or timing of expected contractual
principal and interest payments.
For AFS state and municipal bonds with unrealized losses
that Citi plans to sell, or would more-likely-than-not be
required to sell, the full impairment is recognized in earnings.
For AFS state and municipal bonds where Citi has no intent to
sell and it is more-likely-than-not that the Company will not
be required to sell, Citi records an allowance for expected
credit losses for the amount it expects not to collect, capped at
the difference between the bond’s amortized cost basis and
fair value.
Equity Method Investments
Management assesses equity method investments that have
fair values that are lower than their respective carrying values
for other-than-temporary impairment (OTTI). Fair value is
measured as price multiplied by quantity if the investee has
publicly listed securities. If the investee is not publicly listed,
other methods are used (see Note 24 to the Consolidated
Financial Statements).
For impaired equity method investments that Citi plans to
sell prior to recovery of value or would more-likely-than-not
be required to sell, with no expectation that the fair value will
recover prior to the expected sale date, the full impairment is
recognized in earnings as OTTI regardless of severity and
duration. The measurement of the OTTI does not include
partial projected recoveries subsequent to the balance sheet
date.
For impaired equity method investments that management
does not plan to sell and is not more-likely-than-not to be
required to sell prior to recovery of value, the evaluation of
whether an impairment is other-than-temporary is based on
(i) whether and when an equity method investment will
recover in value and (ii) whether the investor has the intent
and ability to hold that investment for a period of time
sufficient to recover the value. The determination of whether
the impairment is considered other-than-temporary considers
the following indicators:
• the cause of the impairment and the financial condition
and near-term prospects of the issuer, including any
specific events that may influence the operations of the
issuer;
• the intent and ability to hold the investment for a period of
time sufficient to allow for any anticipated recovery in
market value; and
• the length of time and extent to which fair value has been
less than the carrying value.
199
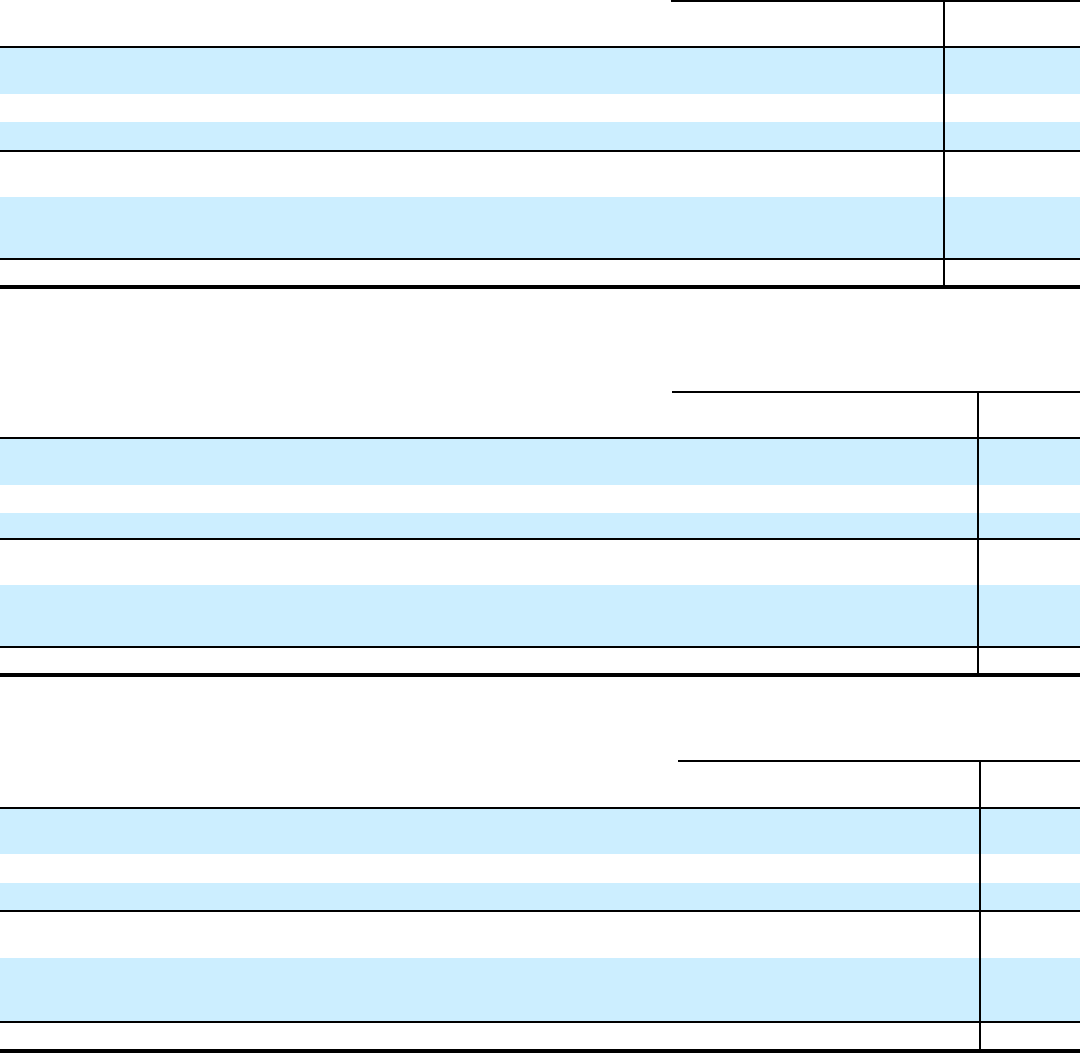
Recognition and Measurement of Impairment
The following tables present total impairment on Investments recognized in earnings:
Year ended
December 31, 2020
In millions of dollars
AFS
Other
assets Total
Impairment losses related to debt securities that the Company does not intend to sell nor
will likely be required to sell:
Total impairment losses recognized during the period $ — $ — $ —
Less: portion of impairment loss recognized in AOCI (before taxes) — — —
Net impairment losses recognized in earnings for debt securities that the Company does not
intend to sell nor will likely be required to sell $ — $ — $ —
Impairment losses recognized in earnings for debt securities that the Company intends to
sell, would more-likely-than-not be required to sell or will be subject to an issuer call
deemed probable of exercise 109 — 109
Total impairment losses recognized in earnings $ 109 $ — $ 109
Year ended
December 31, 2019
In millions of dollars
AFS HTM
Other
assets Total
Impairment losses related to debt securities that the Company does not intend to sell nor
will likely be required to sell:
Total impairment losses recognized during the period $ 1 $ — $ 1 $ 2
Less: portion of impairment loss recognized in AOCI (before taxes) — — — —
Net impairment losses recognized in earnings for debt securities that the Company does not
intend to sell nor will likely be required to sell $ 1 $ — $ 1 $ 2
Impairment losses recognized in earnings for debt securities that the Company intends to
sell, would more-likely-than-not be required to sell or will be subject to an issuer call
deemed probable of exercise 20 — 1 21
Total impairment losses recognized in earnings $ 21 $ — $ 2 $ 23
Year ended
December 31, 2018
In millions of dollars
AFS
(1)
HTM
Other
assets Total
Impairment losses related to securities that the Company does not intend to sell nor will
likely be required to sell:
Total impairment losses recognized during the period $ — $ — $ — $ —
Less: portion of impairment loss recognized in AOCI (before taxes) — — — —
Net impairment losses recognized in earnings for securities that the Company does not
intend to sell nor will likely be required to sell $ — $ — $ — $ —
Impairment losses recognized in earnings for securities that the Company intends to sell,
would more-likely-than-not be required to sell or will be subject to an issuer call deemed
probable of exercise 125 — — 125
Total impairment losses recognized in earnings $ 125 $ — $ — $ 125
(1) For the year ended December 31, 2018, amounts represent AFS debt securities.
200

The following presents the credit-related impairments recognized in earnings for AFS securities held that the Company does not intend
to sell nor will likely be required to sell at December 31, 2020:
Allowance for Credit Losses on AFS Debt Securities
Year ended December 31, 2020
In millions of dollars
Foreign
government Corporate Total AFS
Allowance for credit losses at beginning of year $ — $ — $ —
Less: Write-offs — — —
Recoveries of amounts written-off — 2 2
Net credit losses (NCLs) $ — $ 2 $ 2
NCLs $ — $ (2) $ (2)
Net reserve builds on securities that did not have previous reserves 3 5 8
Net reserve builds (releases) on securities that had previous reserves (3) — (3)
Total provision for credit losses $ — $ 3 $ 3
Initial allowance on newly purchased credit-deteriorated securities during the year — — —
Allowance for credit losses at end of year $ — $ 5 $ 5
The following are 12-month rollforwards of the credit-related impairments recognized in earnings for AFS and HTM debt securities
held that the Company does not intend to sell nor will likely be required to sell at December 31, 2019:
Cumulative OTTI credit losses recognized in earnings on debt securities still held
In millions of dollars
Dec. 31, 2018
balance
Credit
impairments
recognized in
earnings on
securities not
previously
impaired
Credit
impairments
recognized in
earnings on
securities
that have
been previously
impaired
Changes due to
credit-impaired
securities sold,
transferred or
matured
(1)
Dec. 31, 2019
balance
AFS debt securities
Mortgage-backed securities
(1)
$ 1 $ — $ — $ — $ 1
State and municipal — — 4 — 4
Corporate 4 — — — 4
All other debt securities — 1 — — 1
Total OTTI credit losses recognized for AFS debt
securities $ 5 $ 1 $ 4 $ — $ 10
HTM debt securities
State and municipal 3 — — — 3
Total OTTI credit losses recognized for HTM debt
securities $ 3 $ — $ — $ — $ 3
(1) Primarily consists of Prime securities.
201
Non-Marketable Equity Securities Not Carried at
Fair Value
Non-marketable equity securities are required to be measured
at fair value with changes in fair value recognized in earnings
unless (i) the measurement alternative is elected or (ii) the
investment represents Federal Reserve Bank and Federal
Home Loan Bank stock or certain exchange seats that continue
to be carried at cost.
The election to measure a non-marketable equity security
using the measurement alternative is made on an instrument-
by-instrument basis. Under the measurement alternative, an
equity security is carried at cost plus or minus changes
resulting from observable prices in orderly transactions for the
identical or a similar investment of the same issuer. The
carrying value of the equity security is adjusted to fair value
on the date of an observed transaction. Fair value may differ
from the observed transaction price due to a number of factors,
including marketability adjustments and differences in rights
and obligations when the observed transaction is not for the
identical investment held by Citi.
Equity securities under the measurement alternative are
also assessed for impairment. On a quarterly basis,
management qualitatively assesses whether each equity
security under the measurement alternative is impaired.
Impairment indicators that are considered include, but are not
limited to, the following:
• a significant deterioration in the earnings performance,
credit rating, asset quality or business prospects of the
investee;
• a significant adverse change in the regulatory, economic
or technological environment of the investee;
• a significant adverse change in the general market
condition of either the geographical area or the industry in
which the investee operates;
• a bona fide offer to purchase, an offer by the investee to
sell or a completed auction process for the same or similar
investment for an amount less than the carrying amount of
that investment; and
• factors that raise significant concerns about the investee’s
ability to continue as a going concern, such as negative
cash flows from operations, working capital deficiencies
or noncompliance with statutory capital requirements or
debt covenants.
When the qualitative assessment indicates that
impairment exists, the investment is written down to fair
value, with the full difference between the fair value of the
investment and its carrying amount recognized in earnings.
Below is the carrying value of non-marketable equity
securities measured using the measurement alternative at
December 31, 2020 and 2019:
In millions of dollars
December 31,
2020
December 31,
2019
Measurement alternative:
Carrying value $ 962 $ 700
Below are amounts recognized in earnings and life-to-date
amounts for non-marketable equity securities measured using
the measurement alternative:
Years ended December 31,
In millions of dollars
2020 2019
Measurement alternative
(1)
:
Impairment losses $ 56 $ 9
Downward changes for
observable prices 19 16
Upward changes for observable
prices 144 123
(1) See Note 24 to the Consolidated Financial Statements for additional
information on these nonrecurring fair value measurements.
Life-to-date amounts
on securities still held
In millions of dollars
December 31, 2020
Measurement alternative:
Impairment losses $ 68
Downward changes for observable prices 53
Upward changes for observable prices 486
A similar impairment analysis is performed for non-
marketable equity securities carried at cost. For the years
ended December 31, 2020 and 2019, there was no impairment
loss recognized in earnings for non-marketable equity
securities carried at cost.
202

Investments in Alternative Investment Funds That
Calculate Net Asset Value
The Company holds investments in certain alternative
investment funds that calculate net asset value (NAV), or its
equivalent, including private equity funds, funds of funds and
real estate funds, as provided by third-party asset managers.
Investments in such funds are generally classified as non-
marketable equity securities carried at fair value. The fair
values of these investments are estimated using the NAV of
the Company’s ownership interest in the funds. Some of these
investments are in “covered funds” for purposes of the
Volcker Rule, which prohibits certain proprietary investment
activities and limits the ownership of, and relationships with,
covered funds. On April 21, 2017, Citi’s request for extension
of the permitted holding period under the Volcker Rule for
certain of its investments in illiquid funds was approved,
allowing the Company to hold such investments until the
earlier of five years from the July 21, 2017 expiration date of
the general conformance period or the date such investments
mature or are otherwise conformed with the Volcker Rule.
Fair value
Unfunded
commitments
Redemption frequency
(if currently eligible)
monthly, quarterly, annually
Redemption
notice
period
In millions of dollars
December 31,
2020
December 31,
2019
December 31,
2020
December 31,
2019
Private equity funds
(1)(2)
$ 123 $ 134 $ 62 $ 62 — —
Real estate funds
(2)(3)
9 10 20 18 — —
Mutual/collective
investment funds 20 26 — —
Total $ 152 $ 170 $ 82 $ 80 — —
(1) Private equity funds include funds that invest in infrastructure, emerging markets and venture capital.
(2) With respect to the Company’s investments in private equity funds and real estate funds, distributions from each fund will be received as the underlying assets
held by these funds are liquidated. It is estimated that the underlying assets of these funds will be liquidated over a period of several years as market conditions
allow. Private equity and real estate funds do not allow redemption of investments by their investors. Investors are permitted to sell or transfer their investments,
subject to the approval of the general partner or investment manager of these funds, which generally may not be unreasonably withheld.
(3) Includes several real estate funds that invest primarily in commercial real estate in the U.S., Europe and Asia.
203
14. LOANS
Citigroup loans are reported in two categories: consumer and
corporate. These categories are classified primarily according
to the segment and subsegment that manage the loans.
Consumer Loans
Consumer loans represent loans and leases managed primarily
by GCB and Corporate/Other.
Citigroup has established a risk management process to
monitor, evaluate and manage the principal risks associated
with its consumer loan portfolio. Credit quality indicators that
are actively monitored include delinquency status, consumer
credit scores under Fair Isaac Corporation (FICO) and loan to
value (LTV) ratios, each as discussed in more detail below.
Included in the loan table above are lending products
whose terms may give rise to greater credit issues. Credit
cards with below-market introductory interest rates and
interest-only loans are examples of such products. These
products are closely managed using credit techniques that are
intended to mitigate their higher inherent risk.
Delinquency Status
Delinquency status is monitored and considered a key
indicator of credit quality of consumer loans. Principally, the
U.S. residential first mortgage loans use the Mortgage Bankers
Association (MBA) method of reporting delinquencies, which
considers a loan delinquent if a monthly payment has not been
received by the end of the day immediately preceding the
loan’s next due date. All other loans use a method of reporting
delinquencies that considers a loan delinquent if a monthly
payment has not been received by the close of business on the
loan’s next due date.
As a general policy, residential first mortgages, home
equity loans and installment loans are classified as non-accrual
when loan payments are 90 days contractually past due. Credit
cards and unsecured revolving loans generally accrue interest
until payments are 180 days past due. Home equity loans in
regulated bank entities are classified as non-accrual if the
related residential first mortgage is 90 days or more past due.
Mortgage loans, other than Federal Housing Administration
(FHA)-insured loans, are classified as non-accrual within 60
days of notification that the borrower has filed for bankruptcy.
The policy for re-aging modified U.S. consumer loans to
current status varies by product. Generally, one of the
conditions to qualify for these modifications is that a
minimum number of payments (typically ranging from one to
three) be made. Upon modification, the loan is re-aged to
current status. However, re-aging practices for certain open-
ended consumer loans, such as credit cards, are governed by
Federal Financial Institutions Examination Council (FFIEC)
guidelines. For open-ended consumer loans subject to FFIEC
guidelines, one of the conditions for a loan to be re-aged to
current status is that at least three consecutive minimum
monthly payments, or the equivalent amount, must be
received. In addition, under FFIEC guidelines, the number of
times that such a loan can be re-aged is subject to limitations
(generally once in 12 months and twice in five years).
Furthermore, FHA and Department of Veterans Affairs
(VA) loans are modified under those respective agencies’
guidelines and payments are not always required in order to
re-age a modified loan to current.
204

The following tables provide Citi’s consumer loans by type:
Consumer Loans, Delinquencies and Non-Accrual Status at December 31, 2020
In millions of dollars
Total
current
(1)(2)
30–89 days
past due
(3)(4)
≥ 90 days
past due
(3)(4)
Past due
government
guaranteed
(5)
Total
loans
Non-
accrual
loans for
which there
are no loan
loss
reserves
Non-
accrual
loans for
which
there are
loan loss
reserves
Total
non-
accrual
90 days
past due
and accruing
In North America offices
(6)
Residential first mortgages
(7)
$ 46,471 $ 402 $ 381 $ 524 $ 47,778 $ 136 $ 509 $ 645 $ 332
Home equity loans
(8)(9)
6,829 78 221 — 7,128 72 307 379 —
Credit cards 127,827 1,228 1,330 — 130,385 — — — 1,330
Personal, small business and other 4,472 27 10 — 4,509 2 33 35 —
Total $ 185,599 $ 1,735 $ 1,942 $ 524 $ 189,800 $ 210 $ 849 $ 1,059 $ 1,662
In offices outside North America
(6)
Residential first mortgages
(7)
$ 39,557 $ 213 $ 199 $ — $ 39,969 $ — $ 486 $ 486 $ —
Credit cards 21,718 429 545 — 22,692 — 384 384 376
Personal, small business and other 35,925 319 134 — 36,378 — 212 212 —
Total $ 97,200 $ 961 $ 878 $ — $ 99,039 $ — $ 1,082 $ 1,082 $ 376
Total Citigroup
(10)
$ 282,799 $ 2,696 $ 2,820 $ 524 $ 288,839 $ 210 $ 1,931 $ 2,141 $ 2,038
Consumer Loans, Delinquencies and Non-Accrual Status at December 31, 2019
In millions of dollars
Total
current
(1)(2)
30–89 days
past due
(3)
≥ 90 days
past due
(3)
Past due
government
guaranteed
(5)
Total
loans
Total
non-
accrual
90 days
past due
and accruing
In North America offices
(6)
Residential first mortgages
(7)
$ 45,942 $ 411 $ 221 $ 434 $ 47,008 $ 479 $ 288
Home equity loans
(8)(9)
8,860 174 189 — 9,223 405 —
Credit cards 145,477 1,759 1,927 — 149,163 — 1,927
Personal, small business and other 3,641 44 14 — 3,699 21 —
Total $ 203,920 $ 2,388 $ 2,351 $ 434 $ 209,093 $ 905 $ 2,215
In offices outside North America
(6)
Residential first mortgages
(7)
$ 37,654 $ 210 $ 160 $ — $ 38,024 $ 425 $ —
Credit cards 25,111 426 372 — 25,909 310 242
Personal, small business and other 36,118 272 132 — 36,522 176 —
Total $ 98,883 $ 908 $ 664 $ — $ 100,455 $ 911 $ 242
Total Citigroup
(10)
$ 302,803 $ 3,296 $ 3,015 $ 434 $ 309,548 $ 1,816 $ 2,457
(1) Loans less than 30 days past due are presented as current.
(2) Includes $14 million and $18 million at December 31, 2020 and 2019, respectively, of residential first mortgages recorded at fair value.
(3) Excludes loans guaranteed by U.S. government-sponsored agencies.
(4) Loans modified under Citi’s consumer relief programs continue to be reported in the same delinquency bucket they were in at the time of modification, and thus
almost all would not be reported as 30-89 or 90+ days past due for the duration of the programs (which have various durations, and certain of which may be
renewed by the customer).
(5) Consists of residential first mortgages that are guaranteed by U.S. government-sponsored agencies that are 30–89 days past due of $0.2 billion and $0.1 billion and
90 days or more past due of $0.4 billion and $0.3 billion at December 31, 2020 and 2019, respectively.
(6) North America includes the U.S., Canada and Puerto Rico. Mexico is included in offices outside North America.
(7) Includes approximately $0.1 billion and $0.1 billion at December 31, 2020 and 2019, respectively, of residential first mortgage loans in process of foreclosure.
(8) Includes approximately $0.1 billion and $0.1 billion at December 31, 2020 and 2019, respectively, of home equity loans in process of foreclosure.
(9) Fixed-rate home equity loans and loans extended under home equity lines of credit, which are typically in junior lien positions.
(10) Consumer loans are net of unearned income of $749 million and $783 million at December 31, 2020 and 2019, respectively. Unearned income on consumer loans
primarily represents unamortized origination fees and costs, premiums and discounts.
205
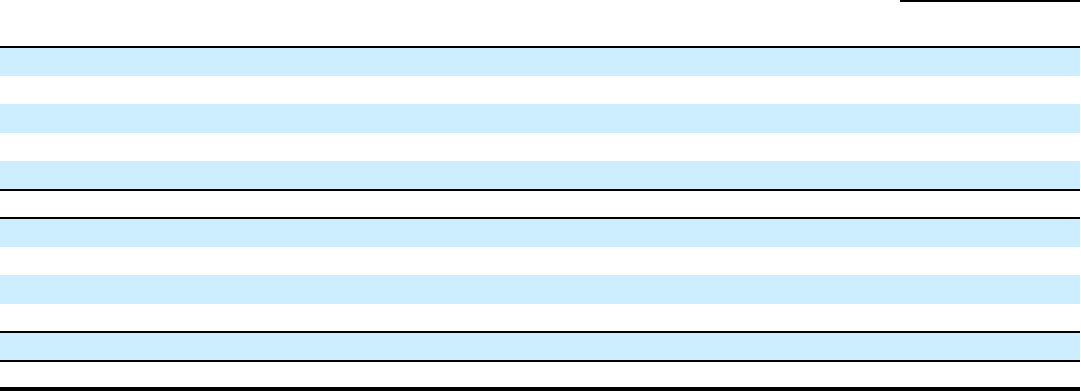
Interest Income Recognized for Non-Accrual Consumer Loans
Interest income
In millions of dollars
For the year ended
December 31, 2020
In North America offices
(1)
Residential first mortgages $ 15
Home equity loans 8
Credit cards —
Personal, small business and other —
Total $ 23
In offices outside North America
(1)
Residential first mortgages $ —
Credit cards —
Personal, small business and other —
Total $ —
Total Citigroup $ 23
(1) North America includes the U.S., Canada and Puerto Rico. Mexico is included in offices outside North America.
During the years ended December 31, 2020 and 2019, the Company sold and/or reclassified to HFS $414 million and $2,857 million,
respectively, of consumer loans.
206

Consumer Credit Scores (FICO)
In the U.S., independent credit agencies rate an individual’s
risk for assuming debt based on the individual’s credit history
and assign every consumer a Fair Isaac Corporation (FICO)
credit score. These scores are continually updated by the
agencies based upon an individual’s credit actions (e.g., taking
out a loan or missed or late payments).
The following tables provide details on the FICO scores
for Citi’s U.S. consumer loan portfolio based on end-of-period
receivables by year of origination. FICO scores are updated
monthly for substantially all of the portfolio or, otherwise, on
a quarterly basis for the remaining portfolio.
FICO score distribution in U.S. portfolio
(1)
December 31, 2020
In millions of dollars
Less than
680 680 to 760
Greater
than 760
FICO not
available Total loans
Residential first mortgages
2020 $ 187 $ 3,741 $ 9,052
2019 150 1,857 5,384
2018 246 655 1,227
2017 298 846 1,829
2016 323 1,368 3,799
Prior 1,708 4,133 9,105
Total residential first mortgages $ 2,912 $ 12,600 $ 30,396 $ 1,870 $ 47,778
Credit cards
(2)
$ 26,227 $ 52,778 $ 49,767 $ 1,041 $ 129,813
Home equity loans (pre-reset) $ 292 $ 1,014 $ 1,657
Home equity loans (post-reset) 1,055 1,569 1,524
Total home equity loans $ 1,347 $ 2,583 $ 3,181 $ 17 $ 7,128
Installment and other
2020 $ 23 $ 58 $ 95
2019 79 106 134
2018 82 80 84
2017 26 27 30
2016 10 9 8
Prior 214 393 529
Personal, small business and other $ 434 $ 673 $ 880 $ 2,522 $ 4,509
Total $ 30,920 $ 68,634 $ 84,224 $ 5,450 $ 189,228
(1) The FICO bands in the tables are consistent with general industry peer presentations.
(2) Excludes $572 million of balances related to Canada.
FICO score distribution in U.S. portfolio
(1)
December 31, 2019
In millions of dollars
Less than
680 680 to 760
Greater
than 760
FICO not
available Total loans
Residential first mortgages $ 3,608 $ 13,264 $ 28,442 $ 1,694 $ 47,008
Credit cards
(2)
33,290 59,536 52,935 2,773 148,534
Home equity loans 1,901 3,530 3,732 60 9,223
Personal, small business and other 564 907 1,473 755 3,699
Total $ 39,363 $ 77,237 $ 86,582 $ 5,282 $ 208,464
(1) The FICO bands in the tables are consistent with general industry peer presentations.
(2) Excludes $629 million of balances related to Canada.
207
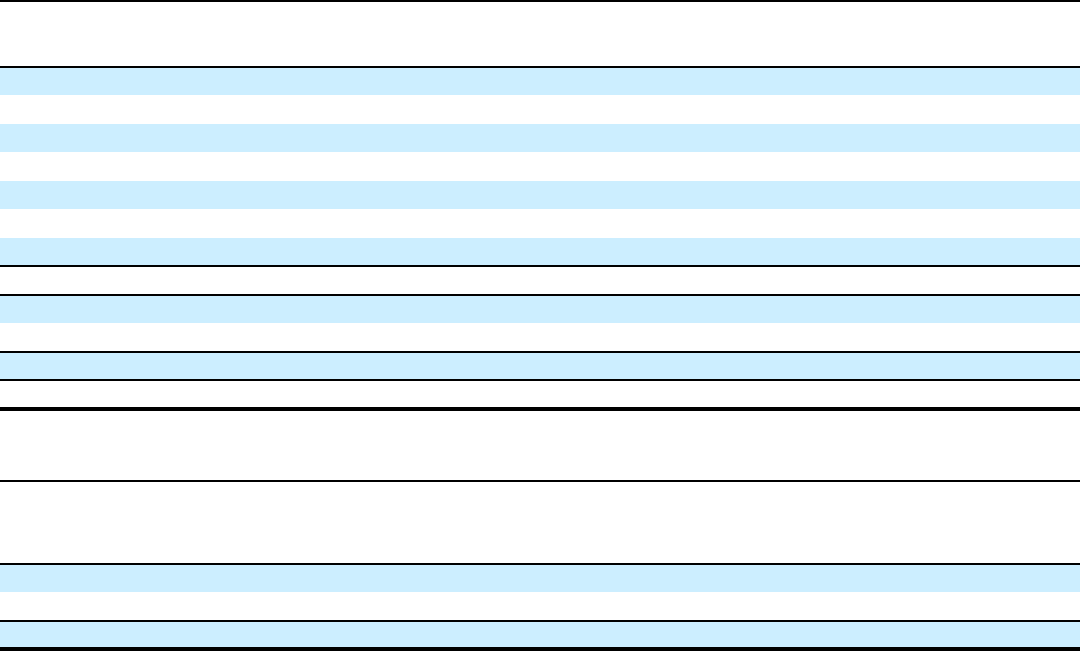
Loan to Value (LTV) Ratios
LTV ratios (loan balance divided by appraised value) are
calculated at origination and updated by applying market price
data.
The following tables provide details on the LTV ratios for
Citi’s U.S. consumer mortgage portfolios. LTV ratios are
updated monthly using the most recent Core Logic Home
Price Index data available for substantially all of the portfolio
applied at the Metropolitan Statistical Area level, if available,
or the state level if not. The remainder of the portfolio is
updated in a similar manner using the Federal Housing
Finance Agency indices.
LTV distribution in U.S. portfolio December 31, 2020
In millions of dollars
Less than
or equal
to 80%
> 80% but less
than or equal
to 100%
Greater
than
100%
LTV not
available Total
Residential first mortgages
2020 $ 11,447 $ 1,543 $ —
2019 7,029 376 2
2018 1,617 507 11
2017 2,711 269 4
2016 5,423 84 2
Prior 14,966 66 16
Total residential first mortgages $ 43,193 $ 2,845 $ 35 $ 1,705 $ 47,778
Home equity loans (pre-reset) $ 2,876 $ 50 $ 16
Home equity loans (post-reset) 3,782 290 58
Total home equity loans $ 6,658 $ 340 $ 74 $ 56 $ 7,128
Total $ 49,851 $ 3,185 $ 109 $ 1,761 $ 54,906
LTV distribution in U.S. portfolio December 31, 2019
In millions of dollars
Less than
or
equal to
80%
> 80% but less
than or equal to
100%
Greater
than
100%
LTV not
available Total
Residential first mortgages $ 41,993 $ 3,313 $ 98 $ 1,604 $ 47,008
Home equity loans 8,101 829 237 56 9,223
Total $ 50,094 $ 4,142 $ 335 $ 1,660 $ 56,231
208
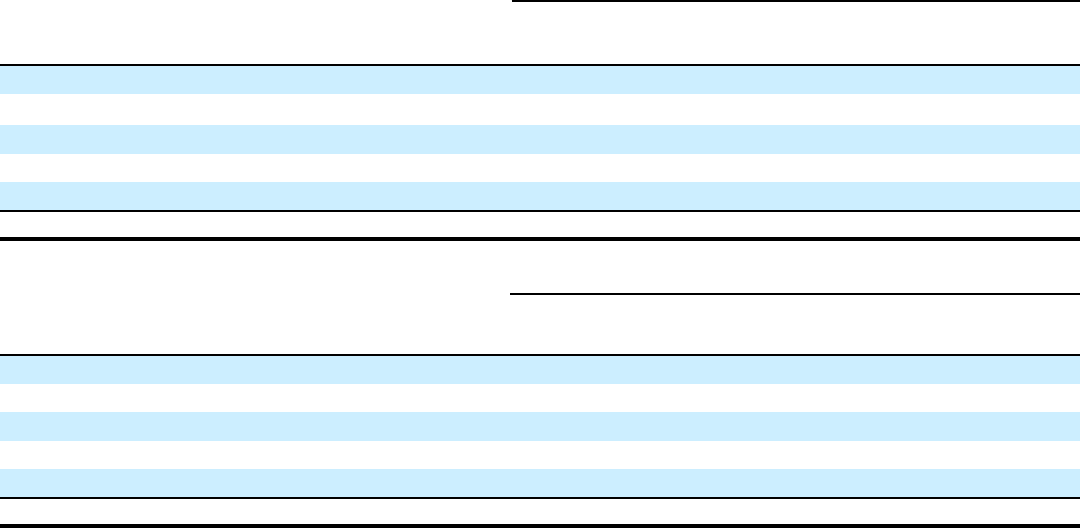
Impaired Consumer Loans
A loan is considered impaired when Citi believes it is probable
that all amounts due according to the original contractual
terms of the loan will not be collected. Impaired consumer
loans include non-accrual loans, as well as smaller-balance
homogeneous loans whose terms have been modified due to
the borrower’s financial difficulties and where Citi has granted
a concession to the borrower. These modifications may
include interest rate reductions and/or principal forgiveness.
Impaired consumer loans exclude smaller-balance
homogeneous loans that have not been modified and are
carried on a non-accrual basis.
The following tables present information about impaired
consumer loans and interest income recognized on impaired
consumer loans:
At and for the year ended December 31, 2020
In millions of dollars
Recorded
investment
(1)(2)
Unpaid
principal
balance
Related
specific
allowance
(3)
Average
carrying
value
(4)
Interest
income
recognized
(5)
Mortgage and real estate
Residential first mortgages $ 1,787 $ 1,962 $ 157 $ 1,661 $ 68
Home equity loans 478 651 60 527 13
Credit cards 1,982 2,135 918 1,926 106
Personal, small business and other 552 552 210 463 63
Total $ 4,799 $ 5,300 $ 1,345 $ 4,577 $ 250
At and for the year ended December 31, 2019
In millions of dollars
Recorded
investment
(1)(2)
Unpaid
principal
balance
Related
specific
allowance
(3)
Average
carrying
value
(4)
Interest
income
recognized
(5)
Mortgage and real estate
Residential first mortgages $ 1,666 $ 1,838 $ 161 $ 1,925 $ 60
Home equity loans 592 824 123 637 9
Credit cards 1,931 2,288 771 1,890 103
Personal, small business and other 419 455 135 683 55
Total $ 4,608 $ 5,405 $ 1,190 $ 5,135 $ 227
(1) Recorded investment in a loan includes net deferred loan fees and costs, unamortized premium or discount and direct write-downs and includes accrued interest
only on credit card loans.
(2) For December 31, 2020, $211 million of residential first mortgages and $147 million of home equity loans do not have a specific allowance. For December 31,
2019, $405 million of residential first mortgages and $212 million of home equity loans do not have a specific allowance.
(3) Included in the Allowance for credit losses on loans.
(4) Average carrying value represents the average recorded investment ending balance for the last four quarters and does not include the related specific allowance.
(5) Includes amounts recognized on both an accrual and cash basis.
209
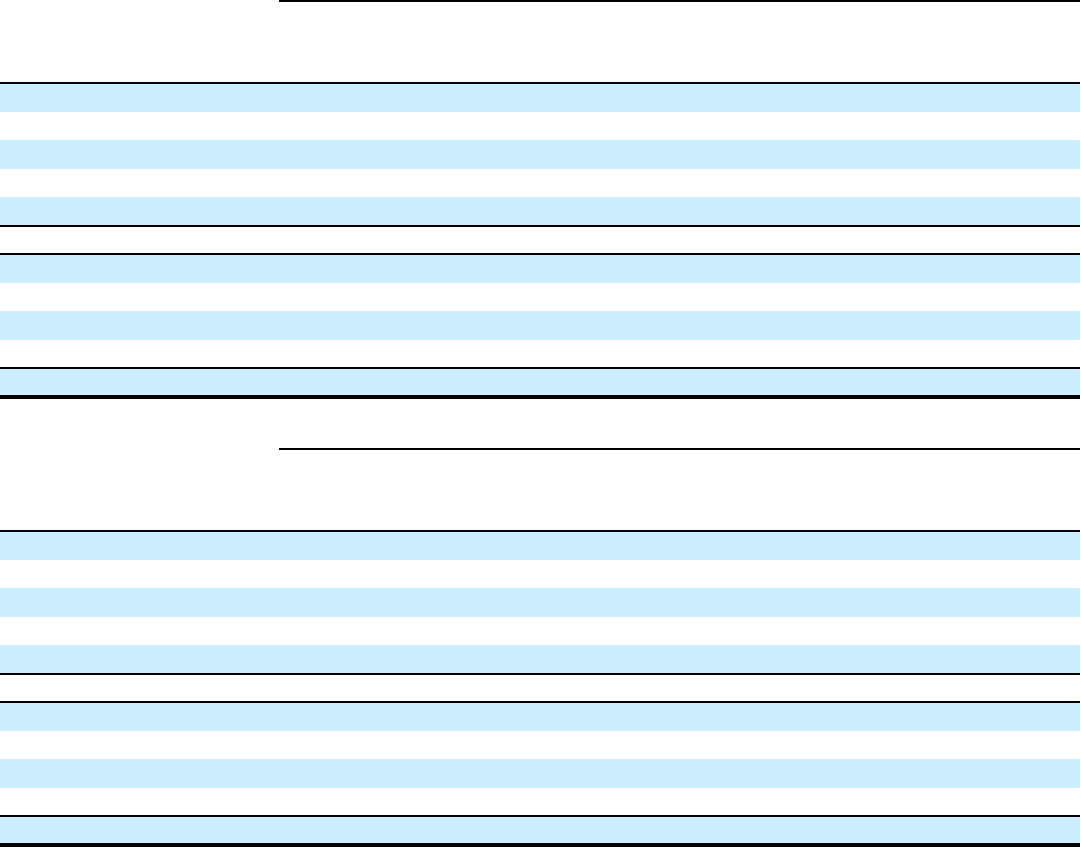
Consumer Troubled Debt Restructurings
(1)
For the year ended December 31, 2020
(1)
In millions of dollars, except number of
loans modified
Number of
loans modified
Post-
modification
recorded
investment
(2)(3)
Deferred
principal
(4)
Contingent
principal
forgiveness
(5)
Principal
forgiveness
(6)
Average
interest rate
reduction
North America
Residential first mortgages 1,225 $ 209 $ — $ — $ — — %
Home equity loans 296 27 — — — 1
Credit cards 215,466 1,038 — — — 17
Personal, small business and other 2,452 28 — — — 5
Total
(7)
219,439 $ 1,302 $ — $ — $ —
International
Residential first mortgages 2,542 $ 141 $ 3 $ — $ — 2 %
Credit cards 90,694 401 — — 12 15
Personal, small business and other 41,079 301 — — 8 10
Total
(7)
134,315 $ 843 $ 3 $ — $ 20
For the year ended December 31, 2019
In millions of dollars, except number of
loans modified
Number of
loans modified
Post-
modification
recorded
investment
(2)(8)
Deferred
principal
(4)
Contingent
principal
forgiveness
(5)
Principal
forgiveness
(6)
Average
interest rate
reduction
North America
Residential first mortgages 1,122 $ 172 $ — $ — $ — — %
Home equity loans 717 79 3 — — 1
Credit cards 268,778 1,165 — — — 17
Personal, small business and other 1,719 15 — — — 5
Total
(7)
272,336 $ 1,431 $ 3 $ — $ —
International
Residential first mortgages 2,448 $ 74 $ — $ — $ — — %
Credit cards 72,325 288 — — 10 17
Personal, small business and other 29,192 204 — — 6 9
Total
(7)
103,965 $ 566 $ — $ — $ 16
(1) The above tables do not include loan modifications that meet the TDR relief criteria in the Coronavirus Aid, Relief, and Economic Security Act (CARES Act) or
the interagency guidance.
(2) Post-modification balances include past-due amounts that are capitalized at the modification date.
(3) Post-modification balances in North America include $13 million of residential first mortgages and $2 million of home equity loans to borrowers who have gone
through Chapter 7 bankruptcy in the year ended December 31, 2020. These amounts include $9 million of residential first mortgages and $2 million of home
equity loans that were newly classified as TDRs during 2020, based on previously received OCC guidance.
(4) Represents portion of contractual loan principal that is non-interest bearing, but still due from the borrower. Such deferred principal is charged off at the time of
permanent modification to the extent that the related loan balance exceeds the underlying collateral value.
(5) Represents portion of contractual loan principal that is non-interest bearing and, depending upon borrower performance, eligible for forgiveness.
(6) Represents portion of contractual loan principal that was forgiven at the time of permanent modification.
(7) The above tables reflect activity for restructured loans that were considered TDRs during the year.
(8) Post-modification balances in North America include $19 million of residential first mortgages and $7 million of home equity loans to borrowers who have gone
through Chapter 7 bankruptcy in the year ended December 31, 2019. These amounts include $11 million of residential first mortgages and $6 million of home
equity loans that were newly classified as TDRs during 2019, based on previously received OCC guidance.
210
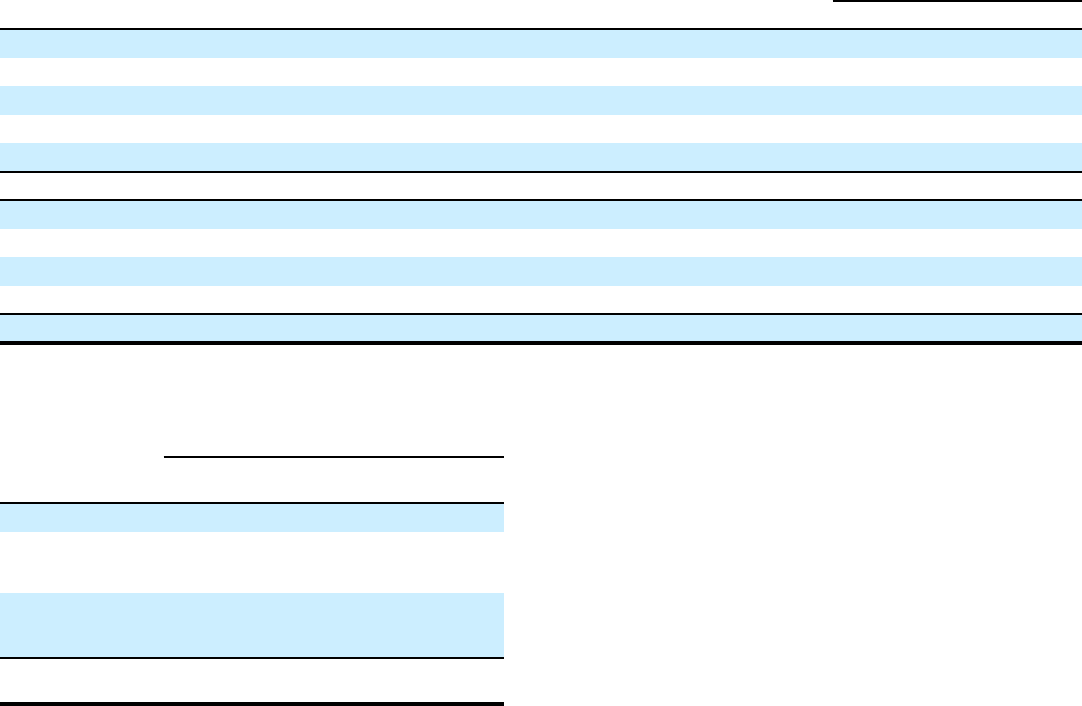
The following table presents consumer TDRs that defaulted for which the payment default occurred within one year of a
permanent modification. Default is defined as 60 days past due.
Years ended December 31,
In millions of dollars
2020 2019
North America
Residential first mortgages $ 71 $ 85
Home equity loans 14 15
Credit cards 317 301
Personal, small business and other 4 4
Total $ 406 $ 405
International
Residential first mortgages $ 26 $ 13
Credit cards 178 142
Personal, small business and other 78 74
Total $ 282 $ 229
Purchased Credit-Deteriorated Assets
Year ended December 31, 2020
In millions of dollars
Credit
cards Mortgages
(1)
Installment and
other
Purchase price $ 4 $ 49 $ —
Allowance for credit
losses at acquisition
date 4 — —
Discount or
premium attributable
to non-credit factors — — —
Par value (amortized
cost basis) $ 8 $ 49 $ —
(1) Includes loans sold to agencies that were bought back at par due to
repurchase agreements.
211

Corporate Loans
Corporate loans represent loans and leases managed by ICG.
The following table presents information by corporate loan
type:
In millions of dollars
December 31,
2020
December 31,
2019
In North America offices
(1)
Commercial and industrial $ 57,731 $ 55,929
Financial institutions 55,809 53,922
Mortgage and real estate
(2)
60,675 53,371
Installment and other 26,744 31,238
Lease financing 673 1,290
Total $ 201,632 $ 195,750
In offices outside
North America
(1)
Commercial and industrial $ 104,072 $ 112,668
Financial institutions 32,334 40,211
Mortgage and real estate
(2)
11,371 9,780
Installment and other 33,759 27,303
Lease financing 65 95
Governments and official
institutions 3,811 4,128
Total $ 185,412 $ 194,185
Corporate loans, net of
unearned income
(3)
$ 387,044 $ 389,935
(1) North America includes the U.S., Canada and Puerto Rico. Mexico is
included in offices outside North America. The classification between
offices in North America and outside North America is based on the
domicile of the booking unit. The difference between the domicile of the
booking unit and the domicile of the managing unit is not material.
(2) Loans secured primarily by real estate.
(3) Corporate loans are net of unearned income of ($844) million and ($814)
million at December 31, 2020 and 2019, respectively. Unearned income
on corporate loans primarily represents interest received in advance, but
not yet earned, on loans originated on a discounted basis.
The Company sold and/or reclassified to held-for-sale
$2.2 billion and $2.6 billion of corporate loans during the
years ended December 31, 2020 and 2019, respectively. The
Company did not have significant purchases of corporate loans
classified as held-for-investment for the years ended
December 31, 2020 or 2019.
Lease financing
Citi is a lessor in the power, railcars, shipping and aircraft
sectors, where the Company has executed operating, direct
financing and leveraged leases. Citi’s $0.7 billion of lease
financing receivables, as of December 31, 2020, is composed
of approximately equal balances of direct financing lease
receivables and net investments in leveraged leases. Citi uses
the interest rate implicit in the lease to determine the present
value of its lease financing receivables. Interest income on
direct financing and leveraged leases during the year ended
December 31, 2020 was not material.
The Company’s leases have an average remaining
maturity of approximately three and a half years. In certain
cases, Citi obtains residual value insurance from third parties
and/or the lessee to manage the risk associated with the
residual value of the leased assets. The receivable related to
the residual value of the leased assets is $0.3 billion as of
December 31, 2020, while the amount covered by residual
value guarantees is $0.2 billion.
The Company’s operating leases, where Citi is a lessor,
are not significant to the Consolidated Financial Statements.
Delinquency Status
Citi generally does not manage corporate loans on a
delinquency basis. Corporate loans are identified as impaired
and placed on a cash (non-accrual) basis when it is
determined, based on actual experience and a forward-looking
assessment of the collectability of the loan in full, that the
payment of interest or principal is doubtful or when interest or
principal is 90 days past due, except when the loan is well
collateralized and in the process of collection. Any interest
accrued on impaired corporate loans and leases is reversed at
90 days and charged against current earnings, and interest is
thereafter included in earnings only to the extent actually
received in cash. When there is doubt regarding the ultimate
collectability of principal, all cash receipts are thereafter
applied to reduce the recorded investment in the loan. While
corporate loans are generally managed based on their
internally assigned risk rating (see further discussion below),
the following tables present delinquency information by
corporate loan type.
212
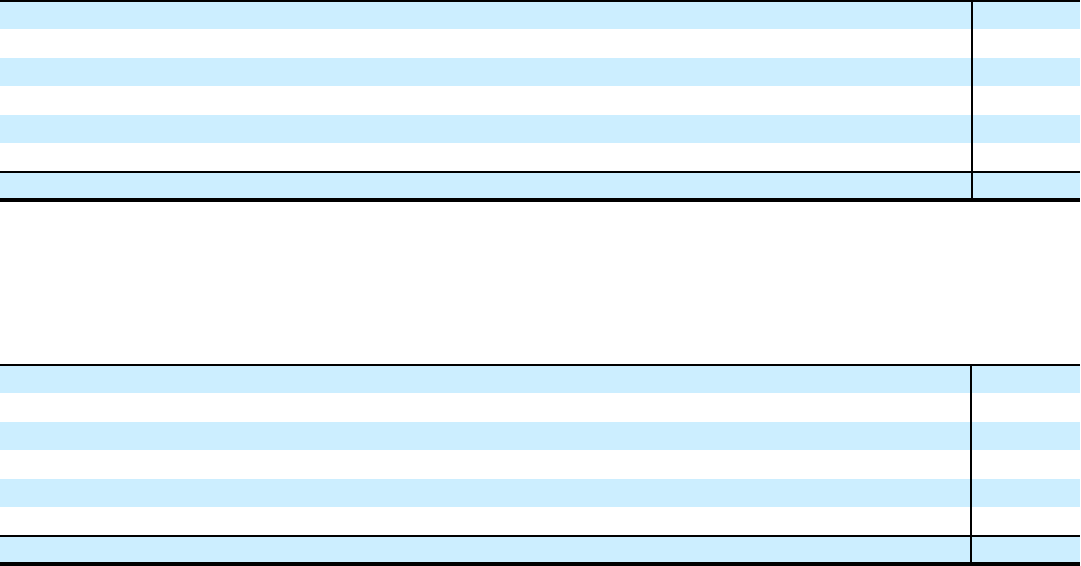
Corporate Loan Delinquencies and Non-Accrual Details at December 31, 2020
In millions of dollars
30–89 days
past due
and accruing
(1)
≥ 90 days
past due and
accruing
(1)
Total past due
and accruing
Total
non-accrual
(2)
Total
current
(3)
Total
loans
(4)
Commercial and industrial $ 400 $ 109 $ 509 $ 2,795 $ 153,036 $ 156,340
Financial institutions 668 65 733 92 86,864 87,689
Mortgage and real estate 450 247 697 505 70,836 72,038
Lease financing 62 12 74 24 640 738
Other 112 19 131 111 63,157 63,399
Loans at fair value 6,840
Total $ 1,692 $ 452 $ 2,144 $ 3,527 $ 374,533 $ 387,044
Corporate Loan Delinquencies and Non-Accrual Details at December 31, 2019
In millions of dollars
30–89 days
past due
and accruing
(1)
≥ 90 days
past due and
accruing
(1)
Total past due
and accruing
Total
non-accrual
(2)
Total
current
(3)
Total
loans
(4)
Commercial and industrial $ 676 $ 93 $ 769 $ 1,828 $ 164,249 $ 166,846
Financial institutions 791 3 794 50 91,008 91,852
Mortgage and real estate 534 4 538 188 62,425 63,151
Lease financing 58 9 67 41 1,277 1,385
Other 190 22 212 81 62,341 62,634
Loans at fair value 4,067
Total $ 2,249 $ 131 $ 2,380 $ 2,188 $ 381,300 $ 389,935
(1) Corporate loans that are 90 days past due are generally classified as non-accrual. Corporate loans are considered past due when principal or interest is
contractually due but unpaid.
(2) Non-accrual loans generally include those loans that are 90 days or more past due or those loans for which Citi believes, based on actual experience and a forward-
looking assessment of the collectability of the loan in full, that the payment of interest or principal is doubtful.
(3) Loans less than 30 days past due are presented as current.
(4) Total loans include loans at fair value, which are not included in the various delinquency columns.
Citigroup has a risk management process to monitor,
evaluate and manage the principal risks associated with its
corporate loan portfolio. As part of its risk management
process, Citi assigns numeric risk ratings to its corporate loan
facilities based on quantitative and qualitative assessments of
the obligor and facility. These risk ratings are reviewed at least
annually or more often if material events related to the obligor
or facility warrant. Factors considered in assigning the risk
ratings include financial condition of the obligor, qualitative
assessment of management and strategy, amount and sources
of repayment, amount and type of collateral and guarantee
arrangements, amount and type of any contingencies
associated with the obligor and the obligor’s industry and
geography.
The obligor risk ratings are defined by ranges of default
probabilities. The facility risk ratings are defined by ranges of
loss norms, which are the product of the probability of default
and the loss given default. The investment grade rating
categories are similar to the category BBB-/Baa3 and above as
defined by S&P and Moody’s. Loans classified according to
the bank regulatory definitions as special mention, substandard
and doubtful will have risk ratings within the non-investment-
grade categories.
213
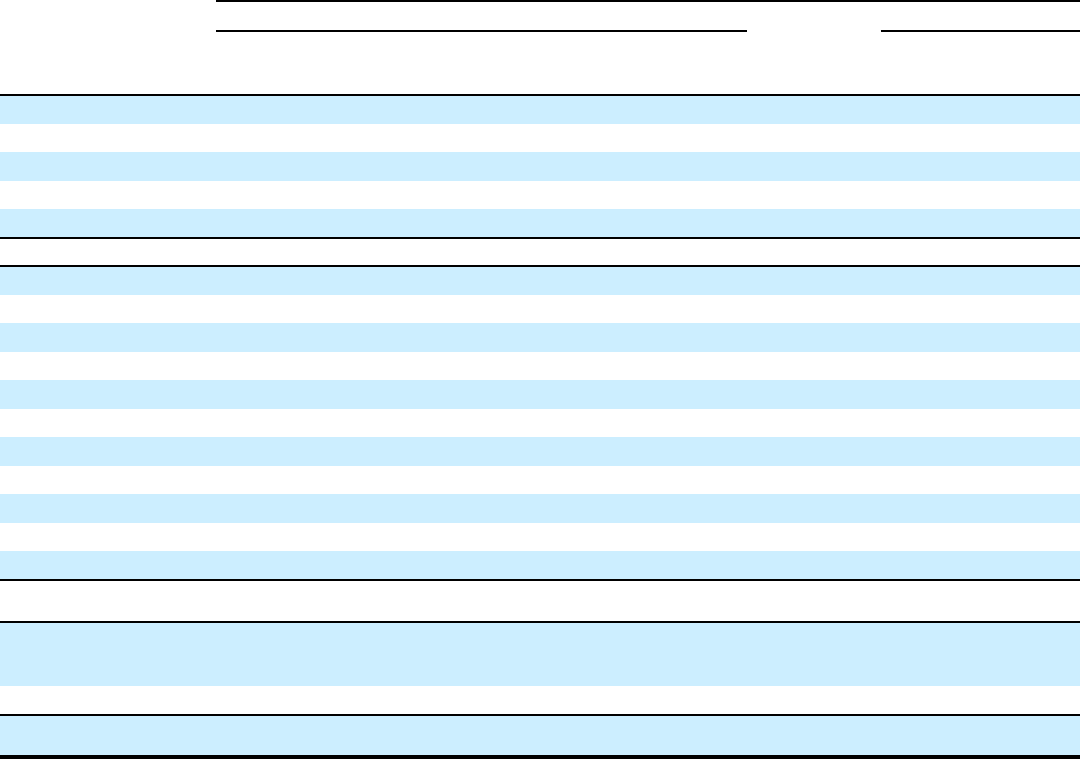
Corporate Loans Credit Quality Indicators
Recorded investment in loans
(1)
Term loans by year of origination
Revolving line
of credit
arrangements
(2)
Totals as of
In millions of dollars
2020 2019 2018 2017 2016 Prior
December
31,
2020
December
31,
2019
Investment grade
(3)
Commercial and industrial
(4)
$ 38,398 $ 7,607 $ 5,929 $ 3,909 $ 2,094 $ 8,670 $ 25,819 $ 92,426 $ 110,797
Financial institutions
(4)
10,560 2,964 2,106 782 681 2,030 56,239 75,362 80,533
Mortgage and real estate 6,793 6,714 5,174 2,568 1,212 1,719 1,557 25,737 27,571
Other
(5)
10,874 3,566 4,597 952 780 5,290 31,696 57,755 58,155
Total investment grade $ 66,625 $ 20,851 $ 17,806 $ 8,211 $ 4,767 $ 17,709 $ 115,311 $ 251,280 $ 277,056
Non-investment grade
(3)
Accrual
Commercial and industrial
(4)
$ 19,683 $ 4,794 $ 4,645 $ 2,883 $ 1,182 $ 4,533 $ 23,400 $ 61,120 $ 54,220
Financial institutions
(4)
7,413 700 654 274 141 197 2,855 12,234 11,269
Mortgage and real estate 1,882 1,919 2,058 1,457 697 837 551 9,401 3,811
Other
(5)
1,407 918 725 370 186 657 1,986 6,249 5,734
Non-accrual
Commercial and industrial
(4)
260 203 192 143 57 223 1,717 2,795 1,828
Financial institutions 1 — — — — — 91 92 50
Mortgage and real estate 13 4 3 18 8 32 427 505 188
Other
(5)
15 3 12 29 2 65 9 135 122
Total non-investment
grade $ 30,674 $ 8,541 $ 8,289 $ 5,174 $ 2,273 $ 6,544 $ 31,036 $ 92,531 $ 77,222
Non-rated private bank
loans managed on a
delinquency basis
(3)(6)
$ 9,823 $ 7,121 $ 3,533 $ 3,674 $ 4,300 $ 7,942 $ — $ 36,393 $ 31,590
Loans at fair value
(7)
6,840 4,067
Corporate loans, net of
unearned income $ 107,122 $ 36,513 $ 29,628 $ 17,059 $ 11,340 $ 32,195 $ 146,347 $ 387,044 $ 389,935
(1) Recorded investment in a loan includes net deferred loan fees and costs, unamortized premium or discount, less any direct write-downs.
(2) There were no significant revolving line of credit arrangements that converted to term loans during the year.
(3) Held-for-investment loans are accounted for on an amortized cost basis.
(4) Includes certain short-term loans with less than one year in tenor.
(5) Other includes installment and other, lease financing and loans to government and official institutions.
(6) Non-rated private bank loans mainly include mortgage and real estate loans to private banking clients.
(7) Loans at fair value include loans to commercial and industrial, financial institutions, mortgage and real estate and other.
Impaired collateral-dependent loans and leases, where
repayment is expected to be provided solely by the sale of the
underlying collateral and there are no other available and
reliable sources of repayment, are written down to the lower of
carrying value or collateral value, less cost to sell. Cash-basis
loans are returned to an accrual status when all contractual
principal and interest amounts are reasonably assured of
repayment and there is a sustained period of repayment
performance, generally six months, in accordance with the
contractual terms of the loan.
214

Non-Accrual Corporate Loans
The following tables present non-accrual loan information by corporate loan type and interest income recognized on non-accrual
corporate loans:
At and for the year ended December 31, 2020
In millions of dollars
Recorded
investment
(1)
Unpaid
principal balance
Related specific
allowance
Average
carrying value
(2)
Interest income
recognized
(3)
Non-accrual corporate loans
Commercial and industrial $ 2,795 $ 3,664 $ 442 $ 2,649 $ 14
Financial institutions 92 181 17 132 —
Mortgage and real estate 505 803 38 413 —
Lease financing 24 24 — 34 —
Other 111 235 18 174 21
Total non-accrual corporate loans $ 3,527 $ 4,907 $ 515 $ 3,402 $ 35
At and for the year ended December 31, 2019
In millions of dollars
Recorded
investment
(1)
Unpaid
principal balance
Related specific
allowance
Average
carrying value
(2)
Interest income
recognized
(3)
Non-accrual corporate loans
Commercial and industrial $ 1,828 $ 1,942 $ 283 $ 1,449 $ 33
Financial institutions 50 120 2 63 —
Mortgage and real estate 188 362 10 192 —
Lease financing 41 41 — 8 —
Other 81 202 4 76 9
Total non-accrual corporate loans $ 2,188 $ 2,667 $ 299 $ 1,788 $ 42
December 31, 2020 December 31, 2019
In millions of dollars
Recorded
investment
(1)
Related specific
allowance
Recorded
investment
(1)
Related specific
allowance
Non-accrual corporate loans with specific allowances
Commercial and industrial $ 1,523 $ 442 $ 714 $ 283
Financial institutions 90 17 40 2
Mortgage and real estate 246 38 48 10
Lease financing — — — —
Other 68 18 7 4
Total non-accrual corporate loans with specific allowances $ 1,927 $ 515 $ 809 $ 299
Non-accrual corporate loans without specific allowances
Commercial and industrial $ 1,272 $ 1,114
Financial institutions 2 10
Mortgage and real estate 259 140
Lease financing 24 41
Other 43 74
Total non-accrual corporate loans without specific
allowances $ 1,600 N/A $ 1,379 N/A
(1) Recorded investment in a loan includes net deferred loan fees and costs, unamortized premium or discount, less any direct write-downs.
(2) Average carrying value represents the average recorded investment balance and does not include related specific allowances.
(3) Interest income recognized for the year ended December 31, 2018 was $56 million.
N/A Not applicable
215

Corporate Troubled Debt Restructurings
(1)
For the year ended December 31, 2020
In millions of dollars
Carrying value of
TDRs modified during
the period
TDRs
involving changes
in the amount
and/or timing of
principal payments
(2)
TDRs
involving changes
in the amount
and/or timing of
interest payments
(3)
TDRs
involving changes
in the amount
and/or timing of
both principal and
interest payments
Commercial and industrial $ 247 $ — $ — $ 247
Mortgage and real estate 19 — — 19
Other 19 6 — 13
Total $ 285 $ 6 $ — $ 279
For the year ended December 31, 2019
In millions of dollars
Carrying value of
TDRs modified
during the period
TDRs
involving changes
in the amount
and/or timing of
principal payments
(2)
TDRs
involving changes
in the amount
and/or timing of
interest payments
(3)
TDRs
involving changes
in the amount
and/or timing of
both principal and
interest payments
Commercial and industrial $ 283 $ 19 $ — $ 264
Mortgage and real estate 16 — — 16
Other 6 6 — —
Total $ 305 $ 25 $ — $ 280
(1) The above tables do not include loan modifications that meet the TDR relief criteria in the CARES Act or the interagency guidance.
(2) TDRs involving changes in the amount or timing of principal payments may involve principal forgiveness or deferral of periodic and/or final principal payments.
Because forgiveness of principal is rare for corporate loans, modifications typically have little to no impact on the loans’ projected cash flows and thus little to no
impact on the allowance established for the loans. Charge-offs for amounts deemed uncollectible may be recorded at the time of the restructuring or may have
already been recorded in prior periods such that no charge-off is required at the time of the modification.
(3) TDRs involving changes in the amount or timing of interest payments may involve a below-market interest rate.
The following table presents total corporate loans modified in a TDR as well as those TDRs that defaulted and for which the
payment default occurred within one year of a permanent modification. Default is defined as 60 days past due, except for classifiably
managed commercial banking loans, where default is defined as 90 days past due.
In millions of dollars
TDR balances at
December 31, 2020
TDR loans that re-defaulted
in 2020 within one year of
modification
TDR balances at
December 31, 2019
TDR loans that re-defaulted
in 2019 within one year of
modification
Commercial and industrial $ 325 $ — $ 426 $ 35
Financial institutions — — — —
Mortgage and real estate 92 — 79 —
Lease financing — — — —
Other 33 — 44 —
Total
(1)
$ 450 $ — $ 549 $ 35
(1) The above table reflects activity for loans outstanding that were considered TDRs as of the end of the reporting period.
216

15. ALLOWANCE FOR CREDIT LOSSES
In millions of dollars
2020 2019 2018
Allowance for credit losses on loans (ACLL) at beginning of year $ 12,783 $ 12,315 $ 12,355
Adjustments to opening balance:
Financial instruments—credit losses (CECL)
(1)
4,201 — —
Variable post-charge-off third-party collection costs
(1)
(443) — —
Adjusted ACLL at beginning of year $ 16,541 $ 12,315 $ 12,355
Gross credit losses on loans $ (9,263) $ (9,341) $ (8,665)
Gross recoveries on loans 1,652 1,573 1,552
Net credit losses on loans (NCLs) $ (7,611) $ (7,768) $ (7,113)
NCLs $ 7,611 $ 7,768 $ 7,113
Net reserve builds for loans 7,635 364 394
Net specific reserve builds (releases) for loans 676 86 (153)
Total provision for credit losses on loans (PCLL) $ 15,922 $ 8,218 $ 7,354
Initial allowance for credit losses on newly purchased credit-deteriorated assets during the
period 4 — —
Other, net (see table below) 100 18 (281)
ACLL at end of year $ 24,956 $ 12,783 $ 12,315
Allowance for credit losses on unfunded lending commitments (ACLUC) at beginning of
year
(2)
$ 1,456 $ 1,367 $ 1,258
Adjustment to opening balance for CECL adoption
(1)
(194) — —
Provision (release) for credit losses on unfunded lending commitments 1,446 92 113
Other, net
(3)
(53) (3) (4)
ACLUC at end of year
(2)
$ 2,655 $ 1,456 $ 1,367
Total allowance for credit losses on loans, leases and unfunded lending commitments $ 27,611 $ 14,239 $ 13,682
Other, net details
In millions of dollars
2020 2019 2018
Sales or transfers of various consumer loan portfolios to HFS
Transfer of real estate loan portfolios $ (4) $ (42) $ (91)
Transfer of other loan portfolios — — (110)
Sales or transfers of various consumer loan portfolios to HFS $ (4) $ (42) $ (201)
FX translation 97 60 (60)
Other 7 — (20)
Other, net $ 100 $ 18 $ (281)
(1) See “Accounting Changes” in Note 1 to the Consolidated Financial Statements for additional details.
(2) Represents additional credit loss reserves for unfunded lending commitments and letters of credit recorded in Other liabilities on the Consolidated Balance Sheet.
(3) 2020 includes a non-provision transfer of $68 million, representing reserves on performance guarantees. The reserves on these contracts have been reclassified out
of the allowance for credit losses on unfunded lending commitments and into Other liabilities on the Consolidated Balance Sheet beginning in 2020.
217

Allowance for Credit Losses on Loans and End-of-Period Loans at December 31, 2020
In millions of dollars
Corporate Consumer Total
ACLL at beginning of year $ 2,886 $ 9,897 $ 12,783
Adjustments to opening balance:
Financial instruments—credit losses (CECL)
(1)
(721) 4,922 4,201
Variable post-charge-off third-party collection costs
(1)
— (443) (443)
Adjusted ACLL at beginning of year $ 2,165 $ 14,376 $ 16,541
Charge-offs $ (1,072) $ (8,191) $ (9,263)
Recoveries 86 1,566 1,652
Replenishment of net charge-offs 986 6,625 7,611
Net reserve builds (releases) 2,890 4,745 7,635
Net specific reserve builds (releases) 282 394 676
Initial allowance for credit losses on newly purchased credit-deteriorated assets
during the year — 4 4
Other 65 35 100
Ending balance $ 5,402 $ 19,554 $ 24,956
Allowance for credit losses on loans
Collectively evaluated $ 4,887 $ 18,207 $ 23,094
Individually evaluated 515 1,345 1,860
Purchased credit deteriorated — 2 2
Total allowance for credit losses on loans $ 5,402 $ 19,554 $ 24,956
Loans, net of unearned income
Collectively evaluated $ 376,677 $ 283,885 $ 660,562
Individually evaluated 3,527 4,799 8,326
Purchased credit deteriorated — 141 141
Held at fair value 6,840 14 6,854
Total loans, net of unearned income $ 387,044 $ 288,839 $ 675,883
(1) See “Accounting Changes” in Note 1 to the Consolidated Financial Statements for additional details.
Allowance for Credit Losses on Loans and End-of-Period Loans at December 31, 2019
In millions of dollars
Corporate Consumer Total
ACLL at beginning of year $ 2,811 $ 9,504 $ 12,315
Charge-offs (487) (8,854) (9,341)
Recoveries 95 1,478 1,573
Replenishment of net charge-offs 392 7,376 7,768
Net reserve builds (releases) 96 268 364
Net specific reserve builds (releases) (21) 107 86
Other — 18 18
Ending balance $ 2,886 $ 9,897 $ 12,783
Allowance for credit losses on loans
Collectively evaluated $ 2,587 $ 8,706 $ 11,293
Individually evaluated 299 1,190 1,489
Purchased credit deteriorated — 1 1
Total allowance for credit losses on loans $ 2,886 $ 9,897 $ 12,783
Loans, net of unearned income
Collectively evaluated $ 383,828 $ 304,794 $ 688,622
Individually evaluated 2,040 4,608 6,648
Purchased credit deteriorated — 128 128
Held at fair value 4,067 18 4,085
Total loans, net of unearned income $ 389,935 $ 309,548 $ 699,483
218
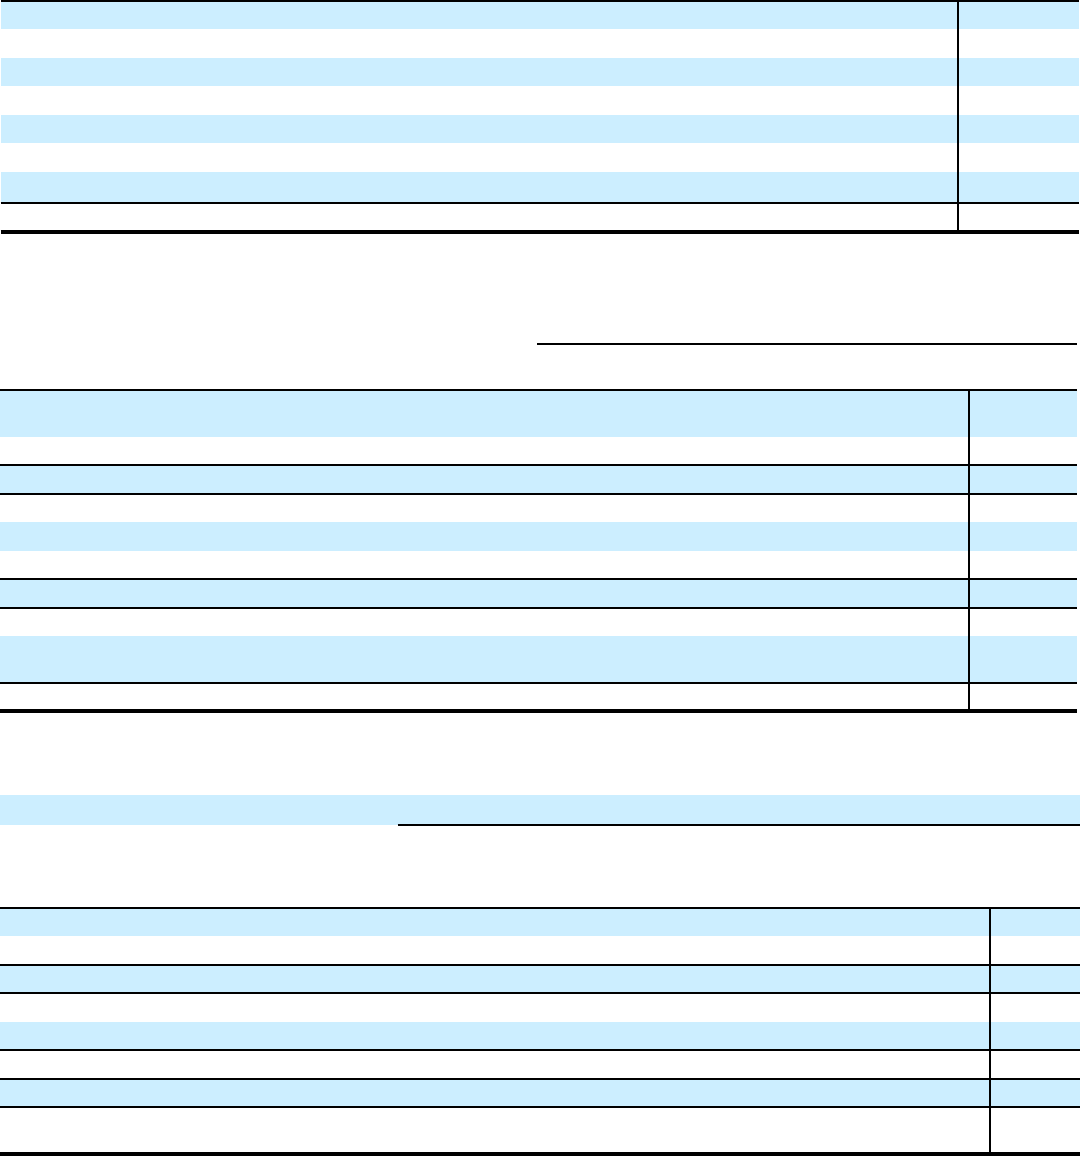
Allowance for Credit Losses on Loans at December 31, 2018
In millions of dollars
Corporate Consumer Total
ACLL at beginning of year $ 2,943 $ 9,412 $ 12,355
Charge-offs (343) (8,322) (8,665)
Recoveries 138 1,414 1,552
Replenishment of net charge-offs 205 6,908 7,113
Net reserve builds (releases) 42 352 394
Net specific reserve builds (releases) (151) (2) (153)
Other $ (23) $ (258) $ (281)
Ending balance $ 2,811 $ 9,504 $ 12,315
Allowance for Credit Losses on HTM Debt Securities
Year ended December 31, 2020
In millions of dollars
Mortgage-
backed
State and
municipal
Foreign
government
Asset-
backed Total HTM
Allowance for credit losses on HTM debt securities at beginning
of year $ — $ — $ — $ — $ —
Adjustment to opening balance for CECL adoption — 61 4 5 70
Net credit losses (NCLs) $ — $ — $ — $ — $ —
NCLs $ — $ — $ — $ — $ —
Net reserve builds (releases) (2) 10 (2) 1 7
Net specific reserve builds (releases) — — — — —
Total provision for credit losses on HTM debt securities $ (2) $ 10 $ (2) $ 1 $ 7
Other, net $ 5 $ 3 $ 4 $ (3) $ 9
Initial allowance for credit losses on newly purchased credit-
deteriorated securities during the year — — — — —
Allowance for credit losses on HTM debt securities at end of year $ 3 $ 74 $ 6 $ 3 $ 86
Allowance for Credit Losses on Other Assets
Year ended December 31, 2020
In millions of dollars
Cash and
due from
banks
Deposits
with banks
Securities borrowed
and purchased
under agreements
to resell
Brokerage
receivables
All other
assets
(1)
Total
Allowance for credit losses at beginning of year $ — $ — $ — $ — $ — $ —
Adjustment to opening balance for CECL adoption 6 14 2 1 3 26
Net credit losses (NCLs) $ — $ — $ — $ — $ — $ —
NCLs $ — $ — $ — $ — $ — $ —
Net reserve builds (releases) (6) 5 8 (1) 1 7
Total provision for credit losses $ (6) $ 5 $ 8 $ (1) $ 1 $ 7
Other, net $ — $ 1 $ — $ — $ 21 $ 22
Allowance for credit losses on other assets at end
of year $ — $ 20 $ 10 $ — $ 25 $ 55
(1) Primarily accounts receivable.
For ACL on AFS debt securities, see Note 13 to the Consolidated Financial Statements.
219

16. GOODWILL AND INTANGIBLE ASSETS
Goodwill
The changes in Goodwill by segment were as follows:
In millions of dollars
Global Consumer
Banking
Institutional
Clients Group
Corporate/
Other Total
Balance at December 31, 2017 $ 12,128 $ 10,112 $ 16 $ 22,256
Foreign exchange translation $ (41) $ (153) $ — $ (194)
Divestitures
(1)
— — (16) (16)
Balance at December 31, 2018 $ 12,087 $ 9,959 $ — $ 22,046
Foreign exchange translation $ 15 $ 65 $ — $ 80
Balance at December 31, 2019 $ 12,102 $ 10,024 $ — $ 22,126
Foreign exchange translation $ 40 $ (4) $ — $ 36
Balance at December 31, 2020 $ 12,142 $ 10,020 $ — $ 22,162
(1) Primarily related to the sale of consumer operations in Colombia in 2018.
The Company performed its annual goodwill impairment
test as of July 1, 2020, at the level below each business
segment (referred to as a reporting unit) which indicated that
the fair values of the Company’s reporting units as a
percentage of their carrying values ranged from approximately
115% to 136%, resulting in no impairment. While the inherent
risk related to uncertainty is embedded in the key assumptions
used in the valuations, the economic environment and Citi’s
outlook continues to evolve due to the challenges and
uncertainties related to the impact of the COVID-19
pandemic. Further deterioration in macroeconomic and market
conditions, including potential adverse effects to economic
forecasts due to the severity and duration of the pandemic, as
well as the responses of governments, customers and clients,
could negatively influence the assumptions used in the
valuations, in particular, the discount rates, exit multiples and
growth rates used in net income projections. If the future were
to differ from management’s estimate of key assumptions
(e.g., net interest revenue and loan volume), and associated
cash flows were to decrease, Citi could potentially experience
material goodwill impairment charges in the future.
For additional information regarding Citi’s goodwill
impairment testing process, see the following Notes to the
Consolidated Financial Statements: Note 1 for Citi’s
Accounting Policy for goodwill, including the adoption of a
new accounting standard regarding the subsequent
measurement of goodwill, and Note 3 for a description of
Citi’s Business Segments.
220
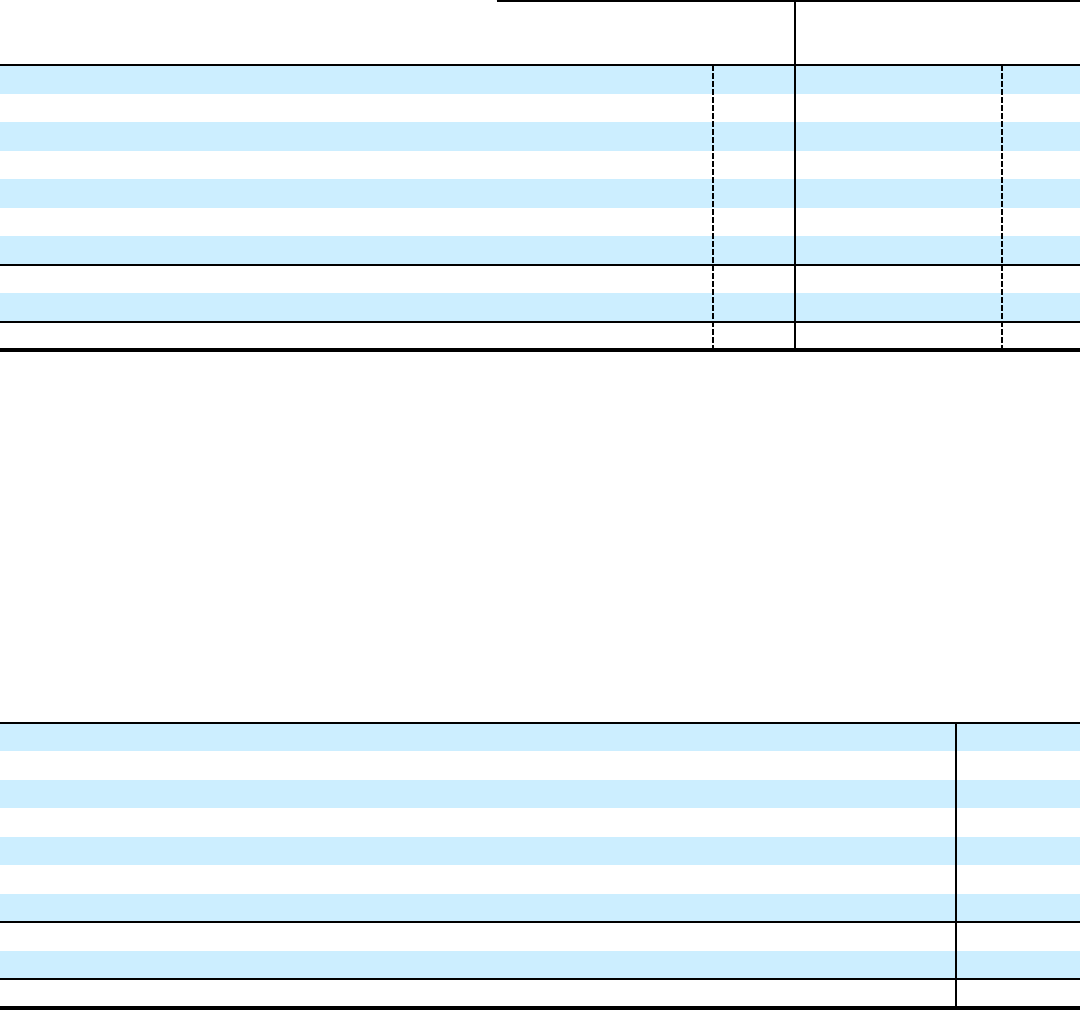
Intangible Assets
The components of intangible assets were as follows:
December 31, 2020 December 31, 2019
In millions of dollars
Gross
carrying
amount
Accumulated
amortization
Net
carrying
amount
Gross
carrying
amount
Accumulated
amortization
Net
carrying
amount
Purchased credit card relationships $ 5,648 $ 4,229 $ 1,419 $ 5,676 $ 4,059 $ 1,617
Credit card contract-related intangibles
(1)
3,929 1,276 2,653 5,393 3,069 2,324
Core deposit intangibles 45 44 1 434 433 1
Other customer relationships 455 314 141 424 275 149
Present value of future profits 32 30 2 34 31 3
Indefinite-lived intangible assets 190 — 190 228 — 228
Other 72 67 5 82 77 5
Intangible assets (excluding MSRs) $ 10,371 $ 5,960 $ 4,411 $ 12,271 $ 7,944 $ 4,327
Mortgage servicing rights (MSRs)
(2)
336 — 336 495 — 495
Total intangible assets $ 10,707 $ 5,960 $ 4,747 $ 12,766 $ 7,944 $ 4,822
(1) Primarily reflects contract-related intangibles associated with the American Airlines, The Home Depot, Costco and AT&T credit card program agreements, which
represented 96% of the aggregate net carrying amount as of December 31, 2020.
(2) For additional information on Citi’s MSRs, see Note 21 to the Consolidated Financial Statements.
Intangible assets amortization expense was $419 million,
$564 million and $557 million for 2020, 2019 and 2018,
respectively. Intangible assets amortization expense is
estimated to be $364 million in 2021, $350 million in 2022,
$351 million in 2023, $365 million in 2024 and $370 million
in 2025.
The changes in intangible assets were as follows:
Net carrying
amount at Acquisitions/
Net carrying
amount at
In millions of dollars
December 31,
2019
renewals/
divestitures Amortization Impairments
FX translation
and other
December 31,
2020
Purchased credit card relationships
(1)
$ 1,617 $ 11 $ (200) $ (10) $ 1 $ 1,419
Credit card contract-related intangibles
(2)
2,324 509 (183) — 3 2,653
Core deposit intangibles 1 — — — — 1
Other customer relationships 149 — (24) — 16 141
Present value of future profits 3 — — — (1) 2
Indefinite-lived intangible assets 228 — — (28) (10) 190
Other 5 7 (12) — 5 5
Intangible assets (excluding MSRs) $ 4,327 $ 527 $ (419) $ (38) $ 14 $ 4,411
Mortgage servicing rights (MSRs)
(3)
495 336
Total intangible assets $ 4,822 $ 4,747
(1) Reflects intangibles for the value of cardholder relationships, which are discrete from partner contract-related intangibles and include credit card accounts
primarily in the Costco, Macy’s and Sears portfolios.
(2) Primarily reflects contract-related intangibles associated with the American Airlines, The Home Depot, Costco and AT&T credit card program agreements, which
represent 96% of the aggregate net carrying amount at December 31, 2020 and 2019. During 2020, Citi renewed its contract with American Airlines.
(3) For additional information on Citi’s MSRs, including the rollforward from 2019 to 2020, see Note 21 to the Consolidated Financial Statements.
221
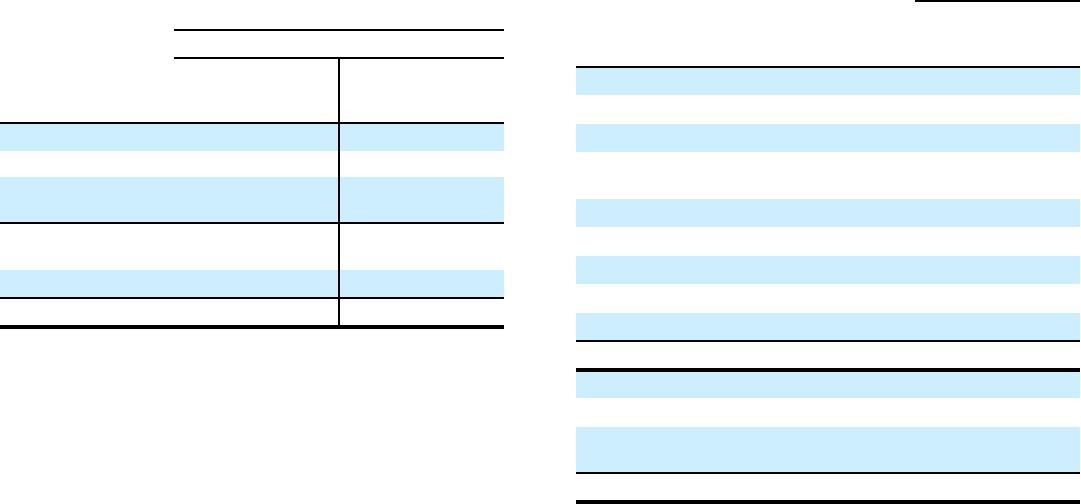
17. DEBT
Short-Term Borrowings
December 31,
2020 2019
In millions of dollars
Balance
Weighted
average
coupon Balance
Weighted
average
coupon
Commercial paper
Bank
(1)
$ 10,022 $ 10,155
Broker-dealer and
other
(2)
7,988 6,321
Total commercial
paper $ 18,010 0.77 % $ 16,476 1.98 %
Other borrowings
(3)
11,504 0.48 28,573 1.94
Total $ 29,514 $ 45,049
(1) Represents Citibank entities as well as other bank entities.
(2) Represents broker-dealer and other non-bank subsidiaries that are
consolidated into Citigroup Inc., the parent holding company.
(3) Includes borrowings from Federal Home Loan Banks and other market
participants. At December 31, 2020 and 2019, collateralized short-term
advances from Federal Home Loan Banks were $4.0 billion and $17.6
billion, respectively.
Borrowings under bank lines of credit may be at interest rates
based on LIBOR, CD rates, the prime rate or bids submitted
by the banks. Citigroup pays commitment fees for its lines of
credit.
Some of Citigroup’s non-bank subsidiaries have credit
facilities with Citigroup’s subsidiary depository institutions,
including Citibank. Borrowings under these facilities are
secured in accordance with Section 23A of the Federal
Reserve Act.
Citigroup Global Markets Holdings Inc. (CGMHI) has
borrowing agreements consisting of facilities that CGMHI has
been advised are available, but where no contractual lending
obligation exists. These arrangements are reviewed on an
ongoing basis to ensure flexibility in meeting CGMHI’s short-
term requirements.
Long-Term Debt
Balances at
December 31,
In millions of dollars
Weighted
average
coupon
(1)
Maturities 2020 2019
Citigroup Inc.
(2)
Senior debt
2.82 % 2021-2098
$ 142,197 $ 123,292
Subordinated debt
(3)
4.38 2022-2046
26,636 25,463
Trust preferred
securities
6.26 2036-2067
1,730 1,722
Bank
(4)
Senior debt
1.64 2021-2049
44,742 53,340
Broker-dealer
(5)
Senior debt
0.72 2021-2070
55,896 44,817
Subordinated debt
(3)
— 2022-2046
485 126
Total 2.66 % $ 271,686 $ 248,760
Senior debt $ 242,835 $ 221,449
Subordinated debt
(3)
27,121 25,589
Trust preferred
securities 1,730 1,722
Total $ 271,686 $ 248,760
(1) The weighted average coupon excludes structured notes accounted for at
fair value.
(2) Represents the parent holding company.
(3) Includes notes that are subordinated within certain countries, regions or
subsidiaries.
(4) Represents Citibank entities as well as other bank entities. At
December 31, 2020 and 2019, collateralized long-term advances from
Federal Home Loan Banks were $10.9 billion and $5.5 billion,
respectively.
(5) Represents broker-dealer and other non-bank subsidiaries that are
consolidated into Citigroup Inc., the parent holding company. Certain
Citigroup consolidated hedging activities are also included in this line.
The Company issues both fixed- and variable-rate debt in a
range of currencies. It uses derivative contracts, primarily
interest rate swaps, to effectively convert a portion of its fixed-
rate debt to variable-rate debt. The maturity structure of the
derivatives generally corresponds to the maturity structure of
the debt being hedged. In addition, the Company uses other
derivative contracts to manage the foreign exchange impact of
certain debt issuances. At December 31, 2020, the Company’s
overall weighted average interest rate for long-term debt,
excluding structured notes accounted for at fair value, was
2.66% on a contractual basis and 2.64% including the effects
of derivative contracts.
222

Aggregate annual maturities of long-term debt obligations (based on final maturity dates) including trust preferred securities are
as follows:
In millions of dollars
2021 2022 2023 2024 2025 Thereafter Total
Citigroup Inc. $ 15,605 $ 13,159 $ 14,805 $ 12,329 $ 13,733 $ 100,933 $ 170,564
Bank 18,577 14,608 2,685 4,588 501 3,782 44,741
Broker-dealer 9,139 8,978 8,557 4,089 4,643 20,975 56,381
Total $ 43,321 $ 36,745 $ 26,047 $ 21,006 $ 18,877 $ 125,690 $ 271,686
The following table summarizes Citi’s outstanding trust preferred securities at December 31, 2020:
Junior subordinated debentures owned by trust
Trust
Issuance
date
Securities
issued
Liquidation
value
(1)
Coupon
rate
(2)
Common
shares
issued
to parent Amount Maturity
Redeemable
by issuer
beginning
In millions of dollars, except securities and share amounts
Citigroup Capital III Dec. 1996 194,053 $ 194 7.625 % 6,003 $ 200 Dec. 1, 2036 Not redeemable
Citigroup Capital XIII Sept. 2010 89,840,000 2,246
3 mo LIBOR
+ 637 bps 1,000 2,246 Oct. 30, 2040 Oct. 30, 2015
Citigroup Capital XVIII June 2007 99,901 137
3 mo
Sterling
LIBOR +
88.75 bps 50 137 June 28, 2067 June 28, 2017
Total obligated $ 2,577 $ 2,583
Note: Distributions on the trust preferred securities and interest on the subordinated debentures are payable semiannually for Citigroup Capital III and Citigroup Capital
XVIII and quarterly for Citigroup Capital XIII.
(1) Represents the notional value received by outside investors from the trusts at the time of issuance. This differs from Citi’s balance sheet carrying value due
primarily to unamortized discount and issuance costs.
(2) In each case, the coupon rate on the subordinated debentures is the same as that on the trust preferred securities.
223
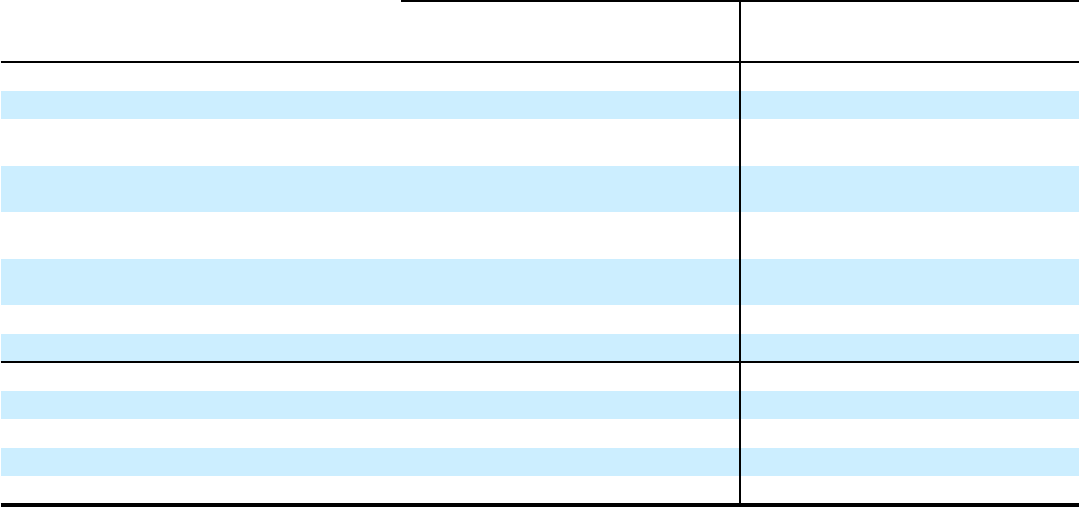
18. REGULATORY CAPITAL
Citigroup is subject to risk-based capital and leverage
standards issued by the Federal Reserve Board, which
constitute the U.S. Basel III rules. Citi’s U.S.-insured
depository institution subsidiaries, including Citibank, are
subject to similar standards issued by their respective primary
bank regulatory agencies. These standards are used to evaluate
capital adequacy and include the required minimums shown in
the following table. The regulatory agencies are required by
law to take specific, prompt corrective actions with respect to
institutions that do not meet minimum capital standards.
The following table sets forth for Citigroup and Citibank
the regulatory capital tiers, total risk-weighted assets, quarterly
adjusted average total assets, Total Leverage Exposure, risk-
based capital ratios and leverage ratios:
In millions of dollars, except ratios
Stated
minimum
Citigroup Citibank
Well-
capitalized
minimum
December 31,
2020
December 31,
2019
Well-
capitalized
minimum
December 31,
2020
December 31,
2019
Common Equity Tier 1 Capital $ 147,274 $ 137,798 $ 142,884 $ 130,720
Tier 1 Capital 167,053 155,805 144,992 132,847
Total Capital
(Tier 1 Capital + Tier 2
Capital)—Standardized Approach 204,849 193,711 169,235 157,253
Total Capital
(Tier 1 Capital + Tier 2
Capital)—Advanced Approaches 195,959 181,337 161,294 145,918
Total risk-weighted assets—Standardized
Approach 1,221,576 1,168,848 1,030,081 1,022,607
Total risk-weighted assets—Advanced
Approaches 1,255,284 1,142,804 1,012,129 938,735
Quarterly adjusted average total assets
(1)
2,265,615 1,957,039 1,680,056 1,459,780
Total Leverage Exposure
(2)
2,386,881 2,513,702 2,167,969 1,958,173
Common Equity Tier 1 Capital ratio
(3)
4.5 % N/A 11.73 % 11.79 % 6.5 % 13.87 % 12.78 %
Tier 1 Capital ratio
(3)
6.0 6.0 % 13.31 13.33 8.0 14.08 12.99
Total Capital ratio
(3)
8.0 10.0 15.61 15.87 10.0 15.94 15.38
Tier 1 Leverage ratio 4.0 N/A 7.37 7.96 5.0 8.63 9.10
Supplementary Leverage ratio 3.0 N/A 7.00 6.20 6.0 6.69 6.78
(1) Tier 1 Leverage ratio denominator.
(2) Supplementary Leverage ratio denominator.
(3) Citigroup’s reportable Common Equity Tier 1 Capital, Tier 1 Capital and Total Capital ratios as of December 31, 2020 were the lower derived under the Basel III
Advanced Approaches frameworks, whereas Citigroup’s reportable Common Equity Tier 1 Capital and Tier 1 Capital ratios were the lower derived under the
Basel III Standardized Approach and the reportable Total Capital ratio was the lower derived under the Basel III Advanced Approaches framework as of
December 31, 2019. As of December 31, 2020 and 2019, Citibank’s reportable Common Equity Tier 1 Capital and Tier 1 Capital ratios were the lower derived
under the Basel III Standardized Approach, whereas the Total Capital ratios were the lower derived under the Basel III Advanced Approaches frameworks as of
December 31, 2020 and the lower derived under the Standardized Approach as of December 31, 2019.
N/A Not applicable
As indicated in the table above, Citigroup and Citibank
were “well capitalized” under the current federal bank
regulatory agency definitions as of December 31, 2020 and
2019.
Banking Subsidiaries—Constraints on Dividends
There are various legal limitations on the ability of Citigroup’s
subsidiary depository institutions to extend credit, pay
dividends or otherwise supply funds to Citigroup and its non-
bank subsidiaries. The approval of the Office of the
Comptroller of the Currency is required if total dividends
declared in any calendar year were to exceed amounts
specified by the agency’s regulations.
In determining the dividends, each subsidiary depository
institution must also consider its effect on applicable risk-
based capital and leverage ratio requirements, as well as policy
statements of the federal bank regulatory agencies that indicate
that banking organizations should generally pay dividends out
of current operating earnings. Citigroup received $2.3 billion
and $17.3 billion in dividends from Citibank during 2020 and
2019, respectively.
224
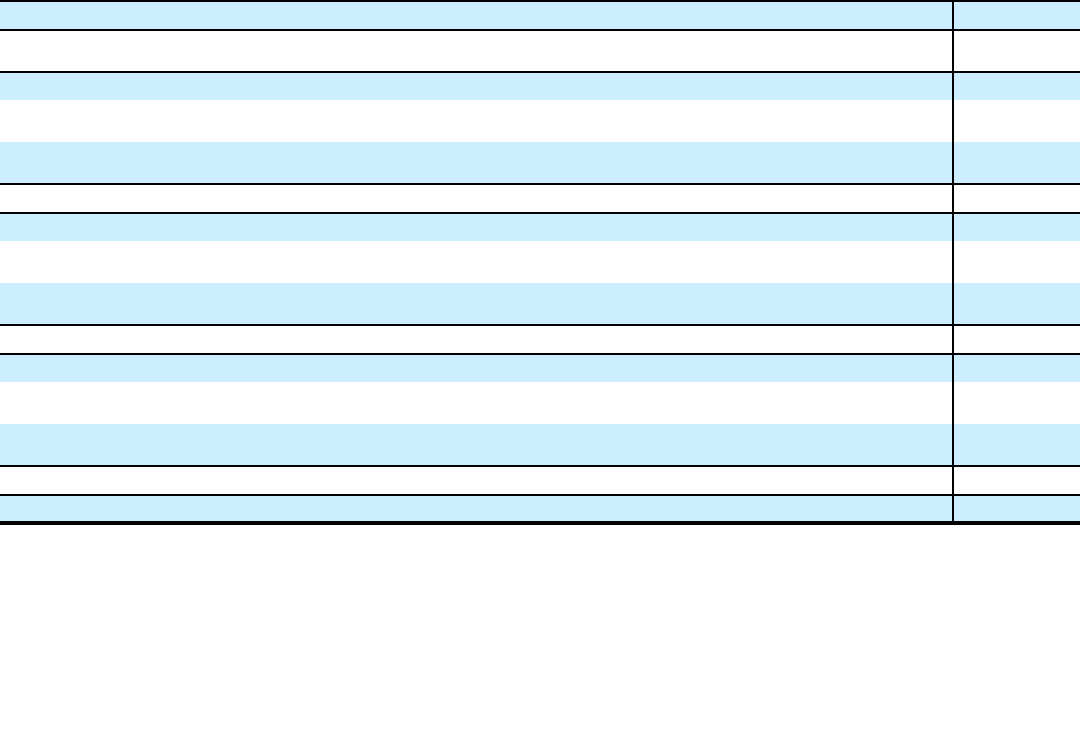
19. CHANGES IN ACCUMULATED OTHER COMPREHENSIVE INCOME (LOSS) (AOCI)
Changes in each component of Citigroup’s Accumulated other comprehensive income (loss) were as follows:
In millions of dollars
Net
unrealized
gains (losses)
on
investment
securities
Debt
valuation
adjustment
(DVA)
(1)
Cash
flow
hedges
(2)
Benefit
plans
(3)
Foreign
currency
translation
adjustment
(CTA), net
of hedges
(4)
Excluded
component
of fair
value
hedges
(5)
Accumulated
other
comprehensive
income (loss)
Balance, December 31, 2017 $ (1,158) $ (921) $ (698) $ (6,183) $ (25,708) $ — $ (34,668)
Adjustment to opening balance, net
of taxes
(6)
$ (3) $ — $ — $ — $ — $ — $ (3)
Adjusted balance, beginning of year $ (1,161) $ (921) $ (698) $ (6,183) $ (25,708) $ — $ (34,671)
Other comprehensive income before
reclassifications (866) 1,081 (135) (240) (2,607) (57) (2,824)
Increase (decrease) due to amounts
reclassified from AOCI
(7)
(223) 32 105 166 245 — 325
Change, net of taxes
$ (1,089) $ 1,113 $ (30) $ (74) $ (2,362) $ (57) $ (2,499)
Balance, December 31, 2018 $ (2,250) $ 192 $ (728) $ (6,257) $ (28,070) $ (57) $ (37,170)
Other comprehensive income before
reclassifications 3,065 (1,151) 549 (758) (321) 25 1,409
Increase (decrease) due to amounts reclassified
from AOCI (1,080) 15 302 206 — — (557)
Change, net of taxes
$ 1,985 $ (1,136) $ 851 $ (552) $ (321) $ 25 $ 852
Balance at December 31, 2019 $ (265) $ (944) $ 123 $ (6,809) $ (28,391) $ (32) $ (36,318)
Other comprehensive income before
reclassifications 4,837 (490) 2,027 (287) (250) (15) 5,822
Increase (decrease) due to amounts
reclassified from AOCI (1,252) 15 (557) 232 — — (1,562)
Change, net of taxes $ 3,585 $ (475) $ 1,470 $ (55) $ (250) $ (15) $ 4,260
Balance at December 31, 2020 $ 3,320 $ (1,419) $ 1,593 $ (6,864) $ (28,641) $ (47) $ (32,058)
(1) Changes in DVA are reflected as a component of AOCI, pursuant to the adoption of ASU 2016-01 relating to the presentation of DVA on fair value option
liabilities.
(2) Primarily driven by Citi’s pay fixed/receive floating interest rate swap programs that hedge the floating rates on liabilities.
(3) Primarily reflects adjustments based on the quarterly actuarial valuations of the Company’s significant pension and postretirement plans, annual actuarial
valuations of all other plans and amortization of amounts previously recognized in other comprehensive income.
(4) Primarily reflects the movements in (by order of impact) the Mexican peso, Brazilian real, South Korean won and Euro against the U.S. dollar and changes in
related tax effects and hedges for the year ended December 31, 2020. Primarily reflects the movements in (by order of impact) the Indian rupee, Brazilian real,
Chilean peso and Euro against the U.S. dollar and changes in related tax effects and hedges for the year ended December 31, 2019. Primarily reflects the
movements in (by order of impact) the Brazilian real, Indian rupee, Mexican peso and Australian dollar against the U.S. dollar and changes in related tax effects
and hedges for the year ended December 31, 2018. Amounts recorded in the CTA component of AOCI remain in AOCI until the sale or substantial liquidation of
the foreign entity, at which point such amounts related to the foreign entity are reclassified into earnings.
(5) Beginning in the first quarter of 2018, changes in the excluded component of fair value hedges are reflected as a component of AOCI, pursuant to the early
adoption of ASU 2017-12, Targeted Improvements to Accounting for Hedging Activities. See Note 1 of the Consolidated Financial Statements for further
information regarding this change.
(6) Citi adopted ASU 2016-01 and ASU 2018-03 on January 1, 2018. Upon adoption, a cumulative effect adjustment was recorded from AOCI to Retained earnings
for net unrealized gains on former AFS equity securities. For additional information, see Note 1 to the Consolidated Financial Statements.
(7) Includes the impact of the release of foreign currency translation adjustment, net of hedges, upon meeting the accounting trigger for substantial liquidation of
Citi’s Japan Consumer Finance business during the fourth quarter of 2018. See Note 1 to the Consolidated Financial Statements.
225

The pretax and after-tax changes in each component of Accumulated other comprehensive income (loss) were as follows:
In millions of dollars
Pretax Tax effect
(1)
After-tax
Balance, December 31, 2017 $ (41,228) $ 6,560 $ (34,668)
Adjustment to opening balance
(2)
(4) 1 (3)
Adjusted balance, beginning of year $ (41,232) $ 6,561 $ (34,671)
Change in net unrealized gains (losses) on investment securities (1,435) 346 (1,089)
Debt valuation adjustment (DVA) 1,415 (302) 1,113
Cash flow hedges (38) 8 (30)
Benefit plans (94) 20 (74)
Foreign currency translation adjustment (2,624) 262 (2,362)
Excluded component of fair value hedges (74) 17 (57)
Change $ (2,850) $ 351 $ (2,499)
Balance, December 31, 2018 $ (44,082) $ 6,912 $ (37,170)
Change in net unrealized gains (losses) on investment securities 2,633 (648) 1,985
Debt valuation adjustment (DVA) (1,473) 337 (1,136)
Cash flow hedges 1,120 (269) 851
Benefit plans (671) 119 (552)
Foreign currency translation adjustment (332) 11 (321)
Excluded component of fair value hedges 33 (8) 25
Change $ 1,310 $ (458) $ 852
Balance, December 31, 2019 $ (42,772) $ 6,454 $ (36,318)
Change in net unrealized gains (losses) on AFS debt securities 4,799 (1,214) 3,585
Debt valuation adjustment (DVA) (616) 141 (475)
Cash flow hedges 1,925 (455) 1,470
Benefit plans (78) 23 (55)
Foreign currency translation adjustment (227) (23) (250)
Excluded component of fair value hedges (23) 8 (15)
Change $ 5,780 $ (1,520) $ 4,260
Balance, December 31, 2020 $ (36,992) $ 4,934 $ (32,058)
(1) Includes the impact of ASU 2018-02, which transferred amounts from AOCI to Retained earnings. See Note 1 to the Consolidated Financial Statements.
(2) Citi adopted ASU 2016-01 and ASU 2018-03 on January 1, 2018. Upon adoption, a cumulative effect adjustment was recorded from AOCI to Retained earnings
for net unrealized gains on former AFS equity securities. For additional information, see Note 1 to the Consolidated Financial Statements.
226
The Company recognized pretax (gains) losses related to amounts in AOCI reclassified to the Consolidated Statement of Income as
follows:
Increase (decrease) in AOCI due to amounts reclassified to
Consolidated Statement of Income
Year ended December 31,
In millions of dollars
2020 2019 2018
Realized (gains) losses on sales of investments $ (1,756) $ (1,474) $ (421)
Gross impairment losses 109 23 125
Subtotal, pretax $ (1,647) $ (1,451) $ (296)
Tax effect 395 371 73
Net realized (gains) losses on investments, after-tax
(1)
$ (1,252) $ (1,080) $ (223)
Realized DVA (gains) losses on fair value option liabilities, pretax $ 20 $ 20 $ 41
Tax effect (5) (5) (9)
Net realized DVA, after-tax $ 15 $ 15 $ 32
Interest rate contracts $ (734) $ 384 $ 301
Foreign exchange contracts 4 7 17
Subtotal, pretax $ (730) $ 391 $ 318
Tax effect 173 (89) (213)
Amortization of cash flow hedges, after-tax
(2)
$ (557) $ 302 $ 105
Amortization of unrecognized:
Prior service cost (benefit) $ (5) $ (12) $ (34)
Net actuarial loss 322 286 248
Curtailment/settlement impact
(3)
(8) 1 6
Subtotal, pretax $ 309 $ 275 $ 220
Tax effect (77) (69) (54)
Amortization of benefit plans, after-tax
(3)
$ 232 $ 206 $ 166
Excluded component of fair value hedges, pretax $ — $ — $ —
Tax effect — — —
Excluded component of fair value hedges, after-tax $ — $ — $ —
Foreign currency translation adjustment, pretax $ — $ — $ 34
Tax effect — — 211
Foreign currency translation adjustment, after-tax $ — $ — $ 245
Total amounts reclassified out of AOCI, pretax $ (2,048) $ (765) $ 317
Total tax effect 486 208 8
Total amounts reclassified out of AOCI, after-tax $ (1,562) $ (557) $ 325
(1) The pretax amount is reclassified to Realized gains (losses) on sales of investments, net and Gross impairment losses in the Consolidated Statement of Income. See
Note 13 to the Consolidated Financial Statements for additional details.
(2) See Note 22 to the Consolidated Financial Statements for additional details.
(3) See Note 8 to the Consolidated Financial Statements for additional details.
227
20. PREFERRED STOCK
The following table summarizes the Company’s preferred stock outstanding:
Redemption
price per
depositary
share/
preference
share
Carrying value
in millions of dollars
Issuance date
Redeemable by issuer
beginning
Dividend
rate
Number
of
depositary
shares
December 31,
2020
December 31,
2019
Series A
(1)
October 29, 2012 January 30, 2023 5.950 % $ 1,000 1,500,000 $ 1,500 $ 1,500
Series B
(2)
December 13, 2012 February 15, 2023 5.900 1,000 750,000 750 750
Series D
(3)
April 30, 2013 May 15, 2023 5.350 1,000 1,250,000 1,250 1,250
Series J
(4)
September 19, 2013 September 30, 2023 7.125 25 38,000,000 950 950
Series K
(5)
October 31, 2013 November 15, 2023 6.875 25 59,800,000 1,495 1,495
Series M
(6)
April 30, 2014 May 15, 2024 6.300 1,000 1,750,000 1,750 1,750
Series O
(7)
March 20, 2015 March 27, 2020 5.875 1,000 1,500,000 — 1,500
Series P
(8)
April 24, 2015 May 15, 2025 5.950 1,000 2,000,000 2,000 2,000
Series Q
(9)
August 12, 2015 August 15, 2020 4.316 1,000 1,250,000 1,250 1,250
Series R
(10)
November 13, 2015 November 15, 2020 4.699 1,000 1,500,000 1,500 1,500
Series S
(11)
February 2, 2016 February 12, 2021 6.300 25 41,400,000 1,035 1,035
Series T
(12)
April 25, 2016 August 15, 2026 6.250 1,000 1,500,000 1,500 1,500
Series U
(13)
September 12, 2019 September 12, 2024 5.000 1,000 1,500,000 1,500 1,500
Series V
(14)
January 23, 2020 January 30, 2025 4.700 1,000 1,500,000 1,500 —
Series W
(15)
December 10, 2020 December 10, 2025 4.000 1,000 1,500,000 1,500 —
$ 19,480 $ 17,980
(1) Issued as depositary shares, each representing a 1/25
th
interest in a share of the corresponding series of non-cumulative perpetual preferred stock. Dividends are
payable semiannually on January 30 and July 30 at a fixed rate until, but excluding, January 30, 2023, thereafter payable quarterly on January 30, April 30, July 30
and October 30 at a floating rate, in each case when, as and if declared by the Citi Board of Directors.
(2) Issued as depositary shares, each representing a 1/25
th
interest in a share of the corresponding series of non-cumulative perpetual preferred stock. Dividends are
payable semiannually on February 15 and August 15 at a fixed rate until, but excluding, February 15, 2023, thereafter payable quarterly on February 15, May 15,
August 15 and November 15 at a floating rate, in each case when, as and if declared by the Citi Board of Directors.
(3) Issued as depositary shares, each representing a 1/25
th
interest in a share of the corresponding series of non-cumulative perpetual preferred stock. Dividends are
payable semiannually on May 15 and November 15 at a fixed rate until, but excluding, May 15, 2023, thereafter payable quarterly on February 15, May 15,
August 15 and November 15 at a floating rate, in each case when, as and if declared by the Citi Board of Directors.
(4) Issued as depositary shares, each representing a 1/1,000
th
interest in a share of the corresponding series of non-cumulative perpetual preferred stock. Dividends are
payable quarterly on March 30, June 30, September 30 and December 30 at a fixed rate until, but excluding, September 30, 2023, thereafter payable quarterly on
the same dates at a floating rate, in each case when, as and if declared by the Citi Board of Directors.
(5) Issued as depositary shares, each representing a 1/1,000
th
interest in a share of the corresponding series of non-cumulative perpetual preferred stock. Dividends are
payable quarterly on February 15, May 15, August 15 and November 15 at a fixed rate until, but excluding, November 15, 2023, thereafter payable quarterly on
the same dates at a floating rate, in each case when, as and if declared by the Citi Board of Directors.
(6) Issued as depositary shares, each representing a 1/25
th
interest in a share of the corresponding series of non-cumulative perpetual preferred stock. Dividends are
payable semiannually on May 15 and November 15 at a fixed rate until, but excluding, May 15, 2024, thereafter payable quarterly on February 15, May 15,
August 15 and November 15 at a floating rate, in each case when, as and if declared by the Citi Board of Directors.
(7) The Series O preferred stock was redeemed in full on March 27, 2020.
(8) Issued as depositary shares, each representing a 1/25
th
interest in a share of the corresponding series of non-cumulative perpetual preferred stock. Dividends are
payable semiannually on May 15 and November 15 at a fixed rate until, but excluding, May 15, 2025, and thereafter payable quarterly on February 15, May 15,
August 15 and November 15 at a floating rate, in each case when, as and if declared by the Citi Board of Directors.
(9) Issued as depositary shares, each representing a 1/25
th
interest in a share of the corresponding series of non-cumulative perpetual preferred stock. Dividends are
payable semiannually on February 15 and August 15 at a fixed rate until, but excluding, August 15, 2020, and thereafter payable quarterly on February 15, May
15, August 15 and November 15 at a floating rate, in each case when, as and if declared by the Citi Board of Directors.
(10) Issued as depositary shares, each representing a 1/25
th
interest in a share of the corresponding series of non-cumulative perpetual preferred stock. Dividends are
payable semiannually on May 15 and November 15 at a fixed rate until November 15, 2020, thereafter payable quarterly on February 15, May 15, August 15 and
November 15 at a floating rate, in each case when, as and if declared by the Citi Board of Directors.
(11) Issued as depositary shares, each representing a 1/1,000
th
interest in a share of the corresponding series of non-cumulative perpetual preferred stock. Dividends are
payable quarterly on February 12, May 12, August 12 and November 12 at a fixed rate, in each case when, as and if declared by the Citi Board of Directors.
(12) Issued as depositary shares, each representing a 1/25
th
interest in a share of the corresponding series of non-cumulative perpetual preferred stock. Dividends are
payable semiannually on February 15 and August 15 at a fixed rate until, but excluding, August 15, 2026, thereafter payable quarterly on February 15, May 15,
August 15 and November 15 at a floating rate, in each case when, as and if declared by the Citi Board of Directors.
(13) Issued as depositary shares, each representing a 1/25
th
interest in a share of the corresponding series of non-cumulative perpetual preferred stock. Dividends are
payable semiannually on March 12 and September 12 at a fixed rate until, but excluding, September 12, 2024, thereafter payable quarterly on March 12, June 12,
September 12 and December 12 at a floating rate, in each case when, as and if declared by the Citi Board of Directors.
(14) Issued as depositary shares, each representing a 1/25
th
interest in a share of the corresponding series of non-cumulative perpetual preferred stock. Dividends are
payable semiannually on January 30 and July 30 at a fixed rate until, but excluding, January 30, 2025, thereafter payable quarterly on January 30, April 30, July 30
and October 30 at a floating rate, in each case when, as and if declared by the Citi Board of Directors.
228
(15) Issued as depositary shares, each representing a 1/25
th
interest in a share of the corresponding series of non-cumulative perpetual preferred stock. Dividends are
payable quarterly on March 10, June 10, September 10 and December 10 at a fixed rate until, but excluding, December 10, 2025, thereafter payable quarterly on
the same dates at a floating rate, in each case when, as and if declared by the Citi Board of Directors.
During 2020, Citi distributed $1,095 million in dividends
on its outstanding preferred stock. On January 21, 2021, Citi
declared preferred dividends of approximately $292 million
for the first quarter of 2021.
During the first quarter of 2021, Citi issued $2.3 billion of
Series X preferred shares. In addition, Citi redeemed all of its
Series S preferred shares for $1.035 billion, and $465 million
of its Series R preferred shares. As of February 26, 2021, Citi
estimates it will distribute preferred dividends of
approximately $254 million, $293 million and $254 million in
the second, third and fourth quarters of 2021, respectively,
subject to such dividends being declared by the Citi Board of
Directors.
229
21. SECURITIZATIONS AND VARIABLE INTEREST
ENTITIES
Uses of Special Purpose Entities
A special purpose entity (SPE) is an entity designed to fulfill a
specific limited need of the company that organized it. The
principal uses of SPEs by Citi are to obtain liquidity and
favorable capital treatment by securitizing certain financial
assets, to assist clients in securitizing their financial assets and
to create investment products for clients. SPEs may be
organized in various legal forms, including trusts, partnerships
or corporations. In a securitization, through the SPE’s issuance
of debt and equity instruments, certificates, commercial paper
or other notes of indebtedness, the company transferring assets
to the SPE converts all (or a portion) of those assets into cash
before they would have been realized in the normal course of
business. These issuances are recorded on the balance sheet of
the SPE, which may or may not be consolidated onto the
balance sheet of the company that organized the SPE.
Investors usually have recourse only to the assets in the
SPE, but may also benefit from other credit enhancements,
such as a collateral account, a line of credit or a liquidity
facility, such as a liquidity put option or asset purchase
agreement. Because of these enhancements, the SPE issuances
typically obtain a more favorable credit rating than the
transferor could obtain for its own debt issuances. This results
in less expensive financing costs than unsecured debt. The
SPE may also enter into derivative contracts in order to
convert the yield or currency of the underlying assets to match
the needs of the SPE investors or to limit or change the credit
risk of the SPE. Citigroup may be the provider of certain credit
enhancements as well as the counterparty to any related
derivative contracts.
Most of Citigroup’s SPEs are variable interest entities
(VIEs), as described below.
Variable Interest Entities
VIEs are entities that have either a total equity investment that
is insufficient to permit the entity to finance its activities
without additional subordinated financial support or whose
equity investors lack the characteristics of a controlling
financial interest (i.e., ability to make significant decisions
through voting rights or similar rights and a right to receive
the expected residual returns of the entity or an obligation to
absorb the expected losses of the entity). Investors that finance
the VIE through debt or equity interests or other counterparties
providing other forms of support, such as guarantees, certain
fee arrangements or certain types of derivative contracts, are
variable interest holders in the entity.
The variable interest holder, if any, that has a controlling
financial interest in a VIE is deemed to be the primary
beneficiary and must consolidate the VIE. Citigroup would be
deemed to have a controlling financial interest and be the
primary beneficiary if it has both of the following
characteristics:
• power to direct the activities of the VIE that most
significantly impact the entity’s economic performance;
and
• an obligation to absorb losses of the entity that could
potentially be significant to the VIE, or a right to receive
benefits from the entity that could potentially be
significant to the VIE.
The Company must evaluate each VIE to understand the
purpose and design of the entity, the role the Company had in
the entity’s design and its involvement in the VIE’s ongoing
activities. The Company then must evaluate which activities
most significantly impact the economic performance of the
VIE and who has the power to direct such activities.
For those VIEs where the Company determines that it has
the power to direct the activities that most significantly impact
the VIE’s economic performance, the Company must then
evaluate its economic interests, if any, and determine whether
it could absorb losses or receive benefits that could potentially
be significant to the VIE. When evaluating whether the
Company has an obligation to absorb losses that could
potentially be significant, it considers the maximum exposure
to such loss without consideration of probability. Such
obligations could be in various forms, including, but not
limited to, debt and equity investments, guarantees, liquidity
agreements and certain derivative contracts.
In various other transactions, the Company may (i) act as
a derivative counterparty (for example, interest rate swap,
cross-currency swap or purchaser of credit protection under a
credit default swap or total return swap where the Company
pays the total return on certain assets to the SPE), (ii) act as
underwriter or placement agent, (iii) provide administrative,
trustee or other services or (iv) make a market in debt
securities or other instruments issued by VIEs. The Company
generally considers such involvement, by itself, not to be
variable interests and thus not an indicator of power or
potentially significant benefits or losses.
230
Citigroup’s involvement with consolidated and unconsolidated VIEs with which the Company holds significant variable interests
or has continuing involvement through servicing a majority of the assets in a VIE is presented below:
As of December 31, 2020
Maximum exposure to loss in significant unconsolidated VIEs
(1)
Funded exposures
(2)
Unfunded exposures
In millions of dollars
Total
involvement
with SPE
assets
Consolidated
VIE/SPE
assets
Significant
unconsolidated
VIE assets
(3)
Debt
investments
Equity
investments
Funding
commitments
Guarantees
and
derivatives Total
Credit card securitizations $ 32,420 $ 32,420 $ — $ — $ — $ — $ — $ —
Mortgage securitizations
(4)
U.S. agency-sponsored 123,999 — 123,999 1,948 — — 61 2,009
Non-agency-sponsored 46,132 939 45,193 2,550 — 2 1 2,553
Citi-administered asset-
backed commercial paper
conduits 16,730 16,730 — — — — — —
Collateralized loan
obligations (CLOs) 18,332 — 18,332 4,273 — — — 4,273
Asset-based financing
(5)
222,274 8,069 214,205 25,153 1,587 9,114 — 35,854
Municipal securities tender
option bond trusts (TOBs) 3,349 835 2,514 — — 1,611 — 1,611
Municipal investments 20,335 — 20,335 2,569 4,056 3,041 — 9,666
Client intermediation 1,352 910 442 88 — — 56 144
Investment funds 488 153 335 — — 15 — 15
Other — — — — — — — —
Total $ 485,411 $ 60,056 $ 425,355 $ 36,581 $ 5,643 $ 13,783 $ 118 $ 56,125
As of December 31, 2019
Maximum exposure to loss in significant unconsolidated VIEs
(1)
Funded exposures
(2)
Unfunded exposures
In millions of dollars
Total
involvement
with SPE
assets
Consolidated
VIE/SPE
assets
Significant
unconsolidated
VIE assets
(3)
Debt
investments
Equity
investments
Funding
commitments
Guarantees
and
derivatives Total
Credit card securitizations $ 43,534 $ 43,534 $ — $ — $ — $ — $ — $ —
Mortgage securitizations
(4)
U.S. agency-sponsored 117,374 — 117,374 2,671 — — 72 2,743
Non-agency-sponsored 39,608 1,187 38,421 876 — — 1 877
Citi-administered asset-
backed commercial paper
conduits 15,622 15,622 — — — — — —
Collateralized loan
obligations (CLOs) 17,395 — 17,395 4,199 — — — 4,199
Asset-based financing
(5)
196,728 6,139 190,589 23,756 1,151 9,524 — 34,431
Municipal securities tender
option bond trusts (TOBs) 6,950 1,458 5,492 4 — 3,544 — 3,548
Municipal investments 20,312 — 20,312 2,636 4,274 3,034 — 9,944
Client intermediation 1,455 1,391 64 4 — — — 4
Investment funds 827 174 653 5 — 16 1 22
Other 352 1 351 169 — 39 — 208
Total $ 460,157 $ 69,506 $ 390,651 $ 34,320 $ 5,425 $ 16,157 $ 74 $ 55,976
(1) The definition of maximum exposure to loss is included in the text that follows this table.
(2) Included on Citigroup’s December 31, 2020 and 2019 Consolidated Balance Sheet.
(3) A significant unconsolidated VIE is an entity in which the Company has any variable interest or continuing involvement considered to be significant, regardless of
the likelihood of loss.
(4) Citigroup mortgage securitizations also include agency and non-agency (private label) re-securitization activities. These SPEs are not consolidated. See “Re-
securitizations” below for further discussion.
(5) Included within this line are loans to third-party sponsored private equity funds, which represent $78 billion and $69 billion in unconsolidated VIE assets and
$425 million and $711 million in maximum exposure to loss as of December 31, 2020 and 2019, respectively.
231
The previous tables do not include:
• certain venture capital investments made by some of the
Company’s private equity subsidiaries, as the Company
accounts for these investments in accordance with the
Investment Company Audit Guide (codified in ASC 946);
• certain investment funds for which the Company provides
investment management services and personal estate
trusts for which the Company provides administrative,
trustee and/or investment management services;
• certain third-party sponsored private equity funds to
which the Company provides secured credit facilities. The
Company has no decision-making power and does not
consolidate these funds, some of which may meet the
definition of a VIE. The Company’s maximum exposure
to loss is generally limited to a loan or lending-related
commitment. As of December 31, 2020 and 2019, the
Company’s maximum exposure to loss related to these
deals was $57 billion and $52.5 billion, respectively (for
more information on these positions, see Notes 14 and 26
to the Consolidated Financial Statements);
• certain VIEs structured by third parties in which the
Company holds securities in inventory, as these
investments are made on arm’s-length terms;
• certain positions in mortgage- and asset-backed securities
held by the Company, which are classified as Trading
account assets or Investments, in which the Company has
no other involvement with the related securitization entity
deemed to be significant (for more information on these
positions, see Notes 13 and 24 to the Consolidated
Financial Statements);
• certain representations and warranties exposures in legacy
ICG-sponsored mortgage- and asset-backed
securitizations in which the Company has no variable
interest or continuing involvement as servicer. The
outstanding balance of mortgage loans securitized during
2005 to 2008 in which the Company has no variable
interest or continuing involvement as servicer was
approximately $5.22 billion and $6 billion at
December 31, 2020 and 2019, respectively;
• certain representations and warranties exposures in
Citigroup residential mortgage securitizations in which
the original mortgage loan balances are no longer
outstanding; and
• VIEs such as trust preferred securities trusts used in
connection with the Company’s funding activities. The
Company does not have a variable interest in these trusts.
The asset balances for consolidated VIEs represent the
carrying amounts of the assets consolidated by the Company.
The carrying amount may represent the amortized cost or the
current fair value of the assets depending on the legal form of
the asset (e.g., loan or security) and the Company’s standard
accounting policies for the asset type and line of business.
The asset balances for unconsolidated VIEs in which the
Company has significant involvement represent the most
current information available to the Company. In most cases,
the asset balances represent an amortized cost basis without
regard to impairments, unless fair value information is readily
available to the Company.
The maximum funded exposure represents the balance
sheet carrying amount of the Company’s investment in the
VIE. It reflects the initial amount of cash invested in the VIE,
adjusted for any accrued interest and cash principal payments
received. The carrying amount may also be adjusted for
increases or declines in fair value or any impairment in value
recognized in earnings. The maximum exposure of unfunded
positions represents the remaining undrawn committed
amount, including liquidity and credit facilities provided by
the Company or the notional amount of a derivative
instrument considered to be a variable interest. In certain
transactions, the Company has entered into derivative
instruments or other arrangements that are not considered
variable interests in the VIE (e.g., interest rate swaps, cross-
currency swaps or where the Company is the purchaser of
credit protection under a credit default swap or total return
swap where the Company pays the total return on certain
assets to the SPE). Receivables under such arrangements are
not included in the maximum exposure amounts.
232

Funding Commitments for Significant Unconsolidated VIEs—Liquidity Facilities and Loan Commitments
The following table presents the notional amount of liquidity facilities and loan commitments that are classified as funding
commitments in the VIE tables above:
December 31, 2020 December 31, 2019
In millions of dollars
Liquidity
facilities
Loan/equity
commitments
Liquidity
facilities
Loan/equity
commitments
Non-agency-sponsored mortgage securitizations $ — $ 2 $ — $ —
Asset-based financing — 9,114 — 9,524
Municipal securities tender option bond trusts (TOBs) 1,611 — 3,544 —
Municipal investments — 3,041 — 3,034
Investment funds — 15 — 16
Other — — — 39
Total funding commitments $ 1,611 $ 12,172 $ 3,544 $ 12,613
Consolidated VIEs
The Company engages in on-balance sheet securitizations,
which are securitizations that do not qualify for sales
treatment; thus, the assets remain on Citi’s Consolidated
Balance Sheet, and any proceeds received are recognized as
secured liabilities. The consolidated VIEs represent more than
a hundred separate entities with which the Company is
involved. In general, the third-party investors in the
obligations of consolidated VIEs have legal recourse only to
the assets of the respective VIEs and do not have such
recourse to the Company, except where Citi has provided a
guarantee to the investors or is the counterparty to certain
derivative transactions involving the VIE. Thus, Citigroup’s
maximum legal exposure to loss related to consolidated VIEs
is significantly less than the carrying value of the consolidated
VIE assets due to outstanding third-party financing.
Intercompany assets and liabilities are excluded from Citi’s
Consolidated Balance Sheet. All VIE assets are restricted from
being sold or pledged as collateral. The cash flows from these
assets are the only source used to pay down the associated
liabilities, which are non-recourse to Citi’s general assets. See
the Consolidated Balance Sheet for more information about
these Consolidated VIE assets and liabilities.
Significant Interests in Unconsolidated VIEs—Balance Sheet Classification
The following table presents the carrying amounts and classification of significant variable interests in unconsolidated VIEs:
In billions of dollars
December 31,
2020
December 31,
2019
Cash $ — $ —
Trading account assets 2.0 2.6
Investments 10.6 9.9
Total loans, net of allowance 29.3 26.7
Other 0.3 0.5
Total assets $ 42.2 $ 39.7
233

Credit Card Securitizations
The Company securitizes credit card receivables through trusts
established to purchase the receivables. Citigroup transfers
receivables into the trusts on a non-recourse basis. Credit card
securitizations are revolving securitizations: as customers pay
their credit card balances, the cash proceeds are used to
purchase new receivables and replenish the receivables in the
trust.
Substantially all of the Company’s credit card
securitization activity is through two trusts—Citibank Credit
Card Master Trust (Master Trust) and Citibank Omni Master
Trust (Omni Trust), with the substantial majority through the
Master Trust. These trusts are consolidated entities because, as
servicer, Citigroup has the power to direct the activities that
most significantly impact the economic performance of the
trusts. Citigroup holds a seller’s interest and certain securities
issued by the trusts, which could result in exposure to
potentially significant losses or benefits from the trusts.
Accordingly, the transferred credit card receivables remain on
Citi’s Consolidated Balance Sheet with no gain or loss
recognized. The debt issued by the trusts to third parties is
included on Citi’s Consolidated Balance Sheet.
Citi utilizes securitizations as one of the sources of
funding for its business in North America. The following table
reflects amounts related to the Company’s securitized credit
card receivables:
In billions of dollars
December 31,
2020
December 31,
2019
Ownership interests in principal amount of trust credit card receivables
Sold to investors via trust-issued securities $ 15.7 $ 19.7
Retained by Citigroup as trust-issued securities 7.9 6.2
Retained by Citigroup via non-certificated interests 11.1 17.8
Total $ 34.7 $ 43.7
The following table summarizes selected cash flow
information related to Citigroup’s credit card securitizations:
In billions of dollars
2020 2019 2018
Proceeds from new securitizations $ 0.3 $ — $ 6.8
Pay down of maturing notes (4.3) (7.6) (8.3)
Managed Loans
After securitization of credit card receivables, the Company
continues to maintain credit card customer account
relationships and provides servicing for receivables transferred
to the trusts. As a result, the Company considers the
securitized credit card receivables to be part of the business it
manages. As Citigroup consolidates the credit card trusts, all
managed securitized card receivables are on-balance sheet.
Funding, Liquidity Facilities and Subordinated Interests
As noted above, Citigroup securitizes credit card receivables
through two securitization trusts—Master Trust and Omni
Trust. The liabilities of the trusts are included on the
Consolidated Balance Sheet, excluding those retained by
Citigroup.
Master Trust Liabilities (at Par Value)
The Master Trust issues fixed- and floating-rate term notes.
Some of the term notes may be issued to multi-seller
commercial paper conduits. The weighted average maturity of
the third-party term notes issued by the Master Trust was 2.9
years as of December 31, 2020 and 3.1 years as of
December 31, 2019.
In billions of dollars
Dec. 31,
2020
Dec. 31,
2019
Term notes issued to third parties $ 13.9 $ 18.2
Term notes retained by Citigroup
affiliates 2.7 4.3
Total Master Trust liabilities $ 16.6 $ 22.5
Omni Trust Liabilities (at Par Value)
The Omni Trust issues fixed- and floating-rate term notes,
some of which are purchased by multi-seller commercial paper
conduits. The weighted average maturity of the third-party
term notes issued by the Omni Trust was 1.1 years as of
December 31, 2020 and 1.6 years as of December 31, 2019.
In billions of dollars
Dec. 31,
2020
Dec. 31,
2019
Term notes issued to third parties $ 1.8 $ 1.5
Term notes retained by Citigroup
affiliates 5.2 1.9
Total Omni Trust liabilities $ 7.0 $ 3.4
234
Mortgage Securitizations
Citigroup provides a wide range of mortgage loan products to
a diverse customer base. Once originated, the Company often
securitizes these loans through the use of VIEs. These VIEs
are funded through the issuance of trust certificates backed
solely by the transferred assets. These certificates have the
same life as the transferred assets. In addition to providing a
source of liquidity and less expensive funding, securitizing
these assets also reduces Citi’s credit exposure to the
borrowers. These mortgage loan securitizations are primarily
non-recourse, thereby effectively transferring the risk of future
credit losses to the purchasers of the securities issued by the
trust.
Citi’s U.S. consumer mortgage business generally retains
the servicing rights and in certain instances retains investment
securities, interest-only strips and residual interests in future
cash flows from the trusts and also provides servicing for a
limited number of ICG securitizations. Citi’s ICG business
may hold investment securities pursuant to credit risk retention
rules or in connection with secondary market-making
activities.
The Company securitizes mortgage loans generally
through either a U.S. government-sponsored agency, such as
Ginnie Mae, Fannie Mae or Freddie Mac (U.S. agency-
sponsored mortgages), or private label (non-agency-sponsored
mortgages) securitization. Citi is not the primary beneficiary
of its U.S. agency-sponsored mortgage securitization entities
because Citigroup does not have the power to direct the
activities of the VIEs that most significantly impact the
entities’ economic performance. Therefore, Citi does not
consolidate these U.S. agency-sponsored mortgage
securitization entities. Substantially all of the consumer loans
sold or securitized through non-consolidated trusts by
Citigroup are U.S. prime residential mortgage loans. Retained
interests in non-consolidated agency-sponsored mortgage
securitization trusts are classified as Trading account assets,
except for MSRs, which are included in Other assets on
Citigroup’s Consolidated Balance Sheet.
Citigroup does not consolidate certain non-agency-
sponsored mortgage securitization entities because Citi is
either not the servicer with the power to direct the significant
activities of the entity or Citi is the servicer, but the servicing
relationship is deemed to be a fiduciary relationship; therefore,
Citi is not deemed to be the primary beneficiary of the entity.
In certain instances, the Company has (i) the power to
direct the activities and (ii) the obligation to either absorb
losses or the right to receive benefits that could be potentially
significant to its non-agency-sponsored mortgage
securitization entities and, therefore, is the primary beneficiary
and, thus, consolidates the VIE.
The following tables summarize selected cash flow information and retained interests related to Citigroup mortgage
securitizations:
2020 2019 2018
In billions of dollars
U.S. agency-
sponsored
mortgages
Non-agency-
sponsored
mortgages
U.S. agency-
sponsored
mortgages
Non-agency-
sponsored
mortgages
U.S. agency-
sponsored
mortgages
Non-agency-
sponsored
mortgages
Principal securitized $ 9.4 $ 11.3 $ 5.3 $ 15.6 $ 4.0 $ 5.6
Proceeds from new securitizations
(1)
10.0 11.4 5.5 15.5 4.2 7.1
Contractual servicing fees received 0.1 — 0.1 — 0.1 —
Purchases of previously transferred financial assets 0.4 — 0.2 — 0.2 —
Note: Excludes re-securitization transactions.
(1) The proceeds from new securitizations in 2019 include $0.2 billion related to personal loan securitizations.
For non-consolidated mortgage securitization entities
where the transfer of loans to the VIE meets the conditions for
sale accounting, Citi recognizes a gain or loss based on the
difference between the carrying value of the transferred assets
and the proceeds received (generally cash but may be
beneficial interests or servicing rights).
Agency and non-agency securitization gains for the year
ended December 31, 2020 were $88.4 million and $139.4
million, respectively.
Agency and non-agency securitization gains for the year
ended December 31, 2019 were $16 million and $73.4 million,
respectively, and $17 million and $36 million, respectively,
for the year ended December 31, 2018.
2020 2019
Non-agency-sponsored
mortgages
(1)
Non-agency-sponsored
mortgages
(1)
In millions of dollars
U.S. agency-
sponsored
mortgages
Senior
interests
(2)
Subordinated
interests
U.S. agency-
sponsored
mortgages
Senior
interests
Subordinated
interests
Carrying value of retained interests
(3)
$ 315 $ 1,210 $ 145 $ 491 $ 748 $ 102
(1) Disclosure of non-agency-sponsored mortgages as senior and subordinated interests is indicative of the interests’ position in the capital structure of the
securitization.
(2) Senior interests in non-agency-sponsored mortgages include $112 million related to personal loan securitizations at December 31, 2020.
(3) Retained interests consist of Level 2 or Level 3 assets depending on the observability of significant inputs. See Note 24 to the Consolidated Financial Statements
for more information about fair value measurements.
235

Key assumptions used in measuring the fair value of retained interests at the date of sale or securitization of mortgage receivables
were as follows:
December 31, 2020
Non-agency-sponsored mortgages
(1)
U.S. agency-
sponsored mortgages
Senior
interests
Subordinated
interests
Weighted average discount rate 5.4 % 1.7 % 3.0 %
Weighted average constant prepayment rate 25.8 % 3.4 % 25.0 %
Weighted average anticipated net credit losses
(2)
NM 1.7 % 0.5 %
Weighted average life 4.8 years 3.8 years 2.3 years
December 31, 2019
Non-agency-sponsored mortgages
(1)
U.S. agency-
sponsored mortgages
Senior
interests
Subordinated
interests
Weighted average discount rate 9.3 % 3.6 % 4.6 %
Weighted average constant prepayment rate 12.9 % 10.5 % 7.6 %
Weighted average anticipated net credit losses
(2)
NM 3.9 % 2.8 %
Weighted average life 6.6 years 3.0 years 11.4 years
(1) Disclosure of non-agency-sponsored mortgages as senior and subordinated interests is indicative of the interests’ position in the capital structure of the
securitization.
(2) Anticipated net credit losses represent estimated loss severity associated with defaulted mortgage loans underlying the mortgage securitizations disclosed above.
Anticipated net credit losses, in this instance, do not represent total credit losses incurred to date, nor do they represent credit losses expected on retained interests
in mortgage securitizations.
NM Anticipated net credit losses are not meaningful due to U.S. agency guarantees.
The interests retained by the Company range from highly rated and/or senior in the capital structure to unrated and/or residual
interests. Key assumptions used in measuring the fair value of retained interests in securitizations of mortgage receivables at period
end were as follows:
December 31, 2020
Non-agency-sponsored mortgages
(1)
U.S. agency-
sponsored mortgages
Senior
interests
Subordinated
interests
Weighted average discount rate 5.9 % 7.2 % 4.3 %
Weighted average constant prepayment rate 22.7 % 5.3 % 4.7 %
Weighted average anticipated net credit losses
(2)
NM 1.2 % 1.4 %
Weighted average life 4.5 years 5.3 years 4.7 years
December 31, 2019
Non-agency-sponsored mortgages
(1)
U.S. agency-
sponsored mortgages
Senior
interests
Subordinated
interests
Weighted average discount rate 9.8 % 7.6 % 4.2 %
Weighted average constant prepayment rate 10.1 % 3.6 % 6.1 %
Weighted average anticipated net credit losses
(2)
NM 5.2 % 2.7 %
Weighted average life 6.6 years 5.9 years 29.3 years
(1) Disclosure of non-agency-sponsored mortgages as senior and subordinated interests is indicative of the interests’ position in the capital structure of the
securitization.
(2) Anticipated net credit losses represent estimated loss severity associated with defaulted mortgage loans underlying the mortgage securitizations disclosed above.
Anticipated net credit losses, in this instance, do not represent total credit losses incurred to date, nor do they represent credit losses expected on retained interests
in mortgage securitizations.
NM Anticipated net credit losses are not meaningful due to U.S. agency guarantees.
236

The sensitivity of the fair value to adverse changes of 10% and 20% in each of the key assumptions is presented in the tables
below. The negative effect of each change is calculated independently, holding all other assumptions constant. Because the key
assumptions may not be independent, the net effect of simultaneous adverse changes in the key assumptions may be less than the sum
of the individual effects shown below.
December 31, 2020
Non-agency-sponsored mortgages
In millions of dollars
U.S. agency-
sponsored mortgages
Senior
interests
Subordinated
interests
Discount rate
Adverse change of 10% $ (8) $ — $ (1)
Adverse change of 20% (15) (1) (1)
Constant prepayment rate
Adverse change of 10% (21) — —
Adverse change of 20% (40) — —
Anticipated net credit losses
Adverse change of 10% NM — —
Adverse change of 20% NM — —
December 31, 2019
Non-agency-sponsored mortgages
In millions of dollars
U.S. agency-
sponsored mortgages
Senior
interests
Subordinated
interests
Discount rate
Adverse change of 10% $ (18) $ — $ (1)
Adverse change of 20% (35) (1) (1)
Constant prepayment rate
Adverse change of 10% (18) — —
Adverse change of 20% (35) — —
Anticipated net credit losses
Adverse change of 10% NM — —
Adverse change of 20% NM — —
NM Anticipated net credit losses are not meaningful due to U.S. agency guarantees.
The following table includes information about loan delinquencies and liquidation losses for assets held in non-consolidated, non-
agency-sponsored securitization entities:
Securitized assets 90 days past due Liquidation losses
In billions of dollars, except liquidation losses in millions
2020 2019 2020 2019 2020 2019
Securitized assets
Residential mortgages
(1)
$ 16.9 $ 11.7 $ 0.5 $ 0.4 $ 26.2 $ 49.0
Commercial and other 23.9 19.0 — — — —
Total $ 40.8 $ 30.7 $ 0.5 $ 0.4 $ 26.2 $ 49.0
(1) Securitized assets include $0.2 billion of personal loan securitizations as of December 31, 2020.
237

Mortgage Servicing Rights (MSRs)
In connection with the securitization of mortgage loans, Citi’s
U.S. consumer mortgage business generally retains the
servicing rights, which entitle the Company to a future stream
of cash flows based on the outstanding principal balances of
the loans and the contractual servicing fee. Failure to service
the loans in accordance with contractual requirements may
lead to a termination of the servicing rights and the loss of
future servicing fees.
These transactions create intangible assets referred to as
MSRs, which are recorded at fair value on Citi’s Consolidated
Balance Sheet. The fair value of Citi’s capitalized MSRs was
$336 million and $495 million at December 31, 2020 and
2019, respectively. The MSRs correspond to principal loan
balances of $53 billion and $58 billion as of December 31,
2020 and 2019, respectively.
The following table summarizes the changes in
capitalized MSRs:
In millions of dollars
2020 2019
Balance, beginning of year
$ 495 $ 584
Originations
123 70
Changes in fair value of MSRs due to
changes in inputs and assumptions
(204) (84)
Other changes
(1)
(78) (75)
Sale of MSRs
— —
Balance, as of December 31 $ 336 $ 495
(1) Represents changes due to customer payments and passage of time.
The fair value of the MSRs is primarily affected by
changes in prepayments of mortgages that result from shifts in
mortgage interest rates. Specifically, higher interest rates tend
to lead to declining prepayments, which causes the fair value
of the MSRs to increase. In managing this risk, Citigroup
economically hedges a significant portion of the value of its
MSRs through the use of interest rate derivative contracts,
forward purchase and sale commitments of mortgage-backed
securities and purchased securities, all classified as Trading
account assets.
The Company receives fees during the course of servicing
previously securitized mortgages. The amounts of these fees
were as follows:
In millions of dollars
2020 2019 2018
Servicing fees $ 142 $ 148 $ 172
Late fees 5 8 4
Ancillary fees — 1 8
Total MSR fees $ 147 $ 157 $ 184
In the Consolidated Statement of Income these fees are
primarily classified as Commissions and fees, and changes in
MSR fair values are classified as Other revenue.
Re-securitizations
The Company engages in re-securitization transactions in
which debt securities are transferred to a VIE in exchange for
new beneficial interests. Citi did not transfer non-agency
(private label) securities to re-securitization entities during the
years ended December 31, 2020 and 2019. These securities are
backed by either residential or commercial mortgages and are
often structured on behalf of clients.
As of December 31, 2020 and December 31, 2019, Citi
held no retained interests in private label re-securitization
transactions structured by Citi.
The Company also re-securitizes U.S. government-agency
guaranteed mortgage-backed (agency) securities. During the
years ended December 31, 2020 and 2019, Citi transferred
agency securities with a fair value of approximately $42.8
billion and $31.9 billion, respectively, to re-securitization
entities.
As of December 31, 2020, the fair value of Citi-retained
interests in agency re-securitization transactions structured by
Citi totaled approximately $1.6 billion (including $916 million
related to re-securitization transactions executed in 2020)
compared to $2.2 billion as of December 31, 2019 (including
$1.3 billion related to re-securitization transactions executed in
2019), which is recorded in Trading account assets. The
original fair value of agency re-securitization transactions in
which Citi holds a retained interest as of December 31, 2020
and 2019 was approximately $83.6 billion and $73.5 billion,
respectively.
As of December 31, 2020 and 2019, the Company did not
consolidate any private label or agency re-securitization
entities.
Citi-Administered Asset-Backed Commercial Paper Conduits
The Company is active in the asset-backed commercial paper
conduit business as administrator of several multi-seller
commercial paper conduits and also as a service provider to
single-seller and other commercial paper conduits sponsored
by third parties.
Citi’s multi-seller commercial paper conduits are
designed to provide the Company’s clients access to low-cost
funding in the commercial paper markets. The conduits
purchase assets from or provide financing facilities to clients
and are funded by issuing commercial paper to third-party
investors. The conduits generally do not purchase assets
originated by Citi. The funding of the conduits is facilitated by
the liquidity support and credit enhancements provided by the
Company.
As administrator to Citi’s conduits, the Company is
generally responsible for selecting and structuring assets
purchased or financed by the conduits, making decisions
regarding the funding of the conduits, including determining
the tenor and other features of the commercial paper issued,
monitoring the quality and performance of the conduits’ assets
and facilitating the operations and cash flows of the conduits.
In return, the Company earns structuring fees from customers
for individual transactions and earns an administration fee
from the conduit, which is equal to the income from the client
program and liquidity fees of the conduit after payment of
conduit expenses. This administration fee is fairly stable, since
most risks and rewards of the underlying assets are passed
back to the clients. Once the asset pricing is negotiated, most
ongoing income, costs and fees are relatively stable as a
percentage of the conduit’s size.
The conduits administered by Citi do not generally invest
in liquid securities that are formally rated by third parties. The
assets are privately negotiated and structured transactions that
238
are generally designed to be held by the conduit, rather than
actively traded and sold. The yield earned by the conduit on
each asset is generally tied to the rate on the commercial paper
issued by the conduit, thus passing interest rate risk to the
client. Each asset purchased by the conduit is structured with
transaction-specific credit enhancement features provided by
the third-party client seller, including over-collateralization,
cash and excess spread collateral accounts, direct recourse or
third-party guarantees. These credit enhancements are sized
with the objective of approximating a credit rating of A or
above, based on Citi’s internal risk ratings. At December 31,
2020 and 2019, the commercial paper conduits administered
by Citi had approximately $16.7 billion and $15.6 billion of
purchased assets outstanding, respectively, and had
incremental funding commitments with clients of
approximately $17.1 billion and $16.3 billion, respectively.
Substantially all of the funding of the conduits is in the
form of short-term commercial paper. At December 31, 2020
and 2019, the weighted average remaining lives of the
commercial paper issued by the conduits were approximately
54 and 49 days, respectively.
The primary credit enhancement provided to the conduit
investors is in the form of transaction-specific credit
enhancements described above. In addition to the transaction-
specific credit enhancements, the conduits, other than the
government guaranteed loan conduit, have obtained a letter of
credit from the Company, which is equal to at least 8% to 10%
of the conduit’s assets with a minimum of $200 million. The
letters of credit provided by the Company to the conduits total
approximately $1.5 billion as of December 31, 2020 and $1.4
billion as of December 31, 2019. The net result across multi-
seller conduits administered by the Company is that, in the
event that defaulted assets exceed the transaction-specific
credit enhancements described above, any losses in each
conduit are allocated first to the Company and then to the
commercial paper investors.
Citigroup also provides the conduits with two forms of
liquidity agreements that are used to provide funding to the
conduits in the event of a market disruption, among other
events. Each asset of the conduits is supported by a
transaction-specific liquidity facility in the form of an asset
purchase agreement (APA). Under the APA, the Company has
generally agreed to purchase non-defaulted eligible
receivables from the conduit at par. The APA is not designed
to provide credit support to the conduit, as it generally does
not permit the purchase of defaulted or impaired assets. Any
funding under the APA will likely subject the underlying
conduit clients to increased interest costs. In addition, the
Company provides the conduits with program-wide liquidity
in the form of short-term lending commitments. Under these
commitments, the Company has agreed to lend to the conduits
in the event of a short-term disruption in the commercial paper
market, subject to specified conditions. The Company receives
fees for providing both types of liquidity agreements and
considers these fees to be on fair market terms.
Finally, Citi is one of several named dealers in the
commercial paper issued by the conduits and earns a market-
based fee for providing such services. Along with third-party
dealers, the Company makes a market in the commercial paper
and may from time to time fund commercial paper pending
sale to a third party. On specific dates with less liquidity in the
market, the Company may hold in inventory commercial paper
issued by conduits administered by the Company, as well as
conduits administered by third parties. Separately, in the
normal course of business, Citi purchases commercial paper,
including commercial paper issued by Citigroup's conduits. At
December 31, 2020 and 2019, the Company owned $6.6
billion and $5.5 billion, respectively, of the commercial paper
issued by its administered conduits. The Company’s
investments were not driven by market illiquidity and the
Company is not obligated under any agreement to purchase
the commercial paper issued by the conduits.
The asset-backed commercial paper conduits are
consolidated by Citi. The Company has determined that,
through its roles as administrator and liquidity provider, it has
the power to direct the activities that most significantly impact
the entities’ economic performance. These powers include its
ability to structure and approve the assets purchased by the
conduits, its ongoing surveillance and credit mitigation
activities, its ability to sell or repurchase assets out of the
conduits and its liability management. In addition, as a result
of all the Company’s involvement described above, it was
concluded that Citi has an economic interest that could
potentially be significant. However, the assets and liabilities of
the conduits are separate and apart from those of Citigroup.
No assets of any conduit are available to satisfy the creditors
of Citigroup or any of its other subsidiaries.
Collateralized Loan Obligations (CLOs)
A collateralized loan obligation (CLO) is a VIE that purchases
a portfolio of assets consisting primarily of non-investment
grade corporate loans. CLOs issue multiple tranches of debt
and equity to investors to fund the asset purchases and pay
upfront expenses associated with forming the CLO. A third-
party asset manager is contracted by the CLO to purchase the
underlying assets from the open market and monitor the credit
risk associated with those assets. Over the term of a CLO, the
asset manager directs purchases and sales of assets in a
manner consistent with the CLO’s asset management
agreement and indenture. In general, the CLO asset manager
will have the power to direct the activities of the entity that
most significantly impact the economic performance of the
CLO. Investors in a CLO, through their ownership of debt
and/or equity in it, can also direct certain activities of the
CLO, including removing its asset manager under limited
circumstances, optionally redeeming the notes, voting on
amendments to the CLO’s operating documents and other
activities. A CLO has a finite life, typically 12 years.
Citi serves as a structuring and placement agent with
respect to the CLOs. Typically, the debt and equity of the
CLOs are sold to third-party investors. On occasion, certain
Citi entities may purchase some portion of a CLO’s liabilities
for investment purposes. In addition, Citi may purchase,
typically in the secondary market, certain securities issued by
the CLOs to support its market making activities.
The Company generally does not have the power to direct
the activities that most significantly impact the economic
performance of the CLOs, as this power is generally held by a
third-party asset manager of the CLO. As such, those CLOs
are not consolidated.
239

The following tables summarize selected cash flow
information and retained interests related to Citigroup CLOs:
In billions of dollars
2020 2019 2018
Principal securitized $ 0.1 $ — $ —
Proceeds from new securitizations 0.1 — —
Cash flows received on retained
interests and other net cash flows — — 0.1
In millions of dollars
Dec. 31,
2020
Dec. 31,
2019
Dec. 31,
2018
Carrying value of retained
interests $ 1,611 $ 1,404 $ 3,142
All of Citi’s retained interests were held-to-maturity
securities as of December 31, 2020 and 2019.
Asset-Based Financing
The Company provides loans and other forms of financing to
VIEs that hold assets. Those loans are subject to the same
credit approvals as all other loans originated or purchased by
the Company. Financings in the form of debt securities or
derivatives are, in most circumstances, reported in Trading
account assets and accounted for at fair value through
earnings. The Company generally does not have the power to
direct the activities that most significantly impact these VIEs’
economic performance; thus, it does not consolidate them.
The primary types of Citi’s asset-based financings, total
assets of the unconsolidated VIEs with significant
involvement and Citi’s maximum exposure to loss are shown
below. For Citi to realize the maximum loss, the VIE
(borrower) would have to default with no recovery from the
assets held by the VIE.
December 31, 2020
In millions of dollars
Total
unconsolidated
VIE assets
Maximum
exposure to
unconsolidated
VIEs
Type
Commercial and other real
estate $ 34,570 $ 7,758
Corporate loans 12,022 7,654
Other (including investment
funds, airlines and shipping) 167,613 20,442
Total $ 214,205 $ 35,854
December 31, 2019
In millions of dollars
Total
unconsolidated
VIE assets
Maximum
exposure to
unconsolidated
VIEs
Type
Commercial and other real
estate $ 31,377 $ 7,489
Corporate loans 7,088 5,802
Other (including investment
funds, airlines and shipping) 152,124 21,140
Total $ 190,589 $ 34,431
Municipal Securities Tender Option Bond (TOB) Trusts
Municipal TOB trusts may hold fixed- or floating-rate, taxable
or tax-exempt securities issued by state and local governments
and municipalities. TOB trusts are typically structured as
single-issuer entities whose assets are purchased from either
the Company or from other investors in the municipal
securities market. TOB trusts finance the purchase of their
municipal assets by issuing two classes of certificates: long-
dated, floating rate certificates (“Floaters”) that are putable
pursuant to a liquidity facility and residual interest certificates
(“Residuals”). The Floaters are purchased by third-party
investors, typically tax-exempt money market funds. The
Residuals are purchased by the original owner of the
municipal securities that are being financed.
From Citigroup’s perspective, there are two types of TOB
trusts: customer and non-customer. Customer TOB trusts are
those trusts utilized by customers of the Company to finance
their securities, generally municipal securities. The Residuals
issued by these trusts are purchased by the customer being
financed. Non-customer TOB trusts are generally used by the
Company to finance its own municipal securities investments;
the Residuals issued by non-customer TOB trusts are
purchased by the Company.
With respect to both customer and non-customer TOB
trusts, Citi may provide remarketing agent services. If Floaters
are optionally tendered and the Company, in its role as
remarketing agent, is unable to find a new investor to purchase
the optionally tendered Floaters within a specified period of
time, Citigroup may, but is not obligated to, purchase the
tendered Floaters into its own inventory. The level of the
Company’s inventory of such Floaters fluctuates.
For certain customer TOB trusts, Citi may also serve as a
voluntary advance provider. In this capacity, the Company
may, but is not obligated to, make loan advances to customer
TOB trusts to purchase optionally tendered Floaters that have
not otherwise been successfully remarketed to new investors.
Such loans are secured by pledged Floaters. As of
December 31, 2020, Citi had no outstanding voluntary
advances to customer TOB trusts.
For certain non-customer trusts, the Company also
provides credit enhancement. At December 31, 2020 and
2019, none of the municipal bonds owned by non-customer
TOB trusts were subject to a credit guarantee provided by the
Company.
Citigroup also provides liquidity services to many
customer and non-customer trusts. If a trust is unwound early
due to an event other than a credit event on the underlying
municipal bonds, the underlying municipal bonds are sold out
of the trust and bond sale proceeds are used to redeem the
outstanding trust certificates. If this results in a shortfall
between the bond sale proceeds and the redemption price of
the tendered Floaters, the Company, pursuant to the liquidity
agreement, would be obligated to make a payment to the trust
to satisfy that shortfall. For certain customer TOB trusts,
Citigroup has also executed a reimbursement agreement with
the holder of the Residual, pursuant to which the Residual
holder is obligated to reimburse the Company for any payment
the Company makes under the liquidity arrangement. These
reimbursement agreements may be subject to daily margining
based on changes in the market value of the underlying
240
municipal bonds. In cases where a third party provides
liquidity to a non-customer TOB trust, a similar
reimbursement arrangement may be executed, whereby the
Company (or a consolidated subsidiary of the Company), as
Residual holder, would absorb any losses incurred by the
liquidity provider.
For certain other non-customer TOB trusts, Citi serves as
tender option provider. The tender option provider
arrangement allows Floater holders to put their interests
directly to the Company at any time, subject to the requisite
notice period requirements, at a price of par.
At December 31, 2020 and 2019, liquidity agreements
provided with respect to customer TOB trusts totaled $1.6
billion and $3.5 billion, respectively, of which $0.8 billion and
$1.6 billion, respectively, were offset by reimbursement
agreements. For the remaining exposure related to TOB
transactions, where the residual owned by the customer was at
least 25% of the bond value at the inception of the transaction,
no reimbursement agreement was executed.
Citi considers both customer and non-customer TOB
trusts to be VIEs. Customer TOB trusts are not consolidated
by the Company, as the power to direct the activities that most
significantly impact the trust’s economic performance rests
with the customer Residual holder, which may unilaterally
cause the sale of the trust’s bonds.
Non-customer TOB trusts generally are consolidated
because the Company holds the Residual interest and thus has
the unilateral power to cause the sale of the trust’s bonds.
The Company also provides other liquidity agreements or
letters of credit to customer-sponsored municipal investment
funds, which are not variable interest entities, and
municipality-related issuers that totaled $3.6 billion as of
December 31, 2020 and $7.0 billion as of December 31, 2019.
These liquidity agreements and letters of credit are offset by
reimbursement agreements with various term-out provisions.
Municipal Investments
Municipal investment transactions include debt and equity
interests in partnerships that finance the construction and
rehabilitation of low-income housing, facilitate lending in new
or underserved markets or finance the construction or
operation of renewable municipal energy facilities. Citi
generally invests in these partnerships as a limited partner and
earns a return primarily through the receipt of tax credits and
grants earned from the investments made by the partnership.
The Company may also provide construction loans or
permanent loans for the development or operation of real
estate properties held by partnerships. These entities are
generally considered VIEs. The power to direct the activities
of these entities is typically held by the general partner.
Accordingly, these entities are not consolidated by Citigroup.
Client Intermediation
Client intermediation transactions represent a range of
transactions designed to provide investors with specified
returns based on the returns of an underlying security,
referenced asset or index. These transactions include credit-
linked notes and equity-linked notes. In these transactions, the
VIE typically obtains exposure to the underlying security,
referenced asset or index through a derivative instrument, such
as a total-return swap or a credit-default swap. In turn, the VIE
issues notes to investors that pay a return based on the
specified underlying security, referenced asset or index. The
VIE invests the proceeds in a financial asset or a guaranteed
insurance contract that serves as collateral for the derivative
contract over the term of the transaction. The Company’s
involvement in these transactions includes being the
counterparty to the VIE’s derivative instruments and investing
in a portion of the notes issued by the VIE. In certain
transactions, the investor’s maximum risk of loss is limited
and the Company absorbs risk of loss above a specified level.
Citi does not have the power to direct the activities of the VIEs
that most significantly impact their economic performance and
thus it does not consolidate them.
Citi’s maximum risk of loss in these transactions is
defined as the amount invested in notes issued by the VIE and
the notional amount of any risk of loss absorbed by Citi
through a separate instrument issued by the VIE. The
derivative instrument held by the Company may generate a
receivable from the VIE (for example, where the Company
purchases credit protection from the VIE in connection with
the VIE’s issuance of a credit-linked note), which is
collateralized by the assets owned by the VIE. These
derivative instruments are not considered variable interests
and any associated receivables are not included in the
calculation of maximum exposure to the VIE.
Investment Funds
The Company is the investment manager for certain
investment funds and retirement funds that invest in various
asset classes including private equity, hedge funds, real estate,
fixed income and infrastructure. Citigroup earns a
management fee, which is a percentage of capital under
management, and may earn performance fees. In addition, for
some of these funds the Company has an ownership interest in
the investment funds. Citi has also established a number of
investment funds as opportunities for qualified colleagues to
invest in private equity investments. The Company acts as
investment manager for these funds and may provide
colleagues with financing on both recourse and non-recourse
bases for a portion of the colleagues’ investment
commitments.
241
22. DERIVATIVES
In the ordinary course of business, Citigroup enters into
various types of derivative transactions, which include:
• Futures and forward contracts, which are commitments
to buy or sell at a future date a financial instrument,
commodity or currency at a contracted price that may be
settled in cash or through delivery of an item readily
convertible to cash.
• Swap contracts, which are commitments to settle in cash
at a future date or dates that may range from a few days to
a number of years, based on differentials between
specified indices or financial instruments, as applied to a
notional principal amount.
• Option contracts, which give the purchaser, for a
premium, the right, but not the obligation, to buy or sell
within a specified time a financial instrument, commodity
or currency at a contracted price that may also be settled
in cash, based on differentials between specified indices
or prices.
Swaps, forwards and some option contracts are over-the-
counter (OTC) derivatives that are bilaterally negotiated with
counterparties and settled with those counterparties, except for
swap contracts that are novated and "cleared" through central
counterparties (CCPs). Futures contracts and other option
contracts are standardized contracts that are traded on an
exchange with a CCP as the counterparty from the inception of
the transaction. Citigroup enters into derivative contracts
relating to interest rate, foreign currency, commodity and other
market/credit risks for the following reasons:
• Trading Purposes: Citigroup trades derivatives as an
active market maker. Citigroup offers its customers
derivatives in connection with their risk management
actions to transfer, modify or reduce their interest rate,
foreign exchange and other market/credit risks or for their
own trading purposes. Citigroup also manages its
derivative risk positions through offsetting trade activities,
controls focused on price verification and daily reporting
of positions to senior managers.
• Hedging: Citigroup uses derivatives in connection with its
own risk management activities to hedge certain risks or
reposition the risk profile of the Company. Hedging may
be accomplished by applying hedge accounting in
accordance with ASC 815, Derivatives and Hedging, or
by an economic hedge. For example, Citigroup issues
fixed-rate long-term debt and then enters into a receive-
fixed, pay-variable-rate interest rate swap with the same
tenor and notional amount to synthetically convert the
interest payments to a net variable-rate basis. This
strategy is the most common form of an interest rate
hedge, as it minimizes net interest cost in certain yield
curve environments. Derivatives are also used to manage
market risks inherent in specific groups of on-balance
sheet assets and liabilities, including AFS securities,
commodities and borrowings, as well as other interest-
sensitive assets and liabilities. In addition, foreign
exchange contracts are used to hedge non-U.S.-dollar-
denominated debt, foreign currency-denominated AFS
securities and net investment exposures.
Derivatives may expose Citigroup to market, credit or
liquidity risks in excess of the amounts recorded on the
Consolidated Balance Sheet. Market risk on a derivative
product is the exposure created by potential fluctuations in
interest rates, market prices, foreign exchange rates and other
factors and is a function of the type of product, the volume of
transactions, the tenor and terms of the agreement and the
underlying volatility. Credit risk is the exposure to loss in the
event of nonperformance by the other party to satisfy a
derivative liability where the value of any collateral held by
Citi is not adequate to cover such losses. The recognition in
earnings of unrealized gains on derivative transactions is
subject to management’s assessment of the probability of
counterparty default. Liquidity risk is the potential exposure
that arises when the size of a derivative position may affect the
ability to monetize the position in a reasonable period of time
and at a reasonable cost in periods of high volatility and
financial stress.
Derivative transactions are customarily documented under
industry standard master netting agreements, which provide
that following an event of default, the non-defaulting party
may promptly terminate all transactions between the parties
and determine the net amount due to be paid to, or by, the
defaulting party. Events of default include (i) failure to make a
payment on a derivative transaction that remains uncured
following applicable notice and grace periods, (ii) breach of
agreement that remains uncured after applicable notice and
grace periods, (iii) breach of a representation, (iv) cross
default, either to third-party debt or to other derivative
transactions entered into between the parties, or, in some
cases, their affiliates, (v) the occurrence of a merger or
consolidation that results in a party’s becoming a materially
weaker credit and (vi) the cessation or repudiation of any
applicable guarantee or other credit support document.
Obligations under master netting agreements are often secured
by collateral posted under an industry standard credit support
annex to the master netting agreement. An event of default
may also occur under a credit support annex if a party fails to
make a collateral delivery that remains uncured following
applicable notice and grace periods.
The netting and collateral rights incorporated in the
master netting agreements are considered to be legally
enforceable if a supportive legal opinion has been obtained
from counsel of recognized standing that provides (i) the
requisite level of certainty regarding enforceability and (ii)
that the exercise of rights by the non-defaulting party to
terminate and close-out transactions on a net basis under these
agreements will not be stayed or avoided under applicable law
upon an event of default, including bankruptcy, insolvency or
similar proceeding.
A legal opinion may not be sought for certain jurisdictions
where local law is silent or unclear as to the enforceability of
such rights or where adverse case law or conflicting regulation
may cast doubt on the enforceability of such rights. In some
jurisdictions and for some counterparty types, the insolvency
law may not provide the requisite level of certainty. For
242
example, this may be the case for certain sovereigns,
municipalities, central banks and U.S. pension plans.
Exposure to credit risk on derivatives is affected by
market volatility, which may impair the ability of
counterparties to satisfy their obligations to the Company.
Credit limits are established and closely monitored for
customers engaged in derivatives transactions. Citi considers
the level of legal certainty regarding enforceability of its
offsetting rights under master netting agreements and credit
support annexes to be an important factor in its risk
management process. Specifically, Citi generally transacts
much lower volumes of derivatives under master netting
agreements where Citi does not have the requisite level of
legal certainty regarding enforceability, because such
derivatives consume greater amounts of single counterparty
credit limits than those executed under enforceable master
netting agreements.
Cash collateral and security collateral in the form of G10
government debt securities are often posted by a party to a
master netting agreement to secure the net open exposure of
the other party; the receiving party is free to commingle/
rehypothecate such collateral in the ordinary course of its
business. Nonstandard collateral such as corporate bonds,
municipal bonds, U.S. agency securities and/or MBS may also
be pledged as collateral for derivative transactions. Security
collateral posted to open and maintain a master netting
agreement with a counterparty, in the form of cash and/or
securities, may from time to time be segregated in an account
at a third-party custodian pursuant to a tri-party account
control agreement.
As of January 1, 2018, Citigroup early adopted ASU
2017-12, Targeted Improvements to Accounting for Hedging
Activities. This standard primarily impacts Citi’s accounting
for derivatives designated as cash flow hedges and fair value
hedges. Refer to the respective sections below for details.
243
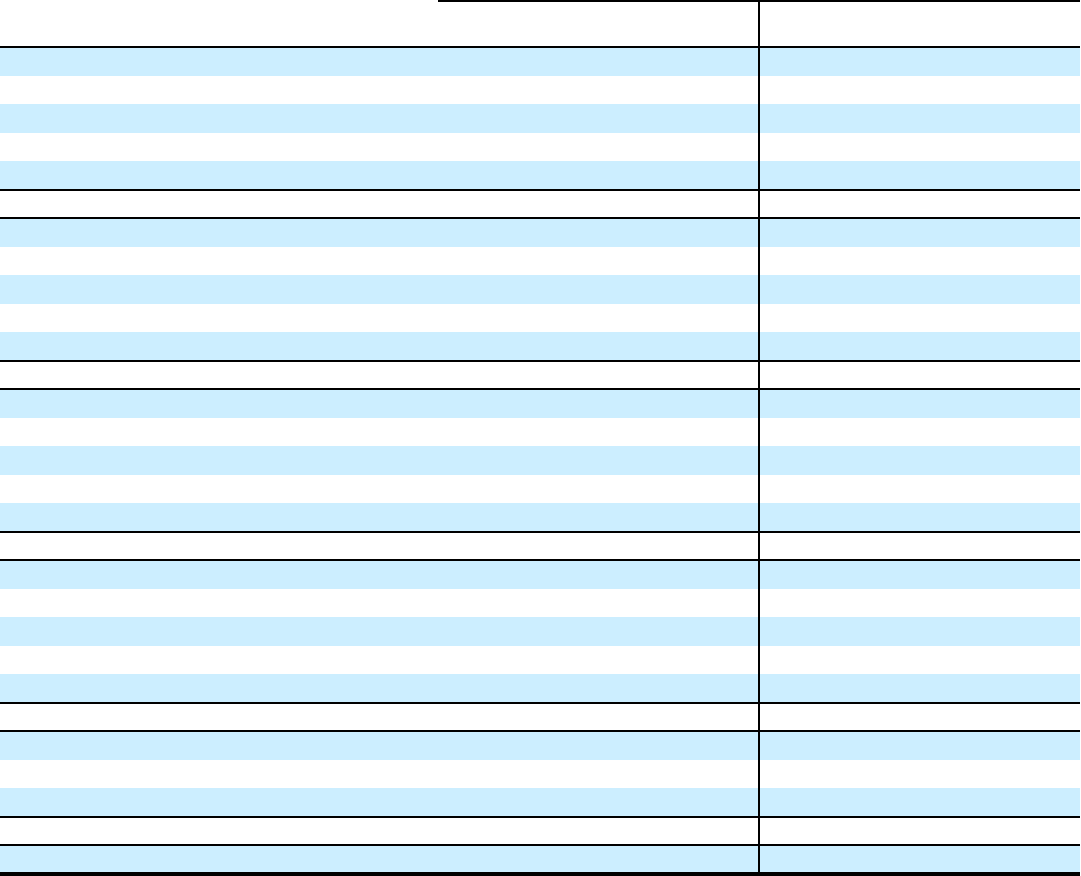
Information pertaining to Citigroup’s derivative activities,
based on notional amounts, is presented in the table below.
Derivative notional amounts are reference amounts from
which contractual payments are derived and do not represent a
complete measure of Citi’s exposure to derivative transactions.
Citi’s derivative exposure arises primarily from market
fluctuations (i.e., market risk), counterparty failure (i.e., credit
risk) and/or periods of high volatility or financial stress (i.e.,
liquidity risk), as well as any market valuation adjustments
that may be required on the transactions. Moreover, notional
amounts do not reflect the netting of offsetting trades. For
example, if Citi enters into a receive-fixed interest rate swap
with $100 million notional, and offsets this risk with an
identical but opposite pay-fixed position with a different
counterparty, $200 million in derivative notionals is reported,
although these offsetting positions may result in de minimis
overall market risk.
In addition, aggregate derivative notional amounts can
fluctuate from period to period in the normal course of
business based on Citi’s market share, levels of client activity
and other factors. All derivatives are recorded in Trading
account assets/Trading account liabilities on the Consolidated
Balance Sheet.
Derivative Notionals
Hedging instruments under
ASC 815 Trading derivative instruments
In millions of dollars
December 31,
2020
December 31,
2019
December 31,
2020
December 31,
2019
Interest rate contracts
Swaps $ 334,351 $ 318,089 $ 17,724,147 $ 17,063,272
Futures and forwards — — 4,142,514 3,636,658
Written options — — 1,573,483 2,114,511
Purchased options — — 1,418,255 1,857,770
Total interest rate contracts $ 334,351 $ 318,089 $ 24,858,399 $ 24,672,211
Foreign exchange contracts
Swaps $ 65,709 $ 63,104 $ 6,567,304 $ 6,063,853
Futures, forwards and spot 37,080 38,275 3,945,391 3,979,188
Written options 47 80 907,338 908,061
Purchased options 53 80 900,626 959,149
Total foreign exchange contracts $ 102,889 $ 101,539 $ 12,320,659 $ 11,910,251
Equity contracts
Swaps $ — $ — $ 274,098 $ 197,893
Futures and forwards — — 67,025 66,705
Written options — — 441,003 560,571
Purchased options — — 328,202 422,393
Total equity contracts $ — $ — $ 1,110,328 $ 1,247,562
Commodity and other contracts
Swaps $ — $ — $ 80,127 $ 69,445
Futures and forwards 924 1,195 143,175 137,192
Written options — — 71,376 91,587
Purchased options — — 67,849 86,631
Total commodity and other contracts $ 924 $ 1,195 $ 362,527 $ 384,855
Credit derivatives
(1)
Protection sold $ — $ — $ 543,607 $ 603,387
Protection purchased — — 612,770 703,926
Total credit derivatives $ — $ — $ 1,156,377 $ 1,307,313
Total derivative notionals $ 438,164 $ 420,823 $ 39,808,290 $ 39,522,192
(1) Credit derivatives are arrangements designed to allow one party (protection purchaser) to transfer the credit risk of a “reference asset” to another party (protection
seller). These arrangements allow a protection seller to assume the credit risk associated with the reference asset without directly purchasing that asset. The
Company enters into credit derivative positions for purposes such as risk management, yield enhancement, reduction of credit concentrations and diversification of
overall risk.
244
The following tables present the gross and net fair values
of the Company’s derivative transactions and the related
offsetting amounts as of December 31, 2020 and 2019. Gross
positive fair values are offset against gross negative fair values
by counterparty, pursuant to enforceable master netting
agreements. Under ASC 815-10-45, payables and receivables
in respect of cash collateral received from or paid to a given
counterparty pursuant to a credit support annex are included in
the offsetting amount if a legal opinion supporting the
enforceability of netting and collateral rights has been
obtained. GAAP does not permit similar offsetting for security
collateral.
In addition, the following tables reflect rule changes
adopted by clearing organizations that require or allow entities
to treat certain derivative assets, liabilities and the related
variation margin as settlement of the related derivative fair
values for legal and accounting purposes, as opposed to
presenting gross derivative assets and liabilities that are
subject to collateral, whereby the counterparties would also
record a related collateral payable or receivable. As a result,
the tables reflect a reduction of approximately $280 billion
and $180 billion as of December 31, 2020 and 2019,
respectively, of derivative assets and derivative liabilities that
previously would have been reported on a gross basis, but are
now legally settled and not subject to collateral. The tables
also present amounts that are not permitted to be offset, such
as security collateral or cash collateral posted at third-party
custodians, but which would be eligible for offsetting to the
extent that an event of default has occurred and a legal opinion
supporting enforceability of the netting and collateral rights
has been obtained.
245

Derivative Mark-to-Market (MTM) Receivables/Payables
In millions of dollars at December 31, 2020
Derivatives classified
in Trading account assets/liabilities
(1)(2)
Derivatives instruments designated as ASC 815 hedges Assets Liabilities
Over-the-counter $ 1,781 $ 161
Cleared 74 319
Interest rate contracts $ 1,855 $ 480
Over-the-counter $ 2,037 $ 2,042
Foreign exchange contracts $ 2,037 $ 2,042
Total derivatives instruments designated as ASC 815 hedges $ 3,892 $ 2,522
Derivatives instruments not designated as ASC 815 hedges
Over-the-counter $ 228,519 $ 209,330
Cleared 11,041 12,563
Exchange traded 46 38
Interest rate contracts $ 239,606 $ 221,931
Over-the-counter $ 153,791 $ 152,784
Cleared 842 1,239
Exchange traded — 1
Foreign exchange contracts $ 154,633 $ 154,024
Over-the-counter $ 29,244 $ 41,036
Cleared 1 18
Exchange traded 21,274 22,515
Equity contracts $ 50,519 $ 63,569
Over-the-counter $ 13,659 $ 17,076
Exchange traded 879 1,017
Commodity and other contracts $ 14,538 $ 18,093
Over-the-counter $ 7,826 $ 7,951
Cleared 1,963 2,178
Credit derivatives $ 9,789 $ 10,129
Total derivatives instruments not designated as ASC 815 hedges $ 469,085 $ 467,746
Total derivatives $ 472,977 $ 470,268
Cash collateral paid/received
(3)
$ 32,778 $ 8,196
Less: Netting agreements
(4)
(364,879) (364,879)
Less: Netting cash collateral received/paid
(5)
(63,915) (45,628)
Net receivables/payables included on the Consolidated Balance Sheet
(6)
$ 76,961 $ 67,957
Additional amounts subject to an enforceable master netting agreement, but not offset
on the Consolidated Balance Sheet
Less: Cash collateral received/paid $ (1,567) $ (473)
Less: Non-cash collateral received/paid (7,408) (13,087)
Total net receivables/payables
(6)
$ 67,986 $ 54,397
(1) The derivatives fair values are also presented in Note 24 to the Consolidated Financial Statements.
(2) Over-the-counter (OTC) derivatives are derivatives executed and settled bilaterally with counterparties without the use of an organized exchange or central
clearing house. Cleared derivatives include derivatives executed bilaterally with a counterparty in the OTC market, but then novated to a central clearing house,
whereby the central clearing house becomes the counterparty to both of the original counterparties. Exchange-traded derivatives include derivatives executed
directly on an organized exchange that provides pre-trade price transparency.
(3) Reflects the net amount of the $78,406 million and $72,111 million of gross cash collateral paid and received, respectively. Of the gross cash collateral paid,
$45,628 million was used to offset trading derivative liabilities. Of the gross cash collateral received, $63,915 million was used to offset trading derivative assets.
(4) Represents the netting of balances with the same counterparty under enforceable netting agreements. Approximately $336 billion, $9 billion and $20 billion of the
netting against trading account asset/liability balances is attributable to each of the OTC, cleared and exchange-traded derivatives, respectively.
(5) Represents the netting of cash collateral paid and received by counterparties under enforceable credit support agreements. Substantially all netting of cash
collateral received and paid is against OTC derivative assets and liabilities, respectively.
(6) The net receivables/payables include approximately $6 billion of derivative asset and $8 billion of derivative liability fair values not subject to enforceable master
netting agreements, respectively.
246

In millions of dollars at December 31, 2019
Derivatives classified
in Trading account assets/liabilities
(1)(2)
Derivatives instruments designated as ASC 815 hedges Assets Liabilities
Over-the-counter $ 1,682 $ 143
Cleared 41 111
Interest rate contracts $ 1,723 $ 254
Over-the-counter $ 1,304 $ 908
Cleared — 2
Foreign exchange contracts $ 1,304 $ 910
Total derivatives instruments designated as ASC 815 hedges $ 3,027 $ 1,164
Derivatives instruments not designated as ASC 815 hedges
Over-the-counter $ 189,892 $ 169,749
Cleared 5,896 7,472
Exchange traded 157 180
Interest rate contracts $ 195,945 $ 177,401
Over-the-counter $ 105,401 $ 108,807
Cleared 862 1,015
Exchange traded 3 —
Foreign exchange contracts $ 106,266 $ 109,822
Over-the-counter $ 21,311 $ 22,411
Exchange traded 7,160 8,075
Equity contracts $ 28,471 $ 30,486
Over-the-counter $ 13,582 $ 16,773
Exchange traded 630 542
Commodity and other contracts $ 14,212 $ 17,315
Over-the-counter $ 8,896 $ 8,975
Cleared 1,513 1,763
Credit derivatives $ 10,409 $ 10,738
Total derivatives instruments not designated as ASC 815 hedges $ 355,303 $ 345,762
Total derivatives $ 358,330 $ 346,926
Cash collateral paid/received
(3)
$ 17,926 $ 14,391
Less: Netting agreements
(4)
(274,970) (274,970)
Less: Netting cash collateral received/paid
(5)
(44,353) (38,919)
Net receivables/payables included on the Consolidated Balance Sheet
(6)
$ 56,933 $ 47,428
Additional amounts subject to an enforceable master netting agreement, but not offset
on the Consolidated Balance Sheet
Less: Cash collateral received/paid $ (861) $ (128)
Less: Non-cash collateral received/paid (13,143) (7,308)
Total net receivables/payables
(6)
$ 42,929 $ 39,992
(1) The derivatives fair values are also presented in Note 24 to the Consolidated Financial Statements.
(2) Over-the-counter (OTC) derivatives include derivatives executed and settled bilaterally with counterparties without the use of an organized exchange or central
clearing house. Cleared derivatives include derivatives executed bilaterally with a counterparty in the OTC market, but then novated to a central clearing house,
whereby the central clearing house becomes the counterparty to both of the original counterparties. Exchange-traded derivatives include derivatives executed
directly on an organized exchange that provides pre-trade price transparency.
(3) Reflects the net amount of the $56,845 million and $58,744 million of gross cash collateral paid and received, respectively. Of the gross cash collateral paid,
$38,919 million was used to offset trading derivative liabilities. Of the gross cash collateral received, $44,353 million was used to offset trading derivative assets.
(4) Represents the netting of balances with the same counterparty under enforceable netting agreements. Approximately $262 billion, $6 billion and $7 billion of the
netting against trading account asset/liability balances is attributable to each of the OTC, cleared and exchange-traded derivatives, respectively.
(5) Represents the netting of cash collateral paid and received by counterparties under enforceable credit support agreements. Substantially all netting of cash
collateral received and paid is against OTC derivative assets and liabilities, respectively.
(6) The net receivables/payables include approximately $7 billion of derivative asset and $6 billion of derivative liability fair values not subject to enforceable master
netting agreements, respectively.
247

For the years ended December 31, 2020, 2019 and 2018,
amounts recognized in Principal transactions in the
Consolidated Statement of Income include certain derivatives
not designated in a qualifying hedging relationship. Citigroup
presents this disclosure by business classification, showing
derivative gains and losses related to its trading activities
together with gains and losses related to non-derivative
instruments within the same trading portfolios, as this
represents how these portfolios are risk managed. See Note 6
to the Consolidated Financial Statements for further
information.
The amounts recognized in Other revenue in the
Consolidated Statement of Income related to derivatives not
designated in a qualifying hedging relationship are shown
below. The table below does not include any offsetting gains
(losses) on the economically hedged items to the extent that
such amounts are also recorded in Other revenue.
Gains (losses) included in
Other revenue
Year ended December 31,
In millions of dollars
2020 2019 2018
Interest rate contracts $ 63 $ 57 $ (25)
Foreign exchange (57) (29) (197)
Total $ 6 $ 28 $ (222)
Accounting for Derivative Hedging
Citigroup accounts for its hedging activities in accordance
with ASC 815, Derivatives and Hedging. As a general rule,
hedge accounting is permitted where the Company is exposed
to a particular risk, such as interest rate or foreign exchange
risk, that causes changes in the fair value of an asset or
liability or variability in the expected future cash flows of an
existing asset, liability or a forecasted transaction that may
affect earnings.
Derivative contracts hedging the risks associated with
changes in fair value are referred to as fair value hedges, while
contracts hedging the variability of expected future cash flows
are cash flow hedges. Hedges that utilize derivatives or debt
instruments to manage the foreign exchange risk associated
with equity investments in non-U.S.-dollar-functional-
currency foreign subsidiaries (net investment in a foreign
operation) are net investment hedges.
To qualify as an accounting hedge under the hedge
accounting rules (versus an economic hedge where hedge
accounting is not applied), a hedging relationship must be
highly effective in offsetting the risk designated as being
hedged. The hedging relationship must be formally
documented at inception, detailing the particular risk
management objective and strategy for the hedge. This
includes the item and risk(s) being hedged, the hedging
instrument being used and how effectiveness will be assessed.
The effectiveness of these hedging relationships is evaluated at
hedge inception and on an ongoing basis both on a
retrospective and prospective basis, typically using
quantitative measures of correlation, with hedge
ineffectiveness measured and recorded in current earnings.
Hedge effectiveness assessment methodologies are performed
in a similar manner for similar hedges, and are used
consistently throughout the hedging relationships. The
assessment of effectiveness may exclude changes in the value
of the hedged item that are unrelated to the risks being hedged
and the changes in fair value of the derivative associated with
time value. Prior to January 1, 2018, these excluded items
were recognized in current earnings for the hedging derivative,
while changes in the value of a hedged item that were not
related to the hedged risk were not recorded. Upon adoption of
ASC 2017-12, Citi excludes changes in the cross-currency
basis associated with cross-currency swaps from the
assessment of hedge effectiveness and records it in Other
comprehensive income.
Discontinued Hedge Accounting
A hedging instrument must be highly effective in
accomplishing the hedge objective of offsetting either changes
in the fair value or cash flows of the hedged item for the risk
being hedged. Management may voluntarily de-designate an
accounting hedge at any time, but if a hedging relationship is
not highly effective, it no longer qualifies for hedge
accounting and must be de-designated. Subsequent changes in
the fair value of the derivative are recognized in Other revenue
or Principal transactions, similar to trading derivatives, with
no offset recorded related to the hedged item.
For fair value hedges, any changes in the fair value of the
hedged item remain as part of the basis of the asset or liability
and are ultimately realized as an element of the yield on the
item. For cash flow hedges, changes in fair value of the end-
user derivative remain in Accumulated other comprehensive
income (loss) (AOCI) and are included in the earnings of
future periods when the forecasted hedged cash flows impact
earnings. However, if it becomes probable that some or all of
the hedged forecasted transactions will not occur, any amounts
that remain in AOCI related to these transactions must be
immediately reflected in Other revenue.
The foregoing criteria are applied on a decentralized
basis, consistent with the level at which market risk is
managed, but are subject to various limits and controls. The
underlying asset, liability or forecasted transaction may be an
individual item or a portfolio of similar items.
248
Fair Value Hedges
Hedging of Benchmark Interest Rate Risk
Citigroup’s fair value hedges are primarily hedges of fixed-
rate long-term debt or assets, such as available-for-sale debt
securities or loans.
For qualifying fair value hedges of interest rate risk, the
changes in the fair value of the derivative and the change in
the fair value of the hedged item attributable to the hedged risk
are presented within Interest revenue or Interest expense based
on whether the hedged item is an asset or a liability.
Citigroup has executed a last-of-layer hedge, which
permits an entity to hedge the interest rate risk of a stated
portion of a closed portfolio of prepayable financial assets that
are expected to remain outstanding for the designated tenor of
the hedge. In accordance with ASC 815, an entity may exclude
prepayment risk when measuring the change in fair value of
the hedged item attributable to interest rate risk under the last-
of-layer approach. Similar to other fair value hedges, where
the hedged item is an asset, the fair value of the hedged item
attributable to interest rate risk will be presented in Interest
revenue along with the change in the fair value of the hedging
instrument.
Hedging of Foreign Exchange Risk
Citigroup hedges the change in fair value attributable to
foreign exchange rate movements in available-for-sale debt
securities and long-term debt that are denominated in
currencies other than the functional currency of the entity
holding the securities or issuing the debt. The hedging
instrument is generally a forward foreign exchange contract or
a cross-currency swap contract. Citigroup considers the
premium associated with forward contracts (i.e., the
differential between the spot and contractual forward rates) as
the cost of hedging; this amount is excluded from the
assessment of hedge effectiveness and is generally reflected
directly in earnings over the life of the hedge. Citi also
excludes changes in cross-currency basis associated with
cross-currency swaps from the assessment of hedge
effectiveness and records it in Other comprehensive income.
Hedging of Commodity Price Risk
Citigroup hedges the change in fair value attributable to spot
price movements in physical commodities inventories. The
hedging instrument is a futures contract to sell the underlying
commodity. In this hedge, the change in the value of the
hedged inventory is reflected in earnings, which offsets the
change in the fair value of the futures contract that is also
reflected in earnings. Although the change in the fair value of
the hedging instrument recorded in earnings includes changes
in forward rates, Citigroup excludes the differential between
the spot and the contractual forward rates under the futures
contract from the assessment of hedge effectiveness, and it is
generally reflected directly in earnings over the life of the
hedge. Citi also excludes changes in forward rates from the
assessment of hedge effectiveness and records it in Other
comprehensive income.
249
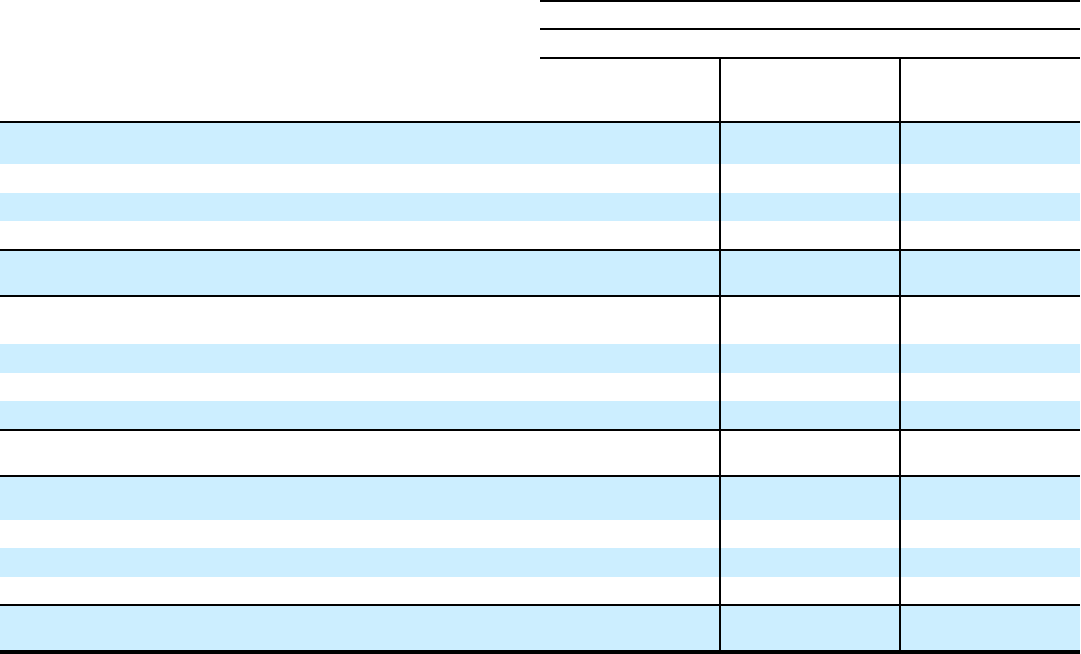
The following table summarizes the gains (losses) on the Company’s fair value hedges:
Gains (losses) on fair value hedges
(1)
Year ended December 31,
2020 2019 2018
In millions of dollars
Other
revenue
Net
interest
revenue
Other
revenue
Net
interest
revenue
Other
revenue
Net
interest
revenue
Gain (loss) on the hedging derivatives included in assessment of the
effectiveness of fair value hedges
Interest rate hedges $ — $ 4,189 $ — $ 2,273 $ — $ 794
Foreign exchange hedges 1,442 — 337 — (2,064) —
Commodity hedges (164) — (33) — (123) —
Total gain (loss) on the hedging derivatives included in assessment of
the effectiveness of fair value hedges $ 1,278 $ 4,189 $ 304 $ 2,273 $ (2,187) $ 794
Gain (loss) on the hedged item in designated and qualifying fair
value hedges
Interest rate hedges $ — $ (4,537) $ — $ (2,085) $ — $ (747)
Foreign exchange hedges (1,442) — (337) — 2,064 —
Commodity hedges 164 — 33 — 124 —
Total gain (loss) on the hedged item in designated and qualifying fair
value hedges $ (1,278) $ (4,537) $ (304) $ (2,085) $ 2,188 $ (747)
Net gain (loss) on the hedging derivatives excluded from assessment
of the effectiveness of fair value hedges
Interest rate hedges $ — $ (23) $ — $ 3 $ — $ (5)
Foreign exchange hedges
(2)
(73) — (109) — (4) —
Commodity hedges 131 — 41 — (19) —
Total net gain (loss) on the hedging derivatives excluded from
assessment of the effectiveness of fair value hedges $ 58 $ (23) $ (68) $ 3 $ (23) $ (5)
(1) Gain (loss) amounts for interest rate risk hedges are included in Interest income/Interest expense. The accrued interest income on fair value hedges is recorded in
Net interest revenue and is excluded from this table.
(2) Amounts relate to the premium associated with forward contracts (differential between spot and contractual forward rates) that are excluded from the assessment
of hedge effectiveness and are generally reflected directly in earnings. Amounts related to cross-currency basis, which are recognized in AOCI, are not reflected in
the table above. The amount of cross-currency basis that was included in AOCI was $(23) million and $33 million for the years ended December 31, 2020 and
2019, respectively.
250
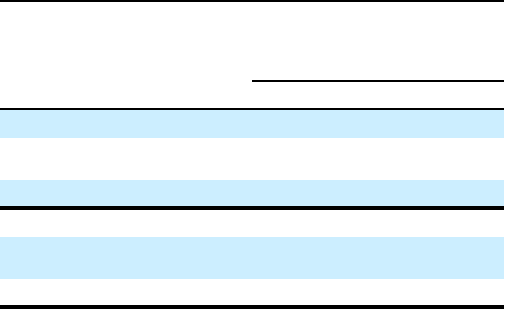
Cumulative Basis Adjustment
Upon electing to apply ASC 815 fair value hedge accounting,
the carrying value of the hedged item is adjusted to reflect the
cumulative changes in the hedged risk. This cumulative hedge
basis adjustment becomes part of the carrying value of the
hedged item until the hedged item is derecognized from the
balance sheet. The table below presents the carrying amount of
Citi’s hedged assets and liabilities under qualifying fair value
hedges at December 31, 2020 and 2019, along with the
cumulative hedge basis adjustments included in the carrying
value of those hedged assets and liabilities, that would reverse
through earnings in future periods.
In millions of dollars
Balance sheet
line item in
which hedged
item is recorded
Carrying
amount of
hedged asset/
liability
Cumulative fair value hedging
adjustment increasing
(decreasing) the carrying
amount
Active De-designated
As of December 31, 2020
Debt securities
AFS
(1)(3)
$ 81,082 $ 28 $ 342
Long-term debt 169,026 5,554 4,989
As of December 31, 2019
Debt securities
AFS
(2)(3)
$ 94,659 $ (114) $ 743
Long-term debt 157,387 2,334 3,445
(1) These amounts include a cumulative basis adjustment of $(18) million
for active hedges and $62 million for de-designated hedges as of
December 31, 2020 related to certain prepayable financial assets
previously designated as the hedged item in a fair value hedge using the
last-of-layer approach. The Company designated approximately
$2,527 million as the hedged amount (from a closed portfolio of
prepayable financial assets with a carrying value of $19 billion as of
December 31, 2020) in a last-of-layer hedging relationship.
(2) These amounts include a cumulative basis adjustment of $(8) million for
active hedges and $157 million for de-designated hedges as of
December 31, 2019 related to certain prepayable financial assets
designated as the hedged item in a fair value hedge using the last-of-
layer approach. The Company designated approximately $605 million as
the hedged amount (from a closed portfolio of prepayable financial
assets with a carrying value of $20 billion as of December 31, 2019) in a
last-of-layer hedging relationship.
(3) Carrying amount represents the amortized cost.
251
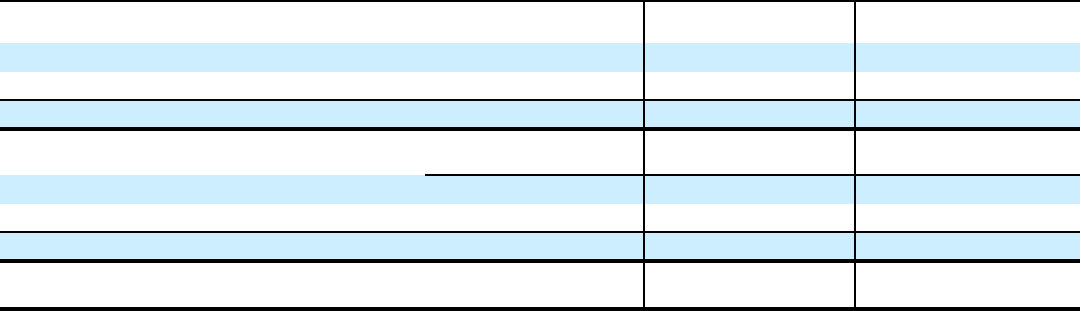
Cash Flow Hedges
Citigroup hedges the variability of forecasted cash flows due
to changes in contractually specified interest rates associated
with floating-rate assets/liabilities and other forecasted
transactions. Variable cash flows from those liabilities are
synthetically converted to fixed-rate cash flows by entering
into receive-variable, pay-fixed interest rate swaps and
receive-variable, pay-fixed forward-starting interest rate
swaps. Variable cash flows associated with certain assets are
synthetically converted to fixed-rate cash flows by entering
into receive-fixed, pay-variable interest rate swaps. These cash
flow hedging relationships use either regression analysis or
dollar-offset ratio analysis to assess whether the hedging
relationships are highly effective at inception and on an
ongoing basis. Prior to the adoption of ASU 2017-12,
Citigroup designated the risk being hedged as the risk of
overall variability in the hedged cash flows for certain items.
With the adoption of ASU 2017-12, Citigroup hedges the
variability from changes in a contractually specified rate and
recognizes the entire change in fair value of the cash flow
hedging instruments in AOCI. Prior to the adoption of ASU
2017-12, to the extent that these derivatives were not fully
effective, changes in their fair values in excess of changes in
the value of the hedged transactions were immediately
included in Other revenue. With the adoption of ASU
2017-12, such amounts are no longer required to be
immediately recognized in income, but instead the full change
in the value of the hedging instrument is required to be
recognized in AOCI, and then recognized in earnings in the
same period that the cash flows impact earnings. The pretax
change in AOCI from cash flow hedges is presented below:
In millions of dollars
2020 2019 2018
Amount of gain (loss) recognized in AOCI on
derivatives
Interest rate contracts $ 2,670 $ 746 $ (361)
Foreign exchange contracts (15) (17) 5
Total gain (loss) recognized in AOCI $ 2,655 $ 729 $ (356)
Amount of gain (loss) reclassified from AOCI to
earnings
(1)
Other
revenue
Net interest
revenue
Other
revenue
Net interest
revenue
Other
revenue
Net interest
revenue
Interest rate contracts $ — $ 734 $ — $ (384) $ — $ (301)
Foreign exchange contracts (4) — (7) — (17) —
Total gain (loss) reclassified from AOCI into earnings $ (4) $ 734 $ (7) $ (384) $ (17) $ (301)
Net pretax change in cash flow hedges included
within AOCI $ 1,925 $ 1,120 $ (38)
(1) All amounts reclassified into earnings for interest rate contracts are included in Interest income/Interest expense (Net interest revenue). For all other hedges, the
amounts reclassified to earnings are included primarily in Other revenue and Net interest revenue in the Consolidated Statement of Income.
For cash flow hedges, the entire change in the fair value
of the hedging derivative is recognized in AOCI and then
reclassified to earnings in the same period that the forecasted
hedged cash flows impact earnings. The net gain (loss)
associated with cash flow hedges expected to be reclassified
from AOCI within 12 months of December 31, 2020 is
approximately $920 million. The maximum length of time
over which forecasted cash flows are hedged is 10 years.
The after-tax impact of cash flow hedges on AOCI is
shown in Note 19 to the Consolidated Financial Statements.
252
Net Investment Hedges
Consistent with ASC 830-20, Foreign Currency Matters—
Foreign Currency Transactions, ASC 815 allows the hedging
of the foreign currency risk of a net investment in a foreign
operation. Citigroup uses foreign currency forwards, cross-
currency swaps, options and foreign currency-denominated
debt instruments to manage the foreign exchange risk
associated with Citigroup’s equity investments in several non-
U.S.-dollar-functional-currency foreign subsidiaries. Citigroup
records the change in the carrying amount of these
investments in Foreign currency translation adjustment within
AOCI. Simultaneously, the effective portion of the hedge of
this exposure is also recorded in Foreign currency translation
adjustment and any ineffective portion is immediately
recorded in earnings.
For derivatives designated as net investment hedges,
Citigroup follows the forward-rate method outlined in ASC
815-35-35. According to that method, all changes in fair value,
including changes related to the forward-rate component of the
foreign currency forward contracts and the time value of
foreign currency options, are recorded in Foreign currency
translation adjustment within AOCI.
For foreign currency-denominated debt instruments that
are designated as hedges of net investments, the translation
gain or loss that is recorded in Foreign currency translation
adjustment is based on the spot exchange rate between the
functional currency of the respective subsidiary and the U.S.
dollar, which is the functional currency of Citigroup. To the
extent that the notional amount of the hedging instrument
exactly matches the hedged net investment, and the underlying
exchange rate of the derivative hedging instrument relates to
the exchange rate between the functional currency of the net
investment and Citigroup’s functional currency (or, in the case
of a non-derivative debt instrument, such instrument is
denominated in the functional currency of the net investment),
no ineffectiveness is recorded in earnings.
The pretax gain (loss) recorded in Foreign currency
translation adjustment within AOCI, related to net investment
hedges, was $(600) million, $(569) million and $1,147 million
for the years ended December 31, 2020, 2019 and 2018,
respectively.
Economic Hedges
Citigroup often uses economic hedges when hedge accounting
would be too complex or operationally burdensome. End-user
derivatives that are economic hedges are carried at fair value,
with changes in value included in either Principal transactions
or Other revenue.
For asset/liability management hedging, fixed-rate long-
term debt is recorded at amortized cost under GAAP.
For other hedges that either do not meet the ASC 815
hedging criteria or for which management decides not to apply
ASC 815 hedge accounting, the derivative is recorded at fair
value on the balance sheet with the associated changes in fair
value recorded in earnings, while the debt continues to be
carried at amortized cost. Therefore, current earnings are
affected by the interest rate shifts and other factors that cause a
change in the swap’s value, but for which no offsetting change
in value is recorded on the debt.
Citigroup may alternatively elect to account for the debt at
fair value under the fair value option. Once the irrevocable
election is made upon issuance of the debt, the full change in
fair value of the debt is reported in earnings. The changes in
fair value of the related interest rate swap are also reflected in
earnings, which provides a natural offset to the debt’s fair
value change. To the extent that the two amounts differ
because the full change in the fair value of the debt includes
risks not offset by the interest rate swap, the difference is
automatically captured in current earnings.
Additional economic hedges include hedges of the credit
risk component of commercial loans and loan commitments.
Citigroup periodically evaluates its hedging strategies in other
areas and may designate either an accounting hedge or an
economic hedge after considering the relative costs and
benefits. Economic hedges are also employed when the
hedged item itself is marked to market through current
earnings, such as hedges of commitments to originate one- to
four-family mortgage loans to be HFS and MSRs.
Credit Derivatives
Citi is a market maker and trades a range of credit derivatives.
Through these contracts, Citi either purchases or writes
protection on either a single name or a portfolio of reference
credits. Citi also uses credit derivatives to help mitigate credit
risk in its corporate and consumer loan portfolios and other
cash positions and to facilitate client transactions.
Citi monitors its counterparty credit risk in credit
derivative contracts. As of December 31, 2020 and 2019,
approximately 97% and 98%, respectively, of the gross
receivables are from counterparties with which Citi maintains
collateral agreements. A majority of Citi’s top 15
counterparties (by receivable balance owed to Citi) are central
clearing houses, banks, financial institutions or other dealers.
Contracts with these counterparties do not include ratings-
based termination events. However, counterparty ratings
downgrades may have an incremental effect by lowering the
threshold at which Citi may call for additional collateral.
The range of credit derivatives entered into includes credit
default swaps, total return swaps, credit options and credit-
linked notes.
A credit default swap is a contract in which, for a fee, a
protection seller agrees to reimburse a protection buyer for any
losses that occur due to a predefined credit event on a
reference entity. These credit events are defined by the terms
of the derivative contract and the reference credit and are
generally limited to the market standard of failure to pay on
indebtedness and bankruptcy of the reference credit and, in a
more limited range of transactions, debt restructuring. Credit
derivative transactions that reference emerging market entities
also typically include additional credit events to cover the
acceleration of indebtedness and the risk of repudiation or a
payment moratorium. In certain transactions, protection may
be provided on a portfolio of reference entities or asset-backed
securities. If there is no credit event, as defined by the specific
derivative contract, then the protection seller makes no
payments to the protection buyer and receives only the
contractually specified fee. However, if a credit event occurs
as defined in the specific derivative contract sold, the
protection seller will be required to make a payment to the
253
protection buyer. Under certain contracts, the seller of
protection may not be required to make a payment until a
specified amount of losses has occurred with respect to the
portfolio and/or may only be required to pay for losses up to a
specified amount.
A total return swap typically transfers the total economic
performance of a reference asset, which includes all associated
cash flows, as well as capital appreciation or depreciation. The
protection buyer receives a floating rate of interest and any
depreciation on the reference asset from the protection seller
and, in return, the protection seller receives the cash flows
associated with the reference asset plus any appreciation.
Thus, according to the total return swap agreement, the
protection seller will be obligated to make a payment any time
the floating interest rate payment plus any depreciation of the
reference asset exceeds the cash flows associated with the
underlying asset. A total return swap may terminate upon a
default of the reference asset or a credit event with respect to
the reference entity, subject to the provisions of the related
total return swap agreement between the protection seller and
the protection buyer.
A credit option is a credit derivative that allows investors
to trade or hedge changes in the credit quality of a reference
entity. For example, in a credit spread option, the option writer
assumes the obligation to purchase or sell credit protection on
the reference entity at a specified “strike” spread level. The
option purchaser buys the right to sell credit default protection
on the reference entity to, or purchase it from, the option
writer at the strike spread level. The payments on credit spread
options depend either on a particular credit spread or the price
of the underlying credit-sensitive asset or other reference
entity. The options usually terminate if a credit event occurs
with respect to the underlying reference entity.
A credit-linked note is a form of credit derivative
structured as a debt security with an embedded credit default
swap. The purchaser of the note effectively provides credit
protection to the issuer by agreeing to receive a return that
could be negatively affected by credit events on the underlying
reference credit. If the reference entity defaults, the note may
be cash settled or physically settled by delivery of a debt
security of the reference entity. Thus, the maximum amount of
the note purchaser’s exposure is the amount paid for the
credit-linked note.
254

The following tables summarize the key characteristics of Citi’s credit derivatives portfolio by counterparty and derivative form:
Fair values Notionals
In millions of dollars at December 31, 2020
Receivable
(1)
Payable
(2)
Protection
purchased
Protection
sold
By industry of counterparty
Banks $ 2,902 $ 3,187 $ 117,685 $ 120,739
Broker-dealers 1,770 1,215 46,928 44,692
Non-financial 109 90 5,740 2,217
Insurance and other financial institutions 5,008 5,637 442,417 375,959
Total by industry of counterparty $ 9,789 $ 10,129 $ 612,770 $ 543,607
By instrument
Credit default swaps and options $ 9,254 $ 9,254 $ 599,633 $ 538,426
Total return swaps and other 535 875 13,137 5,181
Total by instrument $ 9,789 $ 10,129 $ 612,770 $ 543,607
By rating of reference entity
Investment grade $ 4,136 $ 4,037 $ 478,643 $ 418,147
Non-investment grade 5,653 6,092 134,127 125,460
Total by rating of reference entity $ 9,789 $ 10,129 $ 612,770 $ 543,607
By maturity
Within 1 year $ 914 $ 1,355 $ 134,080 $ 125,464
From 1 to 5 years 6,022 5,991 421,682 374,376
After 5 years 2,853 2,783 57,008 43,767
Total by maturity $ 9,789 $ 10,129 $ 612,770 $ 543,607
(1) The fair value amount receivable is composed of $3,514 million under protection purchased and $6,275 million under protection sold.
(2) The fair value amount payable is composed of $7,037 million under protection purchased and $3,092 million under protection sold.
Fair values Notionals
In millions of dollars at December 31, 2019
Receivable
(1)
Payable
(2)
Protection
purchased
Protection
sold
By industry of counterparty
Banks $ 4,017 $ 4,102 $ 172,461 $ 169,546
Broker-dealers 1,724 1,528 54,843 53,846
Non-financial 92 76 2,601 1,968
Insurance and other financial institutions 4,576 5,032 474,021 378,027
Total by industry of counterparty $ 10,409 $ 10,738 $ 703,926 $ 603,387
By instrument
Credit default swaps and options $ 9,759 $ 9,791 $ 685,643 $ 593,850
Total return swaps and other 650 947 18,283 9,537
Total by instrument $ 10,409 $ 10,738 $ 703,926 $ 603,387
By rating of reference entity
Investment grade $ 4,579 $ 4,578 $ 560,806 $ 470,778
Non-investment grade 5,830 6,160 143,120 132,609
Total by rating of reference entity $ 10,409 $ 10,738 $ 703,926 $ 603,387
By maturity
Within 1 year $ 1,806 $ 2,181 $ 231,135 $ 176,188
From 1 to 5 years 7,275 7,265 414,237 379,915
After 5 years 1,328 1,292 58,554 47,284
Total by maturity $ 10,409 $ 10,738 $ 703,926 $ 603,387
(1) The fair value amount receivable is composed of $3,415 million under protection purchased and $6,994 million under protection sold.
(2) The fair value amount payable is composed of $7,793 million under protection purchased and $2,945 million under protection sold.
255
Fair values included in the above tables are prior to
application of any netting agreements and cash collateral. For
notional amounts, Citi generally has a mismatch between the
total notional amounts of protection purchased and sold, and it
may hold the reference assets directly rather than entering into
offsetting credit derivative contracts as and when desired. The
open risk exposures from credit derivative contracts are
largely matched after certain cash positions in reference assets
are considered and after notional amounts are adjusted, either
to a duration-based equivalent basis or to reflect the level of
subordination in tranched structures. The ratings of the credit
derivatives portfolio presented in the tables and used to
evaluate payment/performance risk are based on the assigned
internal or external ratings of the reference asset or entity.
Where external ratings are used, investment-grade ratings are
considered to be “Baa/BBB” and above, while anything below
is considered non-investment grade. Citi’s internal ratings are
in line with the related external rating system.
Citigroup evaluates the payment/performance risk of the
credit derivatives for which it stands as a protection seller
based on the credit rating assigned to the underlying reference
credit. Credit derivatives written on an underlying non-
investment grade reference credit represent greater payment
risk to the Company. The non-investment grade category in
the table above also includes credit derivatives where the
underlying reference entity has been downgraded subsequent
to the inception of the derivative.
The maximum potential amount of future payments under
credit derivative contracts presented in the table above is
based on the notional value of the derivatives. The Company
believes that the notional amount for credit protection sold is
not representative of the actual loss exposure based on
historical experience. This amount has not been reduced by the
value of the reference assets and the related cash flows. In
accordance with most credit derivative contracts, should a
credit event occur, the Company usually is liable for the
difference between the protection sold and the value of the
reference assets. Furthermore, the notional amount for credit
protection sold has not been reduced for any cash collateral
paid to a given counterparty, as such payments would be
calculated after netting all derivative exposures, including any
credit derivatives with that counterparty in accordance with a
related master netting agreement. Due to such netting
processes, determining the amount of collateral that
corresponds to credit derivative exposures alone is not
possible. The Company actively monitors open credit-risk
exposures and manages this exposure by using a variety of
strategies, including purchased credit derivatives, cash
collateral or direct holdings of the referenced assets. This risk
mitigation activity is not captured in the table above.
Credit Risk-Related Contingent Features in Derivatives
Certain derivative instruments contain provisions that require
the Company to either post additional collateral or
immediately settle any outstanding liability balances upon the
occurrence of a specified event related to the credit risk of the
Company. These events, which are defined by the existing
derivative contracts, are primarily downgrades in the credit
ratings of the Company and its affiliates.
The fair value (excluding CVA) of all derivative
instruments with credit risk-related contingent features that
were in a net liability position at both December 31, 2020 and
2019 was $25 billion and $30 billion, respectively. The
Company posted $22 billion and $28 billion as collateral for
this exposure in the normal course of business as of
December 31, 2020 and 2019, respectively.
A downgrade could trigger additional collateral or cash
settlement requirements for the Company and certain
affiliates. In the event that Citigroup and Citibank were
downgraded a single notch by all three major rating agencies
as of December 31, 2020, the Company could be required to
post an additional $0.8 billion as either collateral or settlement
of the derivative transactions. In addition, the Company could
be required to segregate with third-party custodians collateral
previously received from existing derivative counterparties in
the amount of $0.2 billion upon the single notch downgrade,
resulting in aggregate cash obligations and collateral
requirements of approximately $1 billion.
Derivatives Accompanied by Financial Asset Transfers
The Company executes total return swaps that provide it with
synthetic exposure to substantially all of the economic return
of the securities or other financial assets referenced in the
contract. In certain cases, the derivative transaction is
accompanied by the Company’s transfer of the referenced
financial asset to the derivative counterparty, most typically in
response to the derivative counterparty’s desire to hedge, in
whole or in part, its synthetic exposure under the derivative
contract by holding the referenced asset in funded form. In
certain jurisdictions these transactions qualify as sales,
resulting in derecognition of the securities transferred (see
Note 1 to the Consolidated Financial Statements for further
discussion of the related sale conditions for transfers of
financial assets). For a significant portion of the transactions,
the Company has also executed another total return swap
where the Company passes on substantially all of the
economic return of the referenced securities to a different third
party seeking the exposure. In those cases, the Company is not
exposed, on a net basis, to changes in the economic return of
the referenced securities.
These transactions generally involve the transfer of the
Company’s liquid government bonds, convertible bonds or
publicly traded corporate equity securities from the trading
portfolio and are executed with third-party financial
institutions. The accompanying derivatives are typically total
return swaps. The derivatives are cash settled and subject to
ongoing margin requirements.
When the conditions for sale accounting are met, the
Company reports the transfer of the referenced financial asset
as a sale and separately reports the accompanying derivative
transaction. These transactions generally do not result in a gain
256
or loss on the sale of the security, because the transferred
security was held at fair value in the Company’s trading
portfolio. For transfers of financial assets accounted for as a
sale by the Company and for which the Company has retained
substantially all of the economic exposure to the transferred
asset through a total return swap executed with the same
counterparty in contemplation of the initial sale (and still
outstanding), both the asset amounts derecognized and the
gross cash proceeds received as of the date of derecognition
were $2.0 billion and $5.8 billion as of December 31, 2020
and 2019, respectively.
At December 31, 2020, the fair value of these previously
derecognized assets was $2.2 billion. The fair value of the
total return swaps as of December 31, 2020 was $135 million
recorded as gross derivative assets and $7 million recorded as
gross derivative liabilities. At December 31, 2019, the fair
value of these previously derecognized assets was $5.9 billion,
and the fair value of the total return swaps was $117 million
recorded as gross derivative assets and $43 million recorded as
gross derivative liabilities.
The balances for the total return swaps are on a gross
basis, before the application of counterparty and cash
collateral netting, and are included primarily as equity
derivatives in the tabular disclosures in this Note.
257
23. CONCENTRATIONS OF CREDIT RISK
Concentrations of credit risk exist when changes in economic,
industry or geographic factors similarly affect groups of
counterparties whose aggregate credit exposure is material in
relation to Citigroup’s total credit exposure. Although
Citigroup’s portfolio of financial instruments is broadly
diversified along industry, product and geographic lines,
material transactions are completed with other financial
institutions, particularly in the securities trading, derivatives
and foreign exchange businesses.
In connection with the Company’s efforts to maintain a
diversified portfolio, the Company limits its exposure to any
one geographic region, country or individual creditor and
monitors this exposure on a continuous basis. At
December 31, 2020, Citigroup’s most significant
concentration of credit risk was with the U.S. government and
its agencies. The Company’s exposure, which primarily results
from trading assets and investments issued by the U.S.
government and its agencies, amounted to $370.1 billion and
$250.9 billion at December 31, 2020 and 2019, respectively.
The German and Japanese governments and their agencies,
which are rated investment grade by both Moody’s and S&P,
were the next largest exposures. The Company’s exposure to
Germany amounted to $51.8 billion and $29.8 billion at
December 31, 2020 and 2019, respectively, and was composed
of investment securities, loans and trading assets. The
Company’s exposure to Japan amounted to $35.5 billion and
$33.3 billion at December 31, 2020 and 2019, respectively,
and was composed of investment securities, loans and trading
assets.
The Company’s exposure to states and municipalities
amounted to $24.4 billion and $31.4 billion at December 31,
2020 and 2019, respectively, and was composed of trading
assets, investment securities, derivatives and lending activities.
258
24. FAIR VALUE MEASUREMENT
ASC 820-10, Fair Value Measurement, defines fair value,
establishes a consistent framework for measuring fair value
and requires disclosures about fair value measurements. Fair
value is defined as the price that would be received to sell an
asset or paid to transfer a liability in an orderly transaction
between market participants at the measurement date, and
therefore represents an exit price. Among other things, the
standard requires the Company to maximize the use of
observable inputs and minimize the use of unobservable inputs
when measuring fair value.
Under ASC 820-10, the probability of default of a
counterparty is factored into the valuation of derivative and
other positions as well as the impact of Citigroup’s own credit
risk on derivatives and other liabilities measured at fair value.
Fair Value Hierarchy
ASC 820-10 specifies a hierarchy of inputs based on whether
the inputs are observable or unobservable. Observable inputs
are developed using market data and reflect market participant
assumptions, while unobservable inputs reflect the Company’s
market assumptions. These two types of inputs have created
the following fair value hierarchy:
• Level 1: Quoted prices for identical instruments in active
markets.
• Level 2: Quoted prices for similar instruments in active
markets, quoted prices for identical or similar instruments
in markets that are not active, and model-derived
valuations in which all significant inputs and significant
value drivers are observable in active markets.
• Level 3: Valuations derived from valuation techniques in
which one or more significant inputs or significant value
drivers are unobservable.
As required under the fair value hierarchy, the Company
considers relevant and observable market inputs in its
valuations where possible. The frequency of transactions, the
size of the bid-ask spread and the amount of adjustment
necessary when comparing similar transactions are all factors
in determining the relevance of observed prices in those
markets.
Determination of Fair Value
For assets and liabilities carried at fair value, the Company
measures fair value using the procedures set out below,
irrespective of whether the assets and liabilities are measured
at fair value as a result of an election or whether they are
required to be measured at fair value.
When available, the Company uses quoted market prices
from active markets to determine fair value and classifies such
items as Level 1. In some specific cases where a market price
is available, the Company will make use of acceptable
practical expedients (such as matrix pricing) to calculate fair
value, in which case the items are classified as Level 2.
The Company may also apply a price-based methodology,
which utilizes, where available, quoted prices or other market
information obtained from recent trading activity in positions
with the same or similar characteristics to the position being
valued. The frequency and size of transactions are among the
factors that are driven by the liquidity of markets and
determine the relevance of observed prices in those markets. If
relevant and observable prices are available, those valuations
may be classified as Level 2. When that is not the case, and
there are one or more significant unobservable “price” inputs,
then those valuations will be classified as Level 3.
Furthermore, when a quoted price is stale, a significant
adjustment to the price of a similar security is necessary to
reflect differences in the terms of the actual security or loan
being valued, or prices from independent sources are
insufficient to corroborate the valuation, the “price” inputs are
considered unobservable and the fair value measurements are
classified as Level 3.
If quoted market prices are not available, fair value is
based upon internally developed valuation techniques that use,
where possible, current market-based parameters, such as
interest rates, currency rates and option volatilities. Items
valued using such internally generated valuation techniques
are classified according to the lowest level input or value
driver that is significant to the valuation. Thus, an item may be
classified as Level 3 even though there may be some
significant inputs that are readily observable.
Fair value estimates from internal valuation techniques
are verified, where possible, to prices obtained from
independent vendors or brokers. Vendors’ and brokers’
valuations may be based on a variety of inputs ranging from
observed prices to proprietary valuation models, and the
Company assesses the quality and relevance of this
information in determining the estimate of fair value. The
following section describes the valuation methodologies used
by the Company to measure various financial instruments at
fair value, including an indication of the level in the fair value
hierarchy in which each instrument is generally classified.
Where appropriate, the description includes details of the
valuation models, the key inputs to those models and any
significant assumptions.
Market Valuation Adjustments
Generally, the unit of account for a financial instrument is the
individual financial instrument. The Company applies market
valuation adjustments that are consistent with the unit of
account, which does not include adjustment due to the size of
the Company’s position, except as follows. ASC 820-10
permits an exception, through an accounting policy election, to
measure the fair value of a portfolio of financial assets and
financial liabilities on the basis of the net open risk position
when certain criteria are met. Citi has elected to measure
certain portfolios of financial instruments that meet those
criteria, such as derivatives, on the basis of the net open risk
position. The Company applies market valuation adjustments,
including adjustments to account for the size of the net open
risk position, consistent with market participant assumptions.
Valuation adjustments are applied to items classified as
Level 2 or Level 3 in the fair value hierarchy to ensure that the
fair value reflects the price at which the net open risk position
could be exited. These valuation adjustments are based on the
bid/offer spread for an instrument in the market. When Citi
has elected to measure certain portfolios of financial
investments, such as derivatives, on the basis of the net open
259
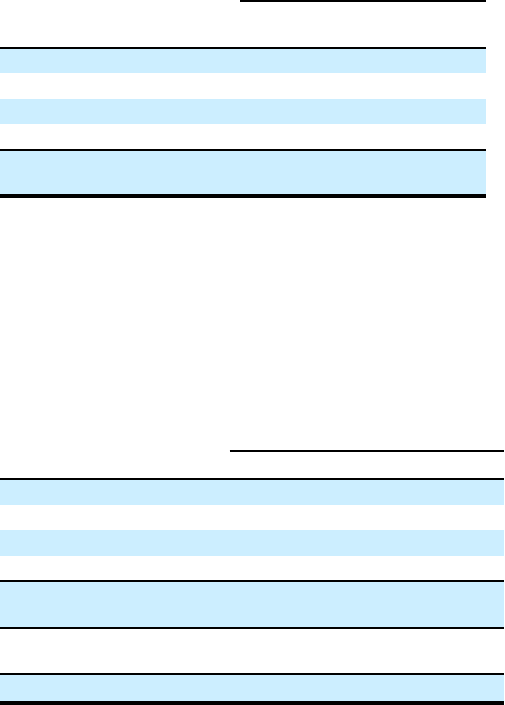
risk position, the valuation adjustment may take into account
the size of the position.
Credit valuation adjustments (CVA) and funding
valuation adjustments (FVA) are applied to the relevant
population of over-the-counter (OTC) derivative instruments
where adjustments to reflect counterparty credit risk, own
credit risk and term funding risk are required to estimate fair
value. This principally includes derivatives with a base
valuation (e.g., discounted using overnight indexed swap
(OIS)) requiring adjustment for these effects, such as
uncollateralized interest rate swaps. The CVA represents a
portfolio-level adjustment to reflect the risk premium
associated with the counterparty’s (assets) or Citi’s (liabilities)
non-performance risk.
The FVA represents a market funding risk premium
inherent in the uncollateralized portion of a derivative
portfolio and in certain collateralized derivative portfolios that
do not include standard credit support annexes (CSAs), such
as where the CSA does not permit the reuse of collateral
received. Citi’s FVA methodology leverages the existing CVA
methodology to estimate a funding exposure profile. The
calculation of this exposure profile considers collateral
agreements in which the terms do not permit the Company to
reuse the collateral received, including where counterparties
post collateral to third-party custodians.
Citi’s CVA and FVA methodology consists of two steps:
• First, the exposure profile for each counterparty is
determined using the terms of all individual derivative
positions and a Monte Carlo simulation or other
quantitative analysis to generate a series of expected cash
flows at future points in time. The calculation of this
exposure profile considers the effect of credit risk
mitigants and sources of funding, including pledged cash
or other collateral and any legal right of offset that exists
with a counterparty through arrangements such as netting
agreements. Individual derivative contracts that are
subject to an enforceable master netting agreement with a
counterparty are aggregated as a netting set for this
purpose, since it is those aggregate net cash flows that are
subject to nonperformance risk. This process identifies
specific, point-in-time future cash flows that are subject to
nonperformance risk and unsecured funding, rather than
using the current recognized net asset or liability as a
basis to measure the CVA and FVA.
• Second, for CVA, market-based views of default
probabilities derived from observed credit spreads in the
credit default swap (CDS) market are applied to the
expected future cash flows determined in step one. Citi’s
own-credit CVA is determined using Citi-specific CDS
spreads for the relevant tenor. Generally, counterparty
CVA is determined using CDS spread indices for each
credit rating and tenor. For certain identified netting sets
where individual analysis is practicable (e.g., exposures to
counterparties with liquid CDSs), counterparty-specific
CDS spreads are used. For FVA, a term structure of future
liquidity spreads is applied to the expected future funding
requirement.
The CVA and FVA are designed to incorporate a market
view of the credit and funding risk, respectively, inherent in
the derivative portfolio. However, most unsecured derivative
instruments are negotiated bilateral contracts and are not
commonly transferred to third parties. Derivative instruments
are normally settled contractually or, if terminated early, are
terminated at a value negotiated bilaterally between the
counterparties. Thus, the CVA and FVA may not be realized
upon a settlement or termination in the normal course of
business. In addition, all or a portion of these adjustments may
be reversed or otherwise adjusted in future periods in the event
of changes in the credit or funding risk associated with the
derivative instruments.
The table below summarizes the CVA and FVA applied
to the fair value of derivative instruments at December 31,
2020 and 2019:
Credit and funding valuation
adjustments
contra-liability (contra-asset)
In millions of dollars
December 31,
2020
December 31,
2019
Counterparty CVA $ (800) $ (705)
Asset FVA (525) (530)
Citigroup (own-credit) CVA 403 341
Liability FVA 67 72
Total CVA—derivative
instruments
(1)
$ (855) $ (822)
(1) FVA is included with CVA for presentation purposes.
The table below summarizes pretax gains (losses) related
to changes in CVA on derivative instruments, net of hedges,
FVA on derivatives and debt valuation adjustments (DVA) on
Citi’s own fair value option (FVO) liabilities for the years
indicated:
Credit/funding/debt valuation
adjustments gain (loss)
In millions of dollars
2020 2019 2018
Counterparty CVA $ (101) $ 149 $ (109)
Asset FVA (95) 13 46
Own-credit CVA 133 (131) 178
Liability FVA (6) (63) 56
Total CVA—derivative
instruments $ (69) $ (32) $ 171
DVA related to own FVO
liabilities
(1)
$ (616) $ (1,473) $ 1,415
Total CVA and DVA
(2)
$ (685) $ (1,505) $ 1,586
(1) See Notes 1, 17 and 19 to the Consolidated Financial Statements.
(2) FVA is included with CVA for presentation purposes.
Securities Purchased Under Agreements to Resell and
Securities Sold Under Agreements to Repurchase
No quoted prices exist for these instruments, so fair value is
determined using a discounted cash flow technique. Cash
flows are estimated based on the terms of the contract, taking
into account any embedded derivative or other features. These
cash flows are discounted using interest rates appropriate to
the maturity of the instrument as well as the nature of the
260
underlying collateral. Generally, when such instruments are
recorded at fair value, they are classified within Level 2 of the
fair value hierarchy, as the inputs used in the valuation are
readily observable. However, certain long-dated positions are
classified within Level 3 of the fair value hierarchy.
Trading Account Assets and Liabilities—Trading Securities
and Trading Loans
When available, the Company uses quoted market prices in
active markets to determine the fair value of trading securities;
such items are classified as Level 1 of the fair value hierarchy.
Examples include government securities and exchange-traded
equity securities.
For bonds and secondary market loans traded over the
counter, the Company generally determines fair value utilizing
valuation techniques, including discounted cash flows, price-
based and internal models. Fair value estimates from these
internal valuation techniques are verified, where possible, to
prices obtained from independent sources, including third-
party vendors. Vendors compile prices from various sources
and may apply matrix pricing for similar bonds or loans where
no price is observable. A price-based methodology utilizes,
where available, quoted prices or other market information
obtained from recent trading activity of assets with similar
characteristics to the bond or loan being valued. The yields
used in discounted cash flow models are derived from the
same price information. Trading securities and loans priced
using such methods are generally classified as Level 2.
However, when a quoted price is stale, a significant
adjustment to the price of a similar security or loan is
necessary to reflect differences in the terms of the actual
security or loan being valued, or prices from independent
sources are insufficient to corroborate valuation, a loan or
security is generally classified as Level 3. The price input used
in a price-based methodology may be zero for a security, such
as a subprime collateralized debt obligation (CDO), that is not
receiving any principal or interest and is not expected to
receive any in the future.
When the Company’s principal exit market for a portfolio
of loans is through securitization, the Company uses the
securitization price as a key input into the fair value of the
loan portfolio. The securitization price is determined from the
assumed proceeds of a hypothetical securitization within the
current market environment, with adjustments made to
account for various costs associated with the process of
securitization. Where such a price verification is possible, loan
portfolios are typically classified as Level 2 in the fair value
hierarchy.
For most of the subprime mortgage backed security
(MBS) exposures, fair value is determined utilizing observable
transactions where available, or other valuation techniques
such as discounted cash flow analysis utilizing valuation
assumptions derived from similar, more observable securities
as market proxies. The valuation of certain asset-backed
security (ABS) CDO positions are inferred through the net
asset value of the underlying assets of the ABS CDO.
Trading Account Assets and Liabilities—Derivatives
Exchange-traded derivatives, measured at fair value using
quoted (i.e., exchange) prices in active markets, where
available, are classified as Level 1 of the fair value hierarchy.
Derivatives without a quoted price in an active market and
derivatives executed over the counter are valued using internal
valuation techniques. These derivative instruments are
classified as either Level 2 or Level 3 depending on the
observability of the significant inputs to the model.
The valuation techniques depend on the type of derivative
and the nature of the underlying instrument. The principal
techniques used to value these instruments are discounted cash
flows and internal models, such as derivative pricing models
(e.g., Black-Scholes and Monte Carlo simulations).
The key inputs depend upon the type of derivative and the
nature of the underlying instrument and include interest rate
yield curves, foreign exchange rates, volatilities and
correlation. The Company typically uses OIS curves as fair
value measurement inputs for the valuation of certain
derivatives.
Investments
The investments category includes available-for-sale debt and
marketable equity securities whose fair values are generally
determined by utilizing similar procedures described for
trading securities above or, in some cases, using vendor
pricing as the primary source.
Also included in investments are nonpublic investments in
private equity and real estate entities. Determining the fair
value of nonpublic securities involves a significant degree of
management judgment, as no quoted prices exist and such
securities do not generally trade. In addition, there may be
transfer restrictions on private equity securities. The
Company’s process for determining the fair value of such
securities utilizes commonly accepted valuation techniques,
including guideline public company analysis and comparable
transactions. In determining the fair value of nonpublic
securities, the Company also considers events such as a
proposed sale of the investee company, initial public offerings,
equity issuances or other observable transactions. Private
equity securities are generally classified as Level 3 of the fair
value hierarchy.
In addition, the Company holds investments in certain
alternative investment funds that calculate NAV per share,
including hedge funds, private equity funds and real estate
funds. Investments in funds are generally classified as non-
marketable equity securities carried at fair value. The fair
values of these investments are estimated using the NAV per
share of the Company’s ownership interest in the funds where
it is not probable that the investment will be realized at a price
other than the NAV. Consistent with the provisions of ASU
2015-07, these investments have not been categorized within
the fair value hierarchy and are not included in the tables
below. See Note 13 to the Consolidated Financial Statements
for additional information.
261
Short-Term Borrowings and Long-Term Debt
Where fair value accounting has been elected, the fair value of
non-structured liabilities is determined by utilizing internal
models using the appropriate discount rate for the applicable
maturity. Such instruments are generally classified as Level 2
of the fair value hierarchy when all significant inputs are
readily observable.
The Company determines the fair value of hybrid
financial instruments, including structured liabilities, using the
appropriate derivative valuation methodology (described
above in “Trading Account Assets and Liabilities—
Derivatives”) given the nature of the embedded risk profile.
Such instruments are classified as Level 2 or Level 3
depending on the observability of significant inputs to the
model.
262

Items Measured at Fair Value on a Recurring Basis
The following tables present for each of the fair value
hierarchy levels the Company’s assets and liabilities that are
measured at fair value on a recurring basis at December 31,
2020 and 2019. The Company may hedge positions that have
been classified in the Level 3 category with other financial
instruments (hedging instruments) that may be classified as
Level 3, but also with financial instruments classified as
Level 1 or Level 2 of the fair value hierarchy. The effects of
these hedges are presented gross in the following tables:
Fair Value Levels
In millions of dollars at December 31, 2020
Level 1 Level 2 Level 3
Gross
inventory Netting
(1)
Net
balance
Assets
Securities borrowed and purchased under agreements to resell $ — $ 335,073 $ 320 $ 335,393 $ (150,189) $ 185,204
Trading non-derivative assets
Trading mortgage-backed securities
U.S. government-sponsored agency guaranteed — 42,903 27 42,930 — 42,930
Residential — 391 340 731 — 731
Commercial — 893 136 1,029 — 1,029
Total trading mortgage-backed securities $ — $ 44,187 $ 503 $ 44,690 $ — $ 44,690
U.S. Treasury and federal agency securities $ 64,529 $ 2,269 $ — $ 66,798 $ — $ 66,798
State and municipal — 1,224 94 1,318 — 1,318
Foreign government 68,195 15,143 51 83,389 — 83,389
Corporate 1,607 18,840 375 20,822 — 20,822
Equity securities 54,117 12,289 73 66,479 — 66,479
Asset-backed securities — 776 1,606 2,382 — 2,382
Other trading assets
(2)
— 11,295 945 12,240 — 12,240
Total trading non-derivative assets $ 188,448 $ 106,023 $ 3,647 $ 298,118 $ — $ 298,118
Trading derivatives
Interest rate contracts $ 42 $ 238,026 $ 3,393 $ 241,461
Foreign exchange contracts 2 155,994 674 156,670
Equity contracts 66 48,362 2,091 50,519
Commodity contracts — 13,546 992 14,538
Credit derivatives — 8,634 1,155 9,789
Total trading derivatives $ 110 $ 464,562 $ 8,305 $ 472,977
Cash collateral paid
(3)
$ 32,778
Netting agreements $ (364,879)
Netting of cash collateral received (63,915)
Total trading derivatives $ 110 $ 464,562 $ 8,305 $ 505,755 $ (428,794) $ 76,961
Investments
Mortgage-backed securities
U.S. government-sponsored agency guaranteed $ — $ 43,888 $ 30 $ 43,918 $ — $ 43,918
Residential — 571 — 571 — 571
Commercial — 50 — 50 — 50
Total investment mortgage-backed securities $ — $ 44,509 $ 30 $ 44,539 $ — $ 44,539
U.S. Treasury and federal agency securities $ 146,032 $ 172 $ — $ 146,204 $ — $ 146,204
State and municipal — 2,885 834 3,719 — 3,719
Foreign government 77,056 47,644 268 124,968 — 124,968
Corporate 6,326 4,114 60 10,500 — 10,500
Marketable equity securities 287 228 — 515 — 515
Asset-backed securities — 277 1 278 — 278
Other debt securities — 4,876 — 4,876 — 4,876
Non-marketable equity securities
(4)
— 50 349 399 — 399
Total investments $ 229,701 $ 104,755 $ 1,542 $ 335,998 $ — $ 335,998
Table continues on the next page.
263

In millions of dollars at December 31, 2020
Level 1 Level 2 Level 3
Gross
inventory Netting
(1)
Net
balance
Loans $ — $ 4,869 $ 1,985 $ 6,854 $ — $ 6,854
Mortgage servicing rights — — 336 336 — 336
Non-trading derivatives and other financial assets measured on
a recurring basis $ 6,230 $ 8,383 $ — $ 14,613 $ — $ 14,613
Total assets $ 424,489
$ 1,023,665
$ 16,135
$ 1,497,067 $ (578,983) $ 918,084
Total as a percentage of gross assets
(5)
29.0 % 69.9 % 1.1 %
Liabilities
Interest-bearing deposits $ — $ 1,752 $ 206 $ 1,958 $ — $ 1,958
Securities loaned and sold under agreements to repurchase — 156,644 631 157,275 (97,069) 60,206
Trading account liabilities
Securities sold, not yet purchased 85,353 14,477 214 100,044 — 100,044
Other trading liabilities — — 26 26 — 26
Total trading liabilities $ 85,353 $ 14,477 $ 240 $ 100,070 $ — $ 100,070
Trading derivatives
Interest rate contracts $ 25 $ 220,607 $ 1,779 $ 222,411
Foreign exchange contracts 3 155,441 622 156,066
Equity contracts 53 58,212 5,304 63,569
Commodity contracts — 17,393 700 18,093
Credit derivatives — 9,022 1,107 10,129
Total trading derivatives $ 81 $ 460,675 $ 9,512 $ 470,268
Cash collateral received
(6)
$ 8,196
Netting agreements $ (364,879)
Netting of cash collateral paid (45,628)
Total trading derivatives $ 81 $ 460,675 $ 9,512 $ 478,464 $ (410,507) $ 67,957
Short-term borrowings $ — $ 4,464 $ 219 $ 4,683 $ — $ 4,683
Long-term debt — 41,853 25,210 67,063 — 67,063
Total non-trading derivatives and other financial liabilities
measured on a recurring basis $ 6,762 $ 72 $ 1 $ 6,835 $ — $ 6,835
Total liabilities $ 92,196 $ 679,937
$ 36,019
$ 816,348 $ (507,576) $ 308,772
Total as a percentage of gross liabilities
(5)
11.4 % 84.1 % 4.5 %
(1) Represents netting of (i) the amounts due under securities purchased under agreements to resell and the amounts owed under securities sold under agreements to
repurchase and (ii) derivative exposures covered by a qualifying master netting agreement and cash collateral offsetting.
(2) Includes positions related to investments in unallocated precious metals, as discussed in Note 25 to the Consolidated Financial Statements. Also includes physical
commodities accounted for at the lower of cost or fair value and unfunded credit products.
(3) Reflects the net amount of $78,406 million of gross cash collateral paid, of which $45,628 million was used to offset trading derivative liabilities.
(4) Amounts exclude $0.2 billion of investments measured at net asset value (NAV) in accordance with ASU No. 2015-07, Fair Value Measurement (Topic 820):
Disclosures for Investments in Certain Entities That Calculate Net Asset Value per Share (or Its Equivalent).
(5) Because the amount of the cash collateral paid/received has not been allocated to the Level 1, 2 and 3 subtotals, these percentages are calculated based on total
assets and liabilities measured at fair value on a recurring basis, excluding the cash collateral paid/received on derivatives.
(6) Reflects the net amount of $72,111 million of gross cash collateral received, of which $63,915 million was used to offset trading derivative assets.
264

Fair Value Levels
In millions of dollars at December 31, 2019
Level 1 Level 2 Level 3
Gross
inventory Netting
(1)
Net
balance
Assets
Securities borrowed and purchased under agreements to resell $ — $ 254,253 $ 303 $ 254,556 $ (101,363)
$ 153,193
Trading non-derivative assets
Trading mortgage-backed securities
U.S. government-sponsored agency guaranteed — 27,661 10 27,671 — 27,671
Residential — 573 123 696 — 696
Commercial — 1,632 61 1,693 — 1,693
Total trading mortgage-backed securities $ — $ 29,866 $ 194 $ 30,060 $ — $ 30,060
U.S. Treasury and federal agency securities $ 26,159 $ 3,736 $ — $ 29,895 $ — $ 29,895
State and municipal — 2,573 64 2,637 — 2,637
Foreign government 50,948 20,326 52 71,326 — 71,326
Corporate 1,332 17,246 313 18,891 — 18,891
Equity securities 41,663 9,878 100 51,641 — 51,641
Asset-backed securities — 1,539 1,177 2,716 — 2,716
Other trading assets
(2)
74 11,412 555 12,041 — 12,041
Total trading non-derivative assets $ 120,176 $ 96,576 $ 2,455 $ 219,207 $ —
$ 219,207
Trading derivatives
Interest rate contracts $ 7 $ 196,493 $ 1,168 $ 197,668
Foreign exchange contracts 1 107,022 547 107,570
Equity contracts 83 28,148 240 28,471
Commodity contracts — 13,498 714 14,212
Credit derivatives — 9,960 449 10,409
Total trading derivatives $ 91 $ 355,121 $ 3,118 $ 358,330
Cash collateral paid
(3)
$ 17,926
Netting agreements $ (274,970)
Netting of cash collateral received (44,353)
Total trading derivatives $ 91 $ 355,121 $ 3,118 $ 376,256 $ (319,323) $ 56,933
Investments
Mortgage-backed securities
U.S. government-sponsored agency guaranteed $ — $ 35,198 $ 32 $ 35,230 $ — $ 35,230
Residential — 793 — 793 — 793
Commercial — 74 — 74 — 74
Total investment mortgage-backed securities $ — $ 36,065 $ 32 $ 36,097 $ — $ 36,097
U.S. Treasury and federal agency securities $ 106,103 $ 5,315 $ — $ 111,418 $ —
$ 111,418
State and municipal — 4,355 623 4,978 — 4,978
Foreign government 69,957 41,196 96 111,249 — 111,249
Corporate 5,150 6,076 45 11,271 — 11,271
Marketable equity securities 87 371 — 458 — 458
Asset-backed securities — 500 22 522 — 522
Other debt securities — 4,730 — 4,730 — 4,730
Non-marketable equity securities
(4)
— 93 441 534 — 534
Total investments $ 181,297 $ 98,701 $ 1,259 $ 281,257 $ —
$ 281,257
Table continues on the next page.
265

In millions of dollars at December 31, 2019
Level 1 Level 2 Level 3
Gross
inventory Netting
(1)
Net
balance
Loans $ — $ 3,683 $ 402 $ 4,085 $ — $ 4,085
Mortgage servicing rights — — 495 495 — 495
Non-trading derivatives and other financial assets measured on a
recurring basis $ 5,628 $ 7,201 $ 1 $ 12,830 $ — $ 12,830
Total assets $ 307,192 $ 815,535 $ 8,033 $ 1,148,686 $ (420,686)
$ 728,000
Total as a percentage of gross assets
(5)
27.2 % 72.1 % 0.7 %
Liabilities
Interest-bearing deposits $ — $ 2,104 $ 215 $ 2,319 $ — $ 2,319
Securities loaned and sold under agreements to repurchase — 111,567 757 112,324 (71,673) 40,651
Trading account liabilities
Securities sold, not yet purchased 60,429 11,965 48 72,442 — 72,442
Other trading liabilities — 24 — 24 — 24
Total trading liabilities $ 60,429 $ 11,989 $ 48 $ 72,466 $ — $ 72,466
Trading account derivatives
Interest rate contracts $ 8 $ 176,480 $ 1,167 $ 177,655
Foreign exchange contracts — 110,180 552 110,732
Equity contracts 144 28,506 1,836 30,486
Commodity contracts — 16,542 773 17,315
Credit derivatives — 10,233 505 10,738
Total trading derivatives $ 152 $ 341,941 $ 4,833 $ 346,926
Cash collateral received
(6)
$ 14,391
Netting agreements $ (274,970)
Netting of cash collateral paid (38,919)
Total trading derivatives $ 152 $ 341,941 $ 4,833 $ 361,317 $ (313,889) $ 47,428
Short-term borrowings $ — $ 4,933 $ 13 $ 4,946 $ — $ 4,946
Long-term debt — 38,614 17,169 55,783 — 55,783
Non-trading derivatives and other financial liabilities measured on
a recurring basis $ 6,280 $ 63 $ — $ 6,343 $ — $ 6,343
Total liabilities $ 66,861 $ 511,211
$ 23,035
$ 615,498 $ (385,562)
$ 229,936
Total as a percentage of gross liabilities
(5)
11.1 % 85.0 % 3.8 %
(1) Represents netting of (i) the amounts due under securities purchased under agreements to resell and the amounts owed under securities sold under agreements to
repurchase and (ii) derivative exposures covered by a qualifying master netting agreement and cash collateral offsetting.
(2) Includes positions related to investments in unallocated precious metals, as discussed in Note 25 to the Consolidated Financial Statements. Also includes physical
commodities accounted for at the lower of cost or fair value and unfunded credit products.
(3) Reflects the net amount of $56,845 million of gross cash collateral paid, of which $38,919 million was used to offset trading derivative liabilities.
(4) Amounts exclude $0.2 billion of investments measured at NAV in accordance with ASU 2015-07, Fair Value Measurement (Topic 820): Disclosures for
Investments in Certain Entities That Calculate Net Asset Value per Share (or Its Equivalent).
(5) Because the amount of the cash collateral paid/received has not been allocated to the Level 1, 2 and 3 subtotals, these percentages are calculated based on total
assets and liabilities measured at fair value on a recurring basis, excluding the cash collateral paid/received on derivatives.
(6) Reflects the net amount of $58,744 million of gross cash collateral received, of which $44,353 million was used to offset trading derivative assets.
266
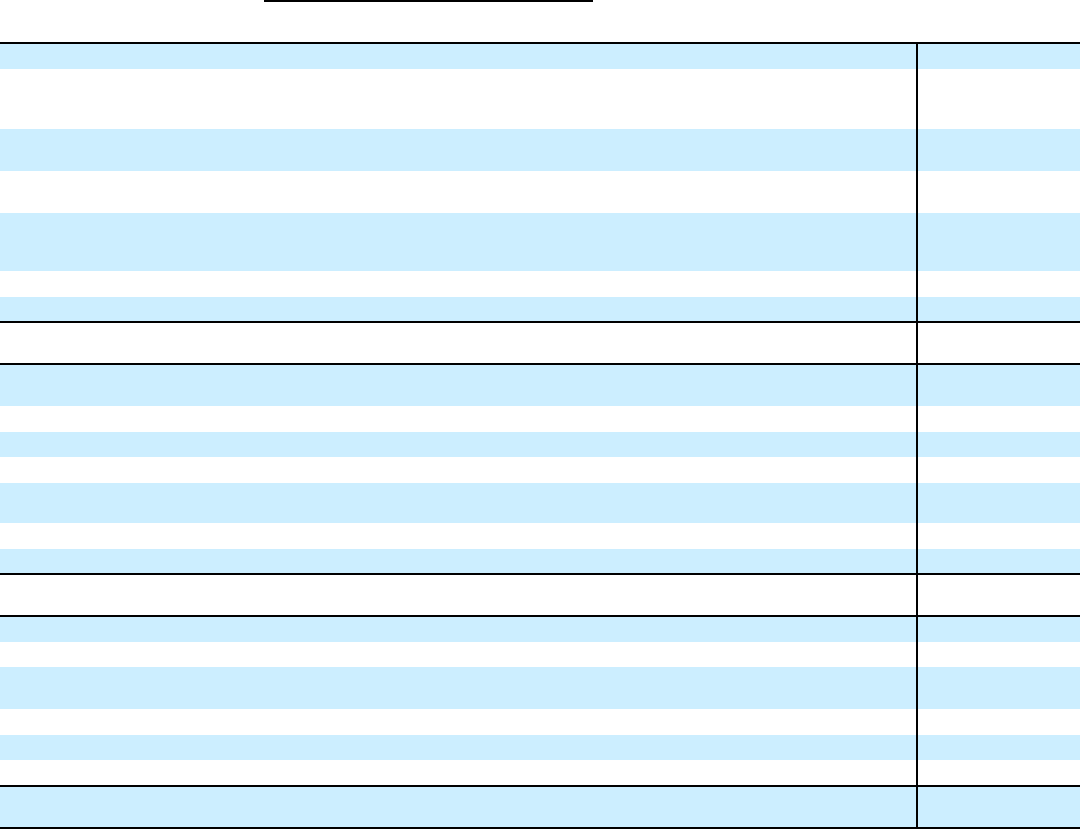
Changes in Level 3 Fair Value Category
The following tables present the changes in the Level 3 fair
value category for the years ended December 31, 2020 and
2019. The gains and losses presented below include changes in
the fair value related to both observable and unobservable
inputs.
The Company often hedges positions with offsetting
positions that are classified in a different level. For example,
the gains and losses for assets and liabilities in the Level 3
category presented in the tables below do not reflect the effect
of offsetting losses and gains on hedging instruments that may
be classified in the Level 1 and Level 2 categories. In addition,
the Company hedges items classified in the Level 3 category
with instruments also classified in Level 3 of the fair value
hierarchy. The hedged items and related hedges are presented
gross in the following tables:
Level 3 Fair Value Rollforward
Net realized/unrealized
gains (losses) included in
(1)
Transfers
Unrealized
gains
(losses)
still held
(3)
In millions of dollars
Dec. 31,
2019
Principal
transactions Other
(1)(2)
into
Level 3
out of
Level 3 Purchases Issuances Sales Settlements
Dec. 31,
2020
Assets 0
Securities borrowed and
purchased under
agreements to resell $ 303 $ 23 $ — $ — $ — $ 194 $ — $ — $ (200) $ 320 $ 43
Trading non-derivative
assets
Trading mortgage-
backed securities
U.S. government-
sponsored agency
guaranteed 10 (79) — 21 (11) 392 — (306) — 27 (1)
Residential 123 79 — 234 (68) 486 — (514) — 340 (20)
Commercial 61 — — 162 (35) 174 — (226) — 136 (14)
Total trading mortgage-
backed securities $ 194 $ — $ — $ 417 $ (114) $ 1,052 $ — $ (1,046) $ — $ 503 $ (35)
U.S. Treasury and
federal agency securities $ — $ — $ — $ — $ — $ — $ — $ — $ — $ — $ —
State and municipal 64 2 — 33 (3) 62 — (64) — 94 4
Foreign government 52 (35) — 9 (1) 169 — (143) — 51 (7)
Corporate 313 246 — 211 (136) 770 — (1,023) (6) 375 (37)
Marketable equity
securities 100 (16) — 43 (2) 240 — (292) — 73 (11)
Asset-backed securities 1,177 (105) — 677 (131) 1,406 — (1,418) — 1,606 (248)
Other trading assets 555 315 — 471 (343) 387 19 (440) (19) 945 (56)
Total trading non-
derivative assets $ 2,455 $ 407 $ — $ 1,861 $ (730) $ 4,086 $ 19 $ (4,426) $ (25) $ 3,647 $ (390)
Trading derivatives, net
(4)
Interest rate contracts $ 1 $ 429 $ — $ 1,644 $ 16 $ 41 $ 134 $ (34) $ (617) $ 1,614 $ 161
Foreign exchange
contracts (5) 105 — (61) 48 74 — (55) (54) 52 130
Equity contracts (1,596) (536) — (519) 378 35 — (886) (89) (3,213) (3,868)
Commodity contracts (59) (1) — 99 (108) 101 — (61) 321 292 407
Credit derivatives (56) 123 — 173 (334) — — — 142 48 (136)
Total trading derivatives,
net
(4)
$ (1,715) $ 120 $ — $ 1,336 $ — $ 251 $ 134 $ (1,036) $ (297) $ (1,207) $ (3,306)
267
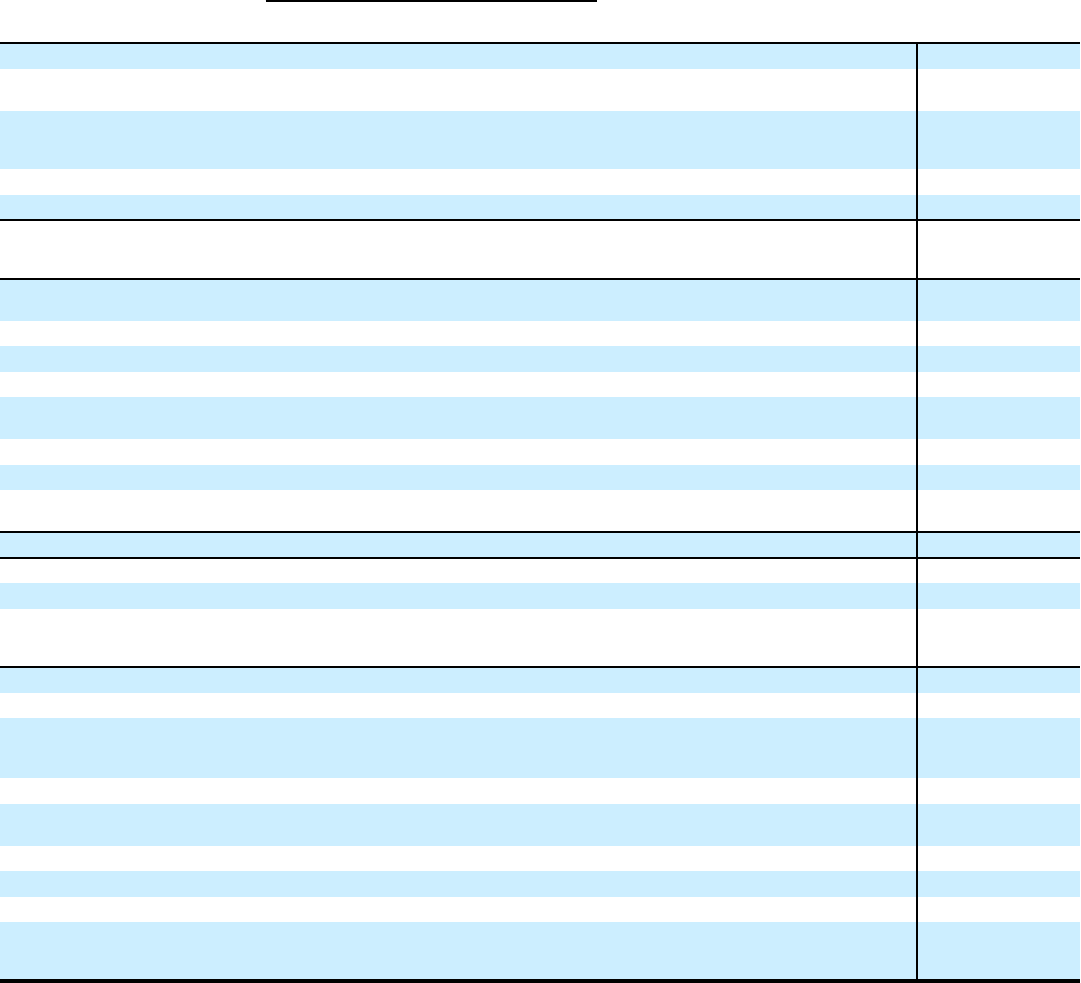
Net realized/unrealized
gains (losses) included in
(1)
Transfers
Unrealized
gains
(losses)
still held
(3)
In millions of dollars
Dec. 31,
2019
Principal
transactions Other
(1)(2)
into
Level 3
out of
Level 3 Purchases Issuances Sales Settlements
Dec. 31,
2020
Investments
Mortgage-backed
securities
U.S. government-
sponsored agency
guaranteed $ 32 $ — $ (5) $ 2 $ — $ 1 $ — $ — $ — $ 30 $ (104)
Residential — — 76 — — — — (76) — — 5
Commercial — — — — — — — — — — —
Total investment
mortgage-backed
securities $ 32 $ — $ 71 $ 2 $ — $ 1 $ — $ (76) $ — $ 30 $ (99)
U.S. Treasury and
federal agency securities $ — $ — $ — $ — $ — $ — $ — $ — $ — $ — $ —
State and municipal 623 — (3) 322 (131) 121 — (98) — 834 (20)
Foreign government 96 — 11 27 (64) 381 — (183) — 268 (4)
Corporate 45 — 6 49 (152) 162 — (50) — 60 —
Marketable equity
securities — — (1) 1 — — — — — — —
Asset-backed securities 22 — (1) — — — — (20) — 1 (4)
Other debt securities — — — — — — — — — — —
Non-marketable equity
securities 441 — (35) — (2) 2 3 (3) (57) 349 10
Total investments $ 1,259 $ — $ 48 $ 401 $ (349) $ 667 $ 3 $ (430) $ (57) $ 1,542 $ (117)
Loans $ 402 $ — $ 1,143 $ 451 $ (6) $ — $ — $ — $ (5) $ 1,985 $ 1,424
Mortgage servicing rights 495 — (204) — — — 123 — (78) 336 (180)
Other financial assets
measured on a recurring
basis 1 — — — — — — (1) — — —
Liabilities
Interest-bearing deposits $ 215 $ — $ 11 $ 278 $ (152) $ — $ 34 $ — $ (158) $ 206 $ (142)
Securities loaned and sold
under agreements to
repurchase 757 5 — — — — — — (121) 631 (18)
Trading account liabilities
Securities sold, not yet
purchased 48 (102) — 271 (17) — — 10 (200) 214 (163)
Other trading liabilities — 9 — 35 — — — — — 26 23
Short-term borrowings 13 78 — 220 (6) — 86 — (16) 219 (91)
Long-term debt 17,169 (1,489) — 6,553 (2,615) — 10,270 — (7,656) 25,210 (1,679)
Other financial liabilities
measured on a recurring
basis — — — — — — 3 — (2) 1 —
(1) Net realized/unrealized gains (losses) are presented as increase (decrease) to Level 3 assets, and as (increase) decrease to Level 3 liabilities. Changes in fair value
of available-for-sale debt securities are recorded in AOCI, unless related to credit impairment, while gains and losses from sales are recorded in Realized gains
(losses) from sales of investments in the Consolidated Statement of Income.
(2) Unrealized gains (losses) on MSRs are recorded in Other revenue in the Consolidated Statement of Income.
(3) Represents the amount of total gains or losses for the period, included in earnings (and AOCI for changes in fair value of available-for-sale debt securities and
DVA on fair value option liabilities), attributable to the change in fair value relating to assets and liabilities classified as Level 3 that are still held at December 31,
2020.
(4) Total Level 3 trading derivative assets and liabilities have been netted in these tables for presentation purposes only.
268
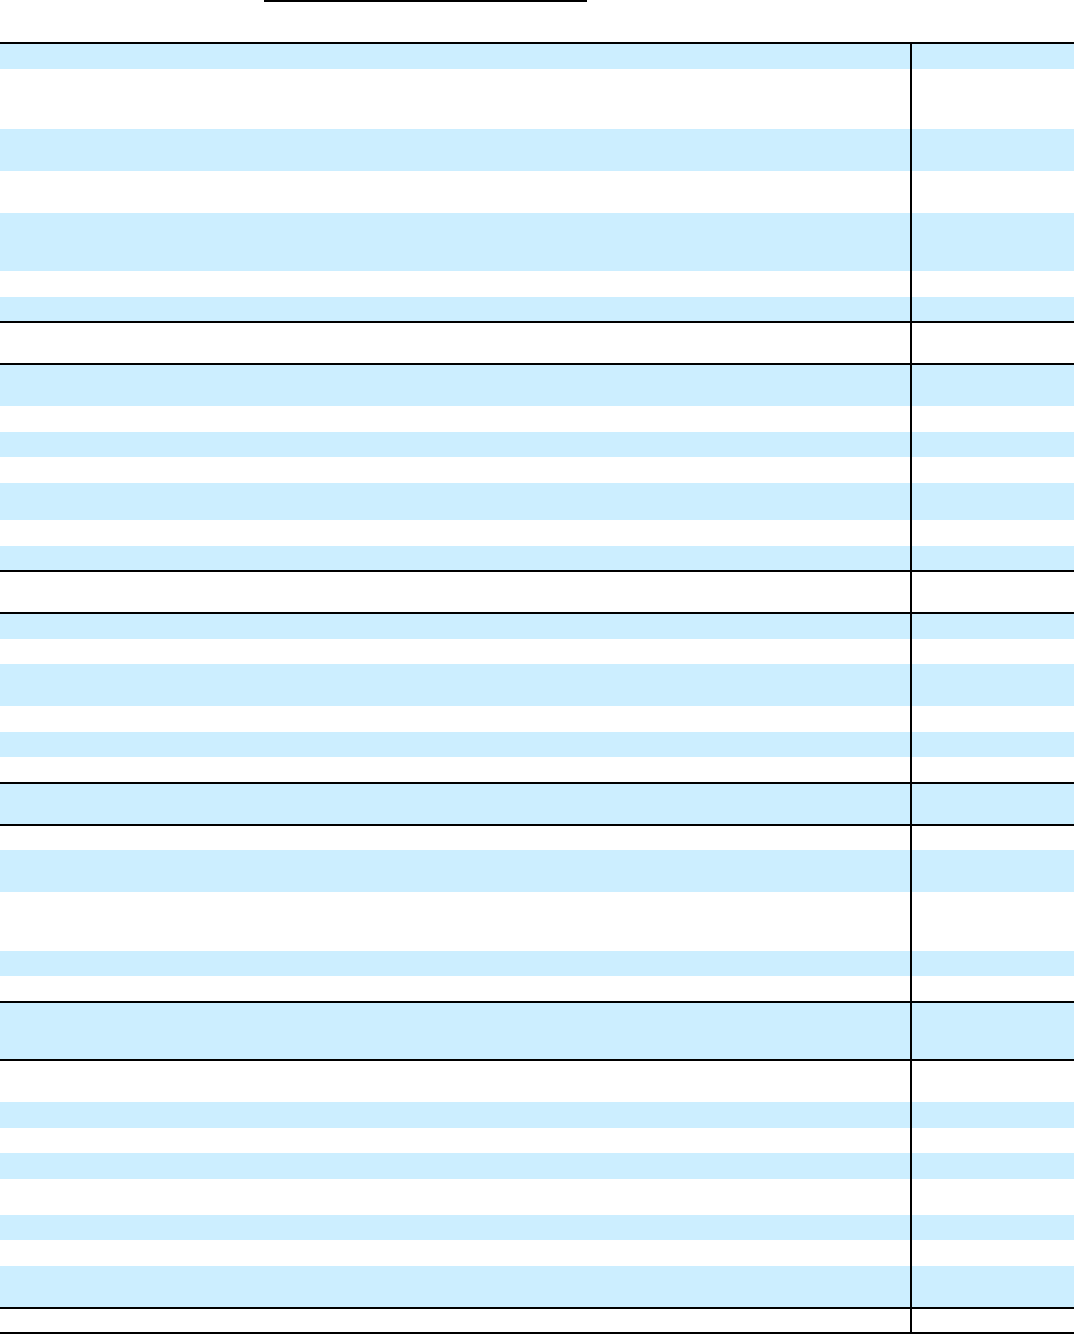
Net realized/unrealized
gains (losses) included in
(1)
Transfers
Unrealized
gains
(losses)
still held
(3)
In millions of dollars
Dec. 31,
2018
Principal
transactions Other
(1)(2)
into
Level 3
out of
Level 3 Purchases Issuances Sales Settlements
Dec. 31,
2019
Assets
Securities borrowed and
purchased under
agreements to resell $ 115 $ (5) $ — $ 191 $ (4) $ 195 $ — $ — $ (189) $ 303 $ 3
Trading non-derivative
assets
Trading mortgage-
backed securities
U.S. government-
sponsored agency
guaranteed 156 — — 54 (72) 160 (1) (287) — 10 1
Residential 268 15 — 86 (80) 227 — (393) — 123 10
Commercial 77 14 — 150 (105) 136 — (211) — 61 (4)
Total trading mortgage-
backed securities $ 501 $ 29 $ — $ 290 $ (257) $ 523 $ (1) $ (891) $ — $ 194 $ 7
U.S. Treasury and
federal agency securities $ 1 $ (9) $ — $ — $ — $ 20 $ — $ (11) $ (1) $ — $ —
State and municipal 200 (2) — 1 (19) 2 — (118) — 64 (2)
Foreign government 31 28 — 12 (7) 88 — (100) — 52 1
Corporate 360 284 — 213 (86) 323 (29) (742) (10) 313 (11)
Marketable equity
securities 153 (21) — 13 (19) 117 — (143) — 100 (51)
Asset-backed securities 1,484 (65) — 51 (127) 738 — (904) — 1,177 29
Other trading assets 818 (52) — 97 (283) 598 36 (630) (29) 555 (257)
Total trading non-
derivative assets $ 3,548 $ 192 $ — $ 677 $ (798) $ 2,409 $ 6 $ (3,539) $ (40) $ 2,455 $ (284)
Trading derivatives, net
(4)
Interest rate contracts $ (154) $ 116 $ — $ (129) $ 172 $ 154 $ 45 $ (1) $ (202) $ 1 $ 2,194
Foreign exchange
contracts (6) (73) — 152 (97) 113 — (114) 20 (5) (134)
Equity contracts (784) (425) — (213) 274 (111) (147) (8) (182) (1,596) (422)
Commodity contracts (18) (121) — (15) (15) 252 — (133) (9) (59) (33)
Credit derivatives 61 (412) — (114) 204 — — 14 191 (56) (289)
Total trading derivatives,
net
(4)
$ (901) $ (915) $ — $ (319) $ 538 $ 408 $ (102) $ (242) $ (182) $ (1,715) $ 1,316
Investments
Mortgage-backed
securities
U.S. government-
sponsored agency
guaranteed $ 32 $ — $ — $ — $ — $ — $ — $ — $ — $ 32 $ (1)
Residential — — — — — — — — — — —
Commercial — — — — — — — — — — —
Total investment
mortgage-backed
securities $ 32 $ — $ — $ — $ — $ — $ — $ — $ — $ 32 $ (1)
U.S. Treasury and
federal agency securities $ — $ — $ — $ — $ — $ — $ — $ — $ — $ — $ —
State and municipal 708 — 86 14 (318) 430 — (297) — 623 82
Foreign government 68 — 2 — — 145 — (119) — 96 2
Corporate 156 — (14) 3 (94) — — (6) — 45 —
Marketable equity
securities — — — — — — — — — — —
Asset-backed securities 187 — (11) 122 (612) 550 — (214) — 22 13
Other debt securities — — — — — — — — — — —
Non-marketable equity
securities 586 — (11) 39 (1) 11 — (151) (32) 441 16
Total investments $ 1,737 $ — $ 52 $ 178 $ (1,025) $ 1,136 $ — $ (787) $ (32) $ 1,259 $ 112
Table continues on the next page.
269
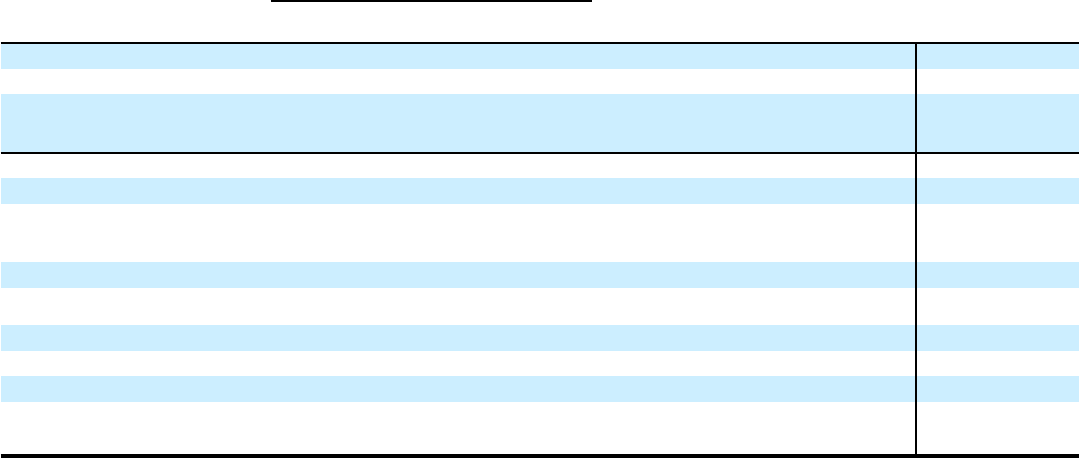
Net realized/unrealized
gains (losses) included in
(1)
Transfers
Unrealized
gains
(losses)
still held
(3)
In millions of dollars
Dec. 31,
2018
Principal
transactions Other
(1)(2)
into
Level 3
out of
Level 3 Purchases Issuances Sales Settlements
Dec. 31,
2019
Loans $ 277 $ — $ 192 $ 148 $ (189) $ 16 $ — $ (40) $ (2) $ 402 $ 186
Mortgage servicing rights 584 — (84) — — — 70 — (75) 495 (68)
Other financial assets
measured on a recurring
basis — — 96 6 (2) 2 32 (21) (112) 1 18
Liabilities
Interest-bearing deposits $ 495 $ — $ (16) $ 10 $ (783) $ — $ 843 $ — $ (366) $ 215 $ (25)
Securities loaned and sold
under agreements to
repurchase 983 121 — 1 4 — — (168) 58 757 (26)
Trading account liabilities
Securities sold, not yet
purchased 586 122 — 68 (443) 19 — (12) (48) 48 3
Other trading liabilities — — — — — — — — — — —
Short-term borrowings 37 32 — 13 (42) — 168 — (131) 13 (1)
Long-term debt 12,570 (1,899) — 3,304 (4,411) — 6,766 — (2,958) 17,169 (1,411)
Other financial liabilities
measured on a recurring
basis — — 4 5 — — 4 — (5) — —
(1) Net realized/unrealized gains (losses) are presented as increase (decrease) to Level 3 assets, and as (increase) decrease to Level 3 liabilities. Changes in fair value
of available-for-sale debt securities are recorded in AOCI, unless related to credit impairment, while gains and losses from sales are recorded in Realized gains
(losses) from sales of investments in the Consolidated Statement of Income.
(2) Unrealized gains (losses) on MSRs are recorded in Other revenue in the Consolidated Statement of Income.
(3) Represents the amount of total gains or losses for the period, included in earnings (and AOCI for changes in fair value of available-for-sale debt securities and
DVA on fair value option liabilities), attributable to the change in fair value relating to assets and liabilities classified as Level 3 that are still held at December 31,
2019.
(4) Total Level 3 derivative assets and liabilities have been netted in these tables for presentation purposes only.
Level 3 Fair Value Rollforward
The following were the significant Level 3 transfers for the
period December 31, 2019 to December 31, 2020:
• During the 12 months ended December 31, 2020,
transfers of Interest rate contracts of $1.6 billion from
Level 2 to Level 3 were due to interest rate option
volatility becoming an unobservable and/or significant
input relative to the overall valuation of inflation and
other interest rate derivatives.
• During the 12 months ended December 31, 2020,
$6.6 billion of Long-term debt containing embedded
derivatives was transferred from Level 2 to Level 3, as a
result of interest rate option volatility, equity correlation
and credit derivative inputs becoming unobservable and/
or significant input relative to the overall valuation of
certain structured long-term debt products. In other
instances, market changes resulted in unobservable
volatility inputs becoming insignificant to the overall
valuation of the instrument (e.g., when an option becomes
deep-in or deep-out of the money). This has resulted in
$2.6 billion of certain structured long-term debt products
being transferred from Level 3 to Level 2 during the 12
months ended December 31, 2020.
The following were the significant Level 3 transfers for
the period December 31, 2018 to December 31, 2019:
• Transfers of Long-term debt of $3.3 billion from Level 2
to Level 3, and of $4.4 billion from Level 3 to Level 2,
mainly related to structured debt, reflecting changes in the
significance of unobservable inputs as well as certain
underlying market inputs becoming less or more
observable.
270

Valuation Techniques and Inputs for Level 3 Fair
Value Measurements
The Company’s Level 3 inventory consists of both cash
instruments and derivatives of varying complexity. The
valuation methodologies used to measure the fair value of
these positions include discounted cash flow analysis, internal
models and comparative analysis. A position is classified
within Level 3 of the fair value hierarchy when one or more
unobservable inputs are used that are considered significant to
its valuation. The specific reason an input is deemed
unobservable varies; for example, at least one significant
input to the pricing model is not observable in the market, at
least one significant input has been adjusted to make it more
representative of the position being valued or the price quote
available does not reflect sufficient trading activities.
The following tables present the valuation techniques
covering the majority of Level 3 inventory and the most
significant unobservable inputs used in Level 3 fair value
measurements. Differences between this table and amounts
presented in the Level 3 Fair Value Rollforward table
represent individually immaterial items that have been
measured using a variety of valuation techniques other than
those listed.
As of December 31, 2020
Fair value
(1)
(in millions) Methodology Input Low
(2)(3)
High
(2)(3)
Weighted
average
(4)
Assets
Securities borrowed and
purchased under agreements to
resell $ 320 Model-based Credit spread 15 bps 15 bps 15 bps
Interest rate 0.30 % 0.35 % 0.32 %
Mortgage-backed securities $ 344 Price-based Price $ 30 $ 111 $ 80
168 Yield analysis Yield 2.63 % 21.80 % 10.13 %
State and municipal, foreign
government, corporate and
other debt securities $ 1,566 Price-based Price $ — $ 2,265 $ 90
852 Model-based Credit spread 35 bps 375 bps 226 bps
Marketable equity securities
(5)
$ 36 Model-based Price $ — $ 31,000 $ 5,132
36 Price-based WAL 1.48 years 1.48 years 1.48 years
Recovery
(in millions)
$ 5,733 $ 5,733 $ 5,733
Asset-backed securities $ 863 Price-based Price $ 2 $ 157 $ 59
744 Yield analysis Yield 3.77 % 21.77 % 9.01 %
Non-marketable equities $ 205 Comparables analysis Illiquidity discount 10.00 % 45.00 % 25.29 %
PE ratio 13.60x 28.00x 22.83x
142 Price-based Price $ 136 $ 2,041 $ 1,647
EBITDA multiples 3.30x 36.70x 15.10x
Adjustment factor 0.20x 0.61x 0.25x
Appraised value
(in thousands)
$ 287 $ 39,745 $ 21,754
Revenue multiple 2.70x 28.00x 8.92x
Derivatives—gross
(6)
Interest rate contracts (gross) $ 5,143 Model-based Inflation volatility 0.27 % 2.36 % 0.78 %
IR normal volatility 0.11 % 0.73 % 0.52 %
Foreign exchange contracts
(gross) $ 1,296 Model-based FX volatility 1.70 % 12.63 % 5.41 %
Contingent event 100.00 % 100.00 % 100.00 %
Interest rate 0.84 % 84.09 % 17.55 %
IR normal volatility 0.11 % 0.52 % 0.46 %
IR-FX correlation 40.00 % 60.00 % 50.00 %
IR-IR correlation (21.71) % 40.00 % 38.09 %
Equity contracts (gross)
(7)
$ 7,330 Model-based Equity volatility 5.00 % 91.43 % 42.74 %
Forward price 65.88 % 105.20 % 91.82 %
Commodity and other contracts
(gross) $ 1,636 Model-based
Commodity
correlation (44.92) % 95.91 % 70.60 %
Commodity volatility 0.16 % 80.17 % 23.72 %
Forward price 15.40 % 262.00 % 98.53 %
Credit derivatives (gross) $ 1,854 Model-based Credit spread 3.50 bps 352.35 bps 99.89 bps
271

As of December 31, 2020
Fair value
(1)
(in millions) Methodology Input Low
(2)(3)
High
(2)(3)
Weighted
average
(4)
408 Price-based Recovery rate 20.00 % 60.00 % 41.60 %
Credit correlation 25.00 % 80.00 % 43.36 %
Upfront points — % 107.20 % 48.10 %
Loans and leases $ 1,804 Model-based Equity volatility 24.65 % 83.09 % 58.23 %
Mortgage servicing rights 258 Cash flow Yield 2.86 % 16.00 % 6.32 %
78 Model-based WAL 2.66 years 5.40 years 4.46 years
Liabilities
Interest-bearing deposits $ 206 Model-based IR Normal volatility 0.11 % 0.73 % 0.54 %
Securities loaned and sold under
agreements to repurchase $ 631 Model-based Interest rate 0.08 % 1.86 % 0.71 %
Trading account liabilities
Securities sold, not yet
purchased and other trading
liabilities $ 178 Model-based
IR lognormal
volatility 52.06 % 128.87 % 89.82 %
62 Price-based Price $ — $ 866 $ 80
Interest rate 10.03 % 20.07 % 13.70 %
Short-term borrowings and
long-term debt $ 24,827 Model-based IR Normal volatility 0.11 % 0.73 % 0.51 %
Forward price 15.40 % 262.00 % 92.48 %
As of December 31, 2019
Fair value
(1)
(in millions) Methodology Input Low
(2)(3)
High
(2)(3)
Weighted
average
(4)
Assets
Securities borrowed and
purchased under agreements to
resell $ 303 Model-based Credit spread 15 bps 15 bps 15 bps
Interest rate 1.59 % 3.67 % 2.72 %
Mortgage-backed securities $ 196 Price-based Price $ 36 $ 505 $ 97
22 Model-based
State and municipal, foreign
government, corporate and other
debt securities $ 880 Model-based Price $ — $ 1,238 $ 90
677 Price-based Credit spread 35 bps 295 bps 209 bps
Marketable equity securities
(5)
$ 70 Price-based Price $ — $ 38,500 $ 2,979
30 Model-based WAL 1.48 years 1.48 years 1.48 years
Recovery
(in millions)
$ 5,450 $ 5,450 $ 5,450
Asset-backed securities $ 812 Price-based Price $ 4 $ 103 $ 60
368 Yield analysis Yield 0.61 % 23.38 % 8.88 %
Non-marketable equities $ 316 Comparables analysis EBITDA multiples 7.00x 17.95x 10.34x
97 Price-based
Appraised value
(in thousands)
$ 397 $ 33,246 $ 8,446
Price $ 3 $ 2,019 $ 1,020
PE ratio 14.70x 28.70x 20.54x
Price to book ratio 1.50x 3.00x 1.88x
Discount to price — % 10.00 % 2.32 %
Derivatives—gross
(6)
Interest rate contracts (gross) $ 2,196 Model-based Inflation volatility 0.21 % 2.74 % 0.79 %
Mean reversion 1.00 % 20.00 % 10.50 %
IR normal volatility 0.09 % 0.66 % 0.53 %
Foreign exchange contracts
(gross) $ 1,099 Model-based FX volatility 1.27 % 12.16 % 9.17 %
IR normal volatility 0.27 % 0.66 % 0.58 %
FX rate 37.39 % 586.84 % 80.64 %
Interest rate 2.72 % 56.14 % 13.11 %
272

IR-IR correlation (51.00) % 40.00 % 32.00 %
IR-FX correlation 40.00 % 60.00 % 50.00 %
Equity contracts (gross)
(7)
$ 2,076 Model-based Equity volatility 3.16 % 52.80 % 28.43 %
Forward price 62.60 % 112.69 % 98.46 %
WAL 1.48 years 1.48 years 1.48 years
Recovery
(in millions) $ 5,450 $ 5,450 $ 5,450
Commodity and other contracts
(gross) $ 1,487 Model-based Forward price 37.62 % 362.57 % 119.32 %
Commodity
volatility 5.25 % 93.63 % 23.55 %
Commodity
correlation (39.65) % 87.81 % 41.80 %
Credit derivatives (gross) $ 613 Model-based Credit spread 8 bps 283 bps 80 bps
341 Price-based Upfront points 2.59 % 99.94 % 59.41 %
Price $ 12 $ 100 $ 87
Credit
correlation 25.00 % 87.00 % 48.57 %
Recovery rate 20.00 % 65.00 % 48.00 %
Loans and leases $ 378 Model-based Credit spread 9 bps 52 bps 48 bps
Equity volatility 32.00 % 32.00 % 32.00 %
Mortgage servicing rights $ 418 Cash flow Yield 1.78 % 12.00 % 9.49 %
77 Model-based WAL 4.07 years 8.13 years 6.61 years
Liabilities
Interest-bearing deposits $ 215 Model-based Mean reversion 1.00 % 20.00 % 10.50 %
Forward price 97.59 % 111.06 % 102.96 %
Securities loaned and sold under
agreements to repurchase $ 757 Model-based Interest rate 1.59 % 2.38 % 1.95 %
Trading account liabilities
Securities sold, not yet purchased $ 46 Price-based Price $ — $ 866 $ 96
Short-term borrowings and long-
term debt 17,182 Model-based Mean reversion 1.00 % 20.00 % 10.50 %
IR normal volatility 0.09 % 0.66 % 0.46 %
Forward price 37.62 % 362.57 % 97.52 %
Equity-IR
correlation 15.00 % 44.00 % 32.66 %
(1) The fair value amounts presented in these tables represent the primary valuation technique or techniques for each class of assets or liabilities.
(2) Some inputs are shown as zero due to rounding.
(3) When the low and high inputs are the same, there is either a constant input applied to all positions, or the methodology involving the input applies to only one
large position.
(4) Weighted averages are calculated based on the fair values of the instruments.
(5) For equity securities, the price inputs are expressed on an absolute basis, not as a percentage of the notional amount.
(6) Both trading and nontrading account derivatives—assets and liabilities—are presented on a gross absolute value basis.
(7) Includes hybrid products.
Uncertainty of Fair Value Measurements Relating to
Unobservable Inputs
Valuation uncertainty arises when there is insufficient or
disperse market data to allow a precise determination of the
exit value of a fair-valued position or portfolio in today’s
market. This is especially prevalent in Level 3 fair value
instruments, where uncertainty exists in valuation inputs that
may be both unobservable and significant to the instrument’s
(or portfolio’s) overall fair value measurement. The
uncertainties associated with key unobservable inputs on the
Level 3 fair value measurements may not be independent of
one another. In addition, the amount and direction of the
uncertainty on a fair value measurement for a given change in
an unobservable input depends on the nature of the instrument
as well as whether the Company holds the instrument as an
asset or a liability. For certain instruments, the pricing,
hedging and risk management are sensitive to the correlation
between various inputs rather than on the analysis and
aggregation of the individual inputs.
The following section describes some of the most
significant unobservable inputs used by the Company in
Level 3 fair value measurements.
Correlation
Correlation is a measure of the extent to which two or more
variables change in relation to each other. A variety of
273
correlation-related assumptions are required for a wide range
of instruments, including equity and credit baskets, foreign
exchange options, CDOs backed by loans or bonds,
mortgages, subprime mortgages and many other instruments.
For almost all of these instruments, correlations are not
directly observable in the market and must be calculated using
alternative sources, including historical information.
Estimating correlation can be especially difficult where it may
vary over time, and calculating correlation information from
market data requires significant assumptions regarding the
informational efficiency of the market (e.g., swaption
markets). Uncertainty therefore exists when an estimate of the
appropriate level of correlation as an input into some fair value
measurements is required.
Changes in correlation levels can have a substantial
impact, favorable or unfavorable, on the value of an
instrument, depending on its nature. A change in the default
correlation of the fair value of the underlying bonds
comprising a CDO structure would affect the fair value of the
senior tranche. For example, an increase in the default
correlation of the underlying bonds would reduce the fair
value of the senior tranche, because highly correlated
instruments produce greater losses in the event of default and a
portion of these losses would become attributable to the senior
tranche. That same change in default correlation would
have a different impact on junior tranches of the same
structure.
Volatility
Volatility represents the speed and severity of market price
changes and is a key factor in pricing options. Volatility
generally depends on the tenor of the underlying instrument
and the strike price or level defined in the contract. Volatilities
for certain combinations of tenor and strike are not observable
and need to be estimated using alternative methods, such as
using comparable instruments, historical analysis or other
sources of market information. This leads to uncertainty
around the final fair value measurement of instruments with
unobservable volatilities.
The general relationship between changes in the value of
a portfolio to changes in volatility also depends on changes in
interest rates and the level of the underlying index. Generally,
long option positions (assets) benefit from increases in
volatility, whereas short option positions (liabilities) will
suffer losses. Some instruments are more sensitive to changes
in volatility than others. For example, an at-the-money option
would experience a greater percentage change in its fair value
than a deep-in-the-money option. In addition, the fair value of
an option with more than one underlying security (e.g., an
option on a basket of bonds) depends on the volatility of the
individual underlying securities as well as their correlations.
Yield
In some circumstances, the yield of an instrument is not
observable in the market and must be estimated from historical
data or from yields of similar securities. This estimated yield
may need to be adjusted to capture the characteristics of the
security being valued. In other situations, the estimated yield
may not represent sufficient market liquidity and must be
adjusted as well. Whenever the amount of the adjustment is
significant to the value of the security, the fair value
measurement is classified as Level 3.
Adjusted yield is generally used to discount the projected
future principal and interest cash flows on instruments, such as
asset-backed securities. Adjusted yield is impacted by changes
in the interest rate environment and relevant credit spreads.
Prepayment
Voluntary unscheduled payments (prepayments) change the
future cash flows for the investor and thereby change the fair
value of the security. The effect of prepayments is more
pronounced for residential mortgage-backed securities. An
increase in prepayments—in speed or magnitude—generally
creates losses for the holder of these securities. Prepayment is
generally negatively correlated with delinquency and interest
rate. A combination of low prepayments and high
delinquencies amplifies each input’s negative impact on a
mortgage securities’ valuation. As prepayment speeds change,
the weighted average life of the security changes, which
impacts the valuation either positively or negatively,
depending upon the nature of the security and the direction of
the change in the weighted average life.
Recovery
Recovery is the proportion of the total outstanding balance of
a bond or loan that is expected to be collected in a liquidation
scenario. For many credit securities (such as asset-backed
securities), there is no directly observable market input for
recovery, but indications of recovery levels are available from
pricing services. The assumed recovery of a security may
differ from its actual recovery that will be observable in the
future. The recovery rate impacts the valuation of credit
securities. Generally, an increase in the recovery rate
assumption increases the fair value of the security. An increase
in loss severity, the inverse of the recovery rate, reduces the
amount of principal available for distribution and, as a result,
decreases the fair value of the security.
Credit Spread
Credit spread is a component of the security representing its
credit quality. Credit spread reflects the market perception of
changes in prepayment, delinquency and recovery rates,
therefore capturing the impact of other variables on the fair
value. Changes in credit spread affect the fair value of
securities differently depending on the characteristics and
maturity profile of the security. For example, credit spread is a
more significant driver of the fair value measurement of a high
yield bond as compared to an investment grade bond.
Generally, the credit spread for an investment grade bond is
also more observable and less volatile than its high yield
counterpart.
274

Items Measured at Fair Value on a Nonrecurring Basis
Certain assets and liabilities are measured at fair value on a
nonrecurring basis and, therefore, are not included in the
tables above. These include assets measured at cost that have
been written down to fair value during the periods as a result
of an impairment. These also include non-marketable equity
securities that have been measured using the measurement
alternative and are either (i) written down to fair value during
the periods as a result of an impairment or (ii) adjusted upward
or downward to fair value as a result of a transaction observed
during the periods for the identical or similar investment of the
same issuer. In addition, these assets include loans held-for-
sale and other real estate owned that are measured at the lower
of cost or market value.
The following tables present the carrying amounts of all
assets that were still held for which a nonrecurring fair value
measurement was recorded:
In millions of dollars
Fair value Level 2 Level 3
December 31, 2020
Loans HFS
(1)
$ 3,375 $ 478 $ 2,897
Other real estate owned 17 4 13
Loans
(2)
1,015 679 336
Non-marketable equity
securities measured
using the measurement
alternative 315 312 3
Total assets at fair value
on a nonrecurring basis $ 4,722 $ 1,473 $ 3,249
In millions of dollars
Fair value Level 2 Level 3
December 31, 2019
Loans HFS
(1)
$ 4,579 $ 3,249 $ 1,330
Other real estate owned 20 6 14
Loans
(2)
344 93 251
Non-marketable equity
securities measured
using the measurement
alternative 249 249 —
Total assets at fair value
on a nonrecurring basis $ 5,192 $ 3,597 $ 1,595
(1) Net of fair value amounts on the unfunded portion of loans HFS
recognized as Other liabilities on the Consolidated Balance Sheet.
(2) Represents impaired loans held for investment whose carrying amount is
based on the fair value of the underlying collateral less costs to sell,
primarily real estate.
The fair value of loans HFS is determined where possible
using quoted secondary-market prices. If no such quoted price
exists, the fair value of a loan is determined using quoted
prices for a similar asset or assets, adjusted for the specific
attributes of that loan. Fair value for the other real estate
owned is based on appraisals. For loans whose carrying
amount is based on the fair value of the underlying collateral,
the fair values depend on the type of collateral. Fair value of
the collateral is typically estimated based on quoted market
prices if available, appraisals or other internal valuation
techniques.
Where the fair value of the related collateral is based on
an unadjusted appraised value, the loan is generally classified
as Level 2. Where significant adjustments are made to the
appraised value, the loan is classified as Level 3. In addition,
for corporate loans, appraisals of the collateral are often based
on sales of similar assets; however, because the prices of
similar assets require significant adjustments to reflect the
unique features of the underlying collateral, these fair value
measurements are generally classified as Level 3.
The fair value of non-marketable equity securities under
the measurement alternative is based on observed transaction
prices for the identical or similar investment of the same
issuer, or an internal valuation technique in the case of an
impairment. Where significant adjustments are made to the
observed transaction price or when an internal valuation
technique is used, the security is classified as Level 3. Fair
value may differ from the observed transaction price due to a
number of factors, including marketability adjustments and
differences in rights and obligations when the observed
transaction is not for the identical investment held by Citi.
275

Valuation Techniques and Inputs for Level 3 Nonrecurring Fair Value Measurements
The following tables present the valuation techniques covering the majority of Level 3 nonrecurring fair value measurements and the
most significant unobservable inputs used in those measurements:
As of December 31, 2020
Fair value
(1)
(in millions) Methodology Input Low
(2)
High
Weighted
average
(3)
Loans HFS $ 2,683 Price-based Price $ 79 $ 100 $ 98
Other real estate owned $ 7 Price-based Appraised value
(4)
$ 3,110,711 $ 4,241,357 $ 3,586,975
4 Recovery analysis Price 51 51 51
Loans
(5)
$ 147 Price-based Price $ 2 $ 49 $ 23
73 Recovery analysis Recovery rate 0.99 % 78.00 % 13.37 %
Appraised value
(4)
$ 34 $ 43,646,426 $ 17,762,950
As of December 31, 2019
Fair value
(1)
(in millions)
Methodology Input Low
(2)
High
Weighted
average
(3)
Loans HFS $ 1,320 Price-based Price $ 86 $ 100 $ 99
Other real estate owned $ 11 Price-based Appraised value
(4)
$ 2,297,358 $ 8,394,102 $ 5,615,884
5 Recovery analysis
Loans
(5)
$ 100
Recovery analysis
Recovery rate 0.57 % 100.00 % 64.78 %
54 Cash flow Price $ 2 $ 54 $ 27
47
Price-based
Cost of capital 0.10 % 100.00 % 54.84 %
66 Price-based Price
$ 17,521,218
$ 43,646,426 $ 30,583,822
(1) The fair value amounts presented in this table represent the primary valuation technique or techniques for each class of assets or liabilities.
(2) Some inputs are shown as zero due to rounding.
(3) Weighted averages are calculated based on the fair values of the instruments.
(4) Appraised values are disclosed in whole dollars.
(5) Represents impaired loans held for investment whose carrying amount is based on the fair value of the underlying collateral less costs to sell, primarily real estate.
Nonrecurring Fair Value Changes
The following tables present total nonrecurring fair value
measurements for the period, included in earnings, attributable
to the change in fair value relating to assets that were still
held:
Year ended
December 31,
In millions of dollars
2020
Loans HFS $ (91)
Other real estate owned (1)
Loans
(1)
(137)
Non-marketable equity securities measured
using the measurement alternative 70
Total nonrecurring fair value gains (losses) $ (159)
Year ended
December 31,
In millions of dollars
2019
Loans HFS $ —
Other real estate owned (1)
Loans
(1)
(56)
Non-marketable equity securities measured
using the measurement alternative 99
Total nonrecurring fair value gains (losses) $ 42
(1) Represents loans held for investment whose carrying amount is based on
the fair value of the underlying collateral less costs to sell, primarily real
estate.
276
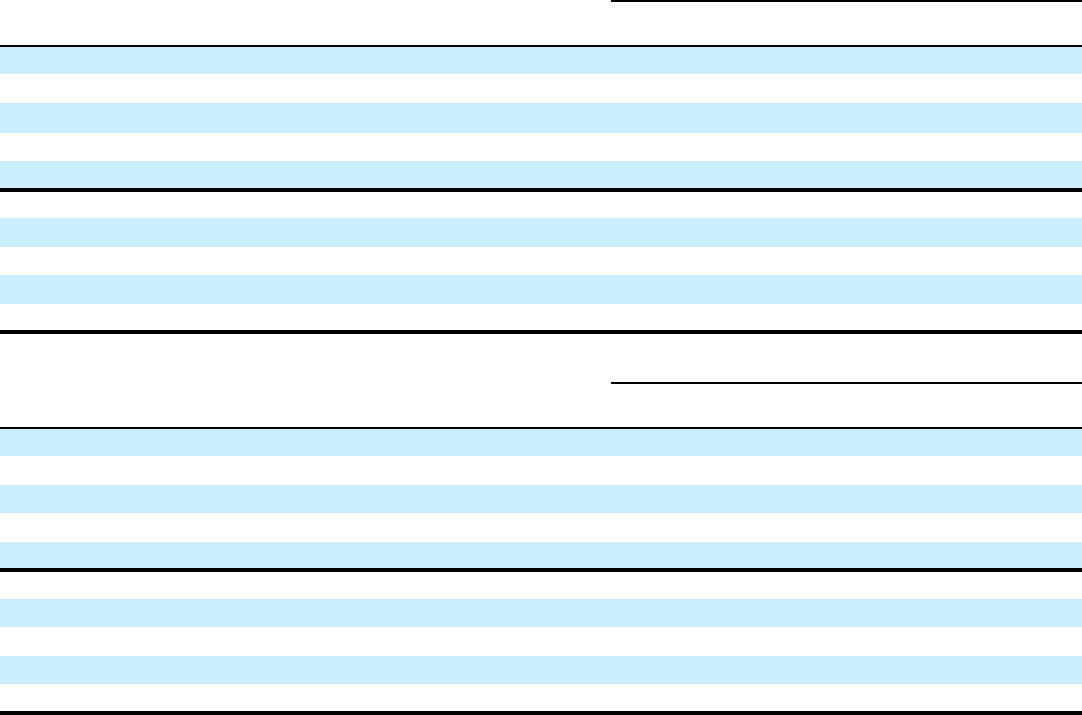
Estimated Fair Value of Financial Instruments Not
Carried at Fair Value
The following tables present the carrying value and fair value
of Citigroup’s financial instruments that are not carried at fair
value. The tables below therefore exclude items measured at
fair value on a recurring basis presented in the tables above.
The disclosure also excludes leases, affiliate investments,
pension and benefit obligations, certain insurance contracts
and tax-related items. Also, as required, the disclosure
excludes the effect of taxes, any premium or discount that
could result from offering for sale at one time the entire
holdings of a particular instrument, excess fair value
associated with deposits with no fixed maturity and other
expenses that would be incurred in a market transaction. In
addition, the tables exclude the values of non-financial assets
and liabilities, as well as a wide range of franchise,
relationship and intangible values, which are integral to a full
assessment of Citigroup’s financial position and the value of
its net assets.
Fair values vary from period to period based on changes
in a wide range of factors, including interest rates, credit
quality and market perceptions of value, and as existing assets
and liabilities run off and new transactions are entered into.
December 31, 2020 Estimated fair value
Carrying
value
Estimated
fair value
In billions of dollars
Level 1 Level 2 Level 3
Assets
Investments $ 110.3 $ 113.2 $ 23.3 $ 87.0 $ 2.9
Securities borrowed and purchased under agreements to resell 109.5 109.5 — 109.5 —
Loans
(1)(2)
643.3 663.9 — 0.6 663.3
Other financial assets
(2)(3)
383.2 383.2 291.5 18.1 73.6
Liabilities
Deposits $ 1,278.7 $ 1,278.8 $ — $ 1,093.3 $ 185.5
Securities loaned and sold under agreements to repurchase 139.3 139.3 — 139.3 —
Long-term debt
(4)
204.6 221.2 — 197.8 23.4
Other financial liabilities
(5)
102.4 102.4 — 19.2 83.2
December 31, 2019 Estimated fair value
Carrying
value
Estimated
fair value
In billions of dollars
Level 1 Level 2 Level 3
Assets
Investments $ 86.4 $ 87.8 $ 1.9 $ 83.8 $ 2.1
Securities borrowed and purchased under agreements to resell 98.1 98.1 — 98.1 —
Loans
(1)(2)
681.2 677.7 — 4.7 673.0
Other financial assets
(2)(3)
262.4 262.4 177.6 16.3 68.5
Liabilities
Deposits $ 1,068.3 $ 1,066.7 $ — $ 875.5 $ 191.2
Securities loaned and sold under agreements to repurchase 125.7 125.7 — 125.7 —
Long-term debt
(4)
193.0 203.8 — 187.3 16.5
Other financial liabilities
(5)
110.2 110.2 — 37.5 72.7
(1) The carrying value of loans is net of the Allowance for credit losses on loans of $25.0 billion for December 31, 2020 and $12.8 billion for December 31, 2019. In
addition, the carrying values exclude $0.7 billion and $1.4 billion of lease finance receivables at December 31, 2020 and 2019, respectively.
(2) Includes items measured at fair value on a nonrecurring basis.
(3) Includes cash and due from banks, deposits with banks, brokerage receivables, reinsurance recoverables and other financial instruments included in Other assets
on the Consolidated Balance Sheet, for all of which the carrying value is a reasonable estimate of fair value.
(4) The carrying value includes long-term debt balances under qualifying fair value hedges.
277
(5) Includes brokerage payables, separate and variable accounts, short-term borrowings (carried at cost) and other financial instruments included in Other liabilities
on the Consolidated Balance Sheet, for all of which the carrying value is a reasonable estimate of fair value.
The estimated fair values of the Company’s corporate
unfunded lending commitments at December 31, 2020 and
2019 were liabilities of $7.3 billion and $5.1 billion,
respectively, substantially all of which are classified as
Level 3. The Company does not estimate the fair values of
consumer unfunded lending commitments, which are
generally cancelable by providing notice to the borrower.
278
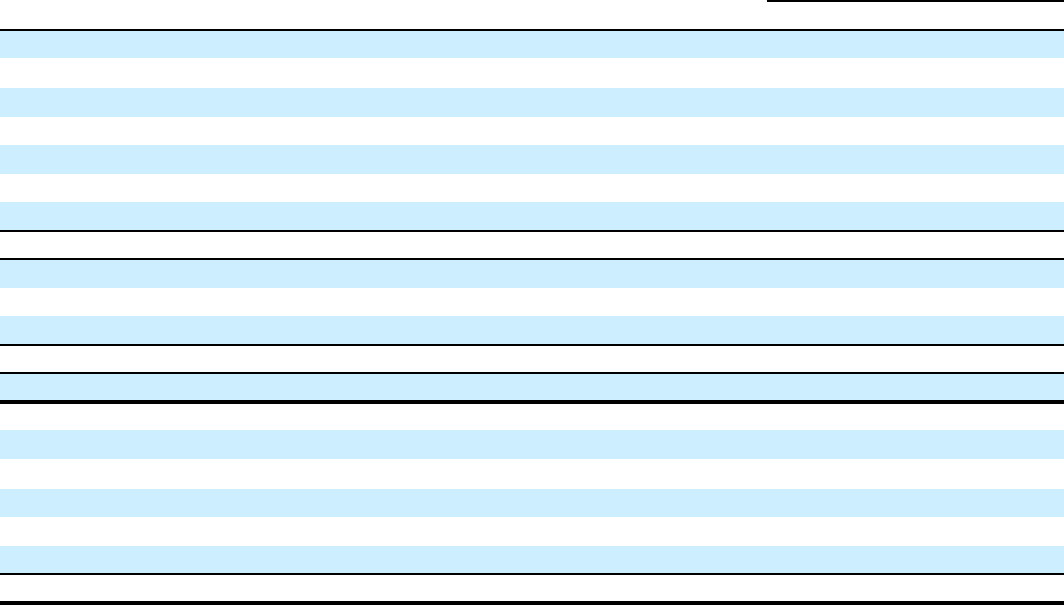
25. FAIR VALUE ELECTIONS
The Company may elect to report most financial instruments
and certain other items at fair value on an instrument-by-
instrument basis with changes in fair value reported in
earnings, other than DVA (see below). The election is made
upon the initial recognition of an eligible financial asset,
financial liability or firm commitment or when certain
specified reconsideration events occur. The fair value election
may not otherwise be revoked once an election is made. The
changes in fair value are recorded in current earnings.
Movements in DVA are reported as a component of AOCI.
Additional discussion regarding the applicable areas in which
fair value elections were made is presented in Note 24 to the
Consolidated Financial Statements.
The Company has elected fair value accounting for its
mortgage servicing rights (MSRs). See Note 21 to the
Consolidated Financial Statements for further discussions
regarding the accounting and reporting of MSRs.
The following table presents the changes in fair value of those items for which the fair value option has been elected:
Changes in fair value—gains (losses)
for the years ended December 31,
In millions of dollars
2020 2019
Assets
Securities borrowed and purchased under agreements to resell $ —
$ 6
Trading account assets (136)
77
Investments — —
Loans
Certain corporate loans
2,486
(222)
Certain consumer loans 1 —
Total loans $ 2,487 $ (222)
Other assets
MSRs $ (204) $ (84)
Certain mortgage loans HFS
(1)
299 91
Total other assets $ 95 $ 7
Total assets $ 2,446 $ (132)
Liabilities
Interest-bearing deposits $ (154) $ (205)
Securities loaned and sold under agreements to repurchase (559) 386
Trading account liabilities (1) 27
Short-term borrowings
(2)
802 (78)
Long-term debt
(2)
(2,700) (5,174)
Total liabilities $ (2,612) $ (5,044)
(1) Includes gains (losses) associated with interest rate lock commitments for those loans that have been originated and elected under the fair value option.
(2) Includes DVA that is included in AOCI. See Notes 19 and 24 to the Consolidated Financial Statements.
279
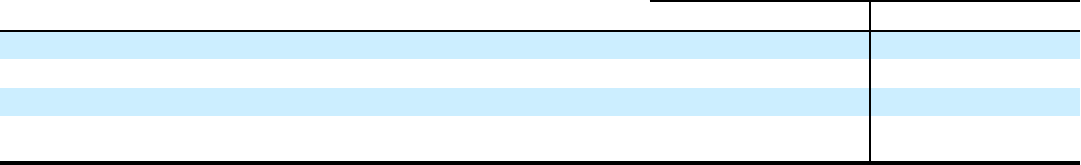
Own Debt Valuation Adjustments (DVA)
Own debt valuation adjustments are recognized on Citi’s
liabilities for which the fair value option has been elected
using Citi’s credit spreads observed in the bond market.
Changes in fair value of fair value option liabilities related to
changes in Citigroup’s own credit spreads (DVA) are reflected
as a component of AOCI. See Note 1 to the Consolidated
Financial Statements for additional information.
Among other variables, the fair value of liabilities for
which the fair value option has been elected (other than non-
recourse debt and similar liabilities) is impacted by the
narrowing or widening of the Company’s credit spreads.
The estimated changes in the fair value of these non-
derivative liabilities due to such changes in the Company’s
own credit spread (or instrument-specific credit risk) were a
loss of $616 million and a loss of $1,473 million for the years
ended December 31, 2020 and 2019, respectively. Changes in
fair value resulting from changes in instrument-specific credit
risk were estimated by incorporating the Company’s current
credit spreads observable in the bond market into the relevant
valuation technique used to value each liability as described
above.
The Fair Value Option for Financial Assets and Financial
Liabilities
Selected Portfolios of Securities Purchased Under
Agreements to Resell, Securities Borrowed, Securities Sold
Under Agreements to Repurchase, Securities Loaned and
Certain Non-Collateralized Short-Term Borrowings
The Company elected the fair value option for certain
portfolios of fixed income securities purchased under
agreements to resell and fixed income securities sold under
agreements to repurchase, securities borrowed, securities
loaned and certain uncollateralized short-term borrowings held
primarily by broker-dealer entities in the United States, the
United Kingdom and Japan. In each case, the election was
made because the related interest rate risk is managed on a
portfolio basis, primarily with offsetting derivative
instruments that are accounted for at fair value through
earnings.
Changes in fair value for transactions in these portfolios
are recorded in Principal transactions. The related interest
revenue and interest expense are measured based on the
contractual rates specified in the transactions and are reported
as Interest revenue and Interest expense in the Consolidated
Statement of Income.
Certain Loans and Other Credit Products
Citigroup has also elected the fair value option for certain
other originated and purchased loans, including certain
unfunded loan products, such as guarantees and letters of
credit, executed by Citigroup’s lending and trading businesses.
None of these credit products are highly leveraged financing
commitments. Significant groups of transactions include loans
and unfunded loan products that are expected to be either sold
or securitized in the near term, or transactions where the
economic risks are hedged with derivative instruments, such
as purchased credit default swaps or total return swaps where
the Company pays the total return on the underlying loans to a
third party. Citigroup has elected the fair value option to
mitigate accounting mismatches in cases where hedge
accounting is complex and to achieve operational
simplifications. Fair value was not elected for most lending
transactions across the Company.
The following table provides information about certain credit products carried at fair value:
December 31, 2020 December 31, 2019
In millions of dollars
Trading assets Loans Trading assets Loans
Carrying amount reported on the Consolidated Balance Sheet $ 8,063 $ 6,854 $ 8,320 $ 4,086
Aggregate unpaid principal balance in excess of (less than) fair value (915) (14) 410 315
Balance of non-accrual loans or loans more than 90 days past due — 4 — 1
Aggregate unpaid principal balance in excess of (less than) fair value for non-accrual
loans or loans more than 90 days past due — — — —
In addition to the amounts reported above, $1,068 million
and $1,062 million of unfunded commitments related to
certain credit products selected for fair value accounting were
outstanding as of December 31, 2020 and 2019, respectively.
280

Changes in the fair value of funded and unfunded credit
products are classified in Principal transactions in Citi’s
Consolidated Statement of Income. Related interest revenue is
measured based on the contractual interest rates and reported
as Interest revenue on Trading account assets or loan interest
depending on the balance sheet classifications of the credit
products. The changes in fair value for the years ended
December 31, 2020 and 2019 due to instrument-specific credit
risk totaled to a loss of $(16) million and a gain of $95 million,
respectively.
Certain Investments in Unallocated Precious Metals
Citigroup invests in unallocated precious metals accounts
(gold, silver, platinum and palladium) as part of its commodity
and foreign currency trading activities or to economically
hedge certain exposures from issuing structured liabilities.
Under ASC 815, the investment is bifurcated into a debt host
contract and a commodity forward derivative instrument.
Citigroup elects the fair value option for the debt host contract,
and reports the debt host contract within Trading account
assets on the Company’s Consolidated Balance Sheet. The
total carrying amount of debt host contracts across unallocated
precious metals accounts was approximately $0.5 billion and
$0.2 billion at December 31, 2020 and 2019, respectively. The
amounts are expected to fluctuate based on trading activity in
future periods.
As part of its commodity and foreign currency trading
activities, Citi trades unallocated precious metals investments
and executes forward purchase and forward sale derivative
contracts with trading counterparties. When Citi sells an
unallocated precious metals investment, Citi’s receivable from
its depository bank is repaid and Citi derecognizes its
investment in the unallocated precious metal. The forward
purchase or sale contract with the trading counterparty indexed
to unallocated precious metals is accounted for as a derivative,
at fair value through earnings. As of December 31, 2020, there
were approximately $7.4 billion and $6.3 billion in notional
amounts of such forward purchase and forward sale derivative
contracts outstanding, respectively.
Certain Investments in Private Equity and Real Estate
Ventures
Citigroup invests in private equity and real estate ventures for
the purpose of earning investment returns and for capital
appreciation. The Company has elected the fair value option
for certain of these ventures, because such investments are
considered similar to many private equity or hedge fund
activities in Citi’s investment companies, which are reported
at fair value. The fair value option brings consistency in the
accounting and evaluation of these investments. All
investments (debt and equity) in such private equity and real
estate entities are accounted for at fair value. These
investments are classified as Investments on Citigroup’s
Consolidated Balance Sheet.
Changes in the fair values of these investments are
classified in Other revenue in the Company’s Consolidated
Statement of Income.
Certain Mortgage Loans Held-for-Sale (HFS)
Citigroup has elected the fair value option for certain
purchased and originated prime fixed-rate and conforming
adjustable-rate first mortgage loans HFS. These loans are
intended for sale or securitization and are hedged with
derivative instruments. The Company has elected the fair
value option to mitigate accounting mismatches in cases where
hedge accounting is complex and to achieve operational
simplifications.
The following table provides information about certain mortgage loans HFS carried at fair value:
In millions of dollars
December 31,
2020
December 31,
2019
Carrying amount reported on the Consolidated Balance Sheet $ 1,742 $ 1,254
Aggregate fair value in excess of (less than) unpaid principal balance 91 (31)
Balance of non-accrual loans or loans more than 90 days past due — 1
Aggregate unpaid principal balance in excess of fair value for non-accrual loans or loans more than 90 days
past due — —
The changes in the fair values of these mortgage loans are
reported in Other revenue in the Company’s Consolidated
Statement of Income. There was no net change in fair value
during the years ended December 31, 2020 and 2019 due to
instrument-specific credit risk. Related interest income
continues to be measured based on the contractual interest
rates and reported as Interest revenue in the Consolidated
Statement of Income.
281

Certain Structured Liabilities
The Company has elected the fair value option for certain
structured liabilities whose performance is linked to structured
interest rates, inflation, currency, equity, referenced credit or
commodity risks. The Company elected the fair value option
because these exposures are considered to be trading-related
positions and, therefore, are managed on a fair value basis.
These positions will continue to be classified as debt, deposits
or derivatives (Trading account liabilities) on the Company’s
Consolidated Balance Sheet according to their legal form.
The following table provides information about the carrying value of structured notes, disaggregated by type of embedded derivative
instrument:
In billions of dollars
December 31, 2020 December 31, 2019
Interest rate linked $ 16.0 $ 22.6
Foreign exchange linked 1.2 0.7
Equity linked 27.3 23.7
Commodity linked 1.4 1.8
Credit linked 2.6 0.9
Total $ 48.5 $ 49.7
The portion of the changes in fair value attributable to
changes in Citigroup’s own credit spreads (DVA) is reflected
as a component of AOCI while all other changes in fair value
are reported in Principal transactions. Changes in the fair
value of these structured liabilities include accrued interest,
which is also included in the change in fair value reported in
Principal transactions.
Certain Non-Structured Liabilities
The Company has elected the fair value option for certain non-
structured liabilities with fixed and floating interest rates. The
Company has elected the fair value option where the interest
rate risk of such liabilities may be economically hedged with
derivative contracts or the proceeds are used to purchase
financial assets that will also be accounted for at fair value
through earnings. The elections have been made to mitigate
accounting mismatches and to achieve operational
simplifications. These positions are reported in Short-term
borrowings and Long-term debt on the Company’s
Consolidated Balance Sheet. The portion of the changes in fair
value attributable to changes in Citigroup’s own credit spreads
(DVA) is reflected as a component of AOCI while all other
changes in fair value are reported in Principal transactions.
Interest expense on non-structured liabilities is measured
based on the contractual interest rates and reported as Interest
expense in the Consolidated Statement of Income.
The following table provides information about long-term debt carried at fair value:
In millions of dollars
December 31, 2020 December 31, 2019
Carrying amount reported on the Consolidated Balance Sheet $ 67,063 $ 55,783
Aggregate unpaid principal balance in excess of (less than) fair value (5,130) (2,967)
The following table provides information about short-term borrowings carried at fair value:
In millions of dollars
December 31, 2020 December 31, 2019
Carrying amount reported on the Consolidated Balance Sheet $ 4,683 $ 4,946
Aggregate unpaid principal balance in excess of (less than) fair value 68 1,411
282

26. PLEDGED ASSETS, COLLATERAL,
GUARANTEES AND COMMITMENTS
Pledged Assets
In connection with Citi’s financing and trading activities, Citi
has pledged assets to collateralize its obligations under
repurchase agreements, secured financing agreements, secured
liabilities of consolidated VIEs and other borrowings. The
approximate carrying values of the significant components of
pledged assets recognized on Citi’s Consolidated Balance
Sheet included the following:
In millions of dollars
December 31,
2020
December 31,
2019
Investment securities $ 231,696 $ 152,352
Loans 239,699 236,033
Trading account assets 174,717 131,392
Total $ 646,112 $ 519,777
Restricted Cash
Citigroup defines restricted cash (as cash subject to
withdrawal restrictions) to include cash deposited with central
banks that must be maintained to meet minimum regulatory
requirements, and cash set aside for the benefit of customers
or for other purposes such as compensating balance
arrangements or debt retirement. Restricted cash includes
minimum reserve requirements with the Federal Reserve Bank
and certain other central banks and cash segregated to satisfy
rules regarding the protection of customer assets as required
by Citigroup broker-dealers’ primary regulators, including the
United States Securities and Exchange Commission (SEC), the
Commodity Futures Trading Commission and the United
Kingdom’s Prudential Regulation Authority.
Restricted cash is included on the Consolidated Balance
Sheet within the following balance sheet lines:
In millions of dollars
December 31,
2020
December 31,
2019
Cash and due from banks $ 3,774 $ 3,758
Deposits with banks, net of
allowance 14,203 26,493
Total $ 17,977 $ 30,251
In addition, included in Cash and due from banks and
Deposits with banks at December 31, 2020 and 2019 were
$9.4 billion and $8.5 billion, respectively, of cash segregated
under federal and other brokerage regulations or deposited
with clearing organizations.
In response to the COVID-19 pandemic, the Federal
Reserve Bank and certain other central banks eased
regulations related to minimum required cash deposited with
central banks. This resulted in a decrease in Citigroup’s
restricted cash amount at December 31, 2020.
Collateral
At December 31, 2020 and 2019, the approximate fair value of
collateral received by Citi that may be resold or repledged,
excluding the impact of allowable netting, was $671.6 billion
and $569.8 billion, respectively. This collateral was received
in connection with resale agreements, securities borrowings
and loans, securities for securities lending transactions,
derivative transactions and margined broker loans.
At December 31, 2020 and 2019, a substantial portion of
the collateral received by Citi had been sold or repledged in
connection with repurchase agreements, securities sold, not
yet purchased, securities lendings, pledges to clearing
organizations, segregation requirements under securities laws
and regulations, derivative transactions and bank loans.
In addition, at December 31, 2020 and 2019, Citi had
pledged $470.7 billion and $388.9 billion, respectively, of
collateral that may not be sold or repledged by the secured
parties.
Leases
The Company’s operating leases, where Citi is a lessee,
include real estate, such as office space and branches, and
various types of equipment. These leases may contain renewal
and extension options and early termination features.
However, these options do not impact the lease term unless the
Company is reasonably certain that it will exercise the options.
These leases have a weighted-average remaining lease term of
approximately six years as of December 31, 2020 and 2019.
The operating lease ROU asset was $2.8 billion and
$3.1 billion, as of December 31, 2020 and 2019, respectively.
The operating lease ROU liability was $3.1 billion and
$3.3 billion, as of December 31, 2020 and 2019, respectively.
The Company recognizes fixed lease costs on a straight-line
basis throughout the lease term in the Consolidated Statement
of Income. In addition, variable lease costs are recognized in
the period in which the obligation for those payments is
incurred. The total operating lease expense (principally for
offices, branches and equipment), net of $27 million and
$56 million of sublease income, was $1,054 million and
$1,084 million for the years ended December 31, 2020 and
2019, respectively. During 2019, Citi purchased a previously
leased property in London. The purchased property is included
in Other assets on the Consolidated Balance Sheet at both
December 31, 2020 and 2019.
The table below provides the Cash Flow Statement
Supplemental Information:
In millions of dollars
December 31,
2020
December 31,
2019
Cash paid for amounts included
in the measurement of lease
liabilities $ 814 $ 942
Right-of-use assets obtained in
exchange for new operating
lease liabilities
(1)(2)
447 499
(1) Represents non-cash activity and, accordingly, is not reflected in the
Consolidated Statement of Cash Flow.
(2) Excludes the decrease in the right-of-use assets related to the purchase of
a previously leased property.
283
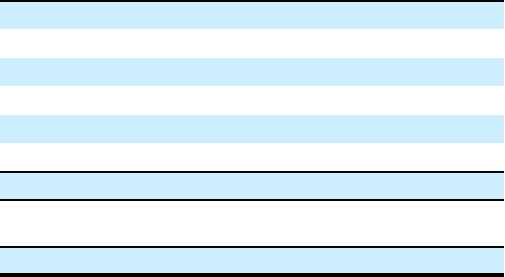
Citi’s future lease payments are as follows:
In millions of dollars
2021 $ 791
2022 663
2023 518
2024 399
2025 307
Thereafter 766
Total future lease payments $ 3,444
Less imputed interest (based on weighted-average
discount rate of 3.6%) $ (356)
Lease liability $ 3,088
Operating lease expense was $1.0 billion for the year
ended December 31, 2018.
Guarantees
Citi provides a variety of guarantees and indemnifications to
its customers to enhance their credit standing and enable them
to complete a wide variety of business transactions. For
certain contracts meeting the definition of a guarantee, the
guarantor must recognize, at inception, a liability for the fair
value of the obligation undertaken in issuing the guarantee.
In addition, the guarantor must disclose the maximum
potential amount of future payments that the guarantor could
be required to make under the guarantee, if there were a total
default by the guaranteed parties. The determination of the
maximum potential future payments is based on the notional
amount of the guarantees without consideration of possible
recoveries under recourse provisions or from collateral held or
pledged. As such, Citi believes such amounts bear no
relationship to the anticipated losses, if any, on these
guarantees.
284
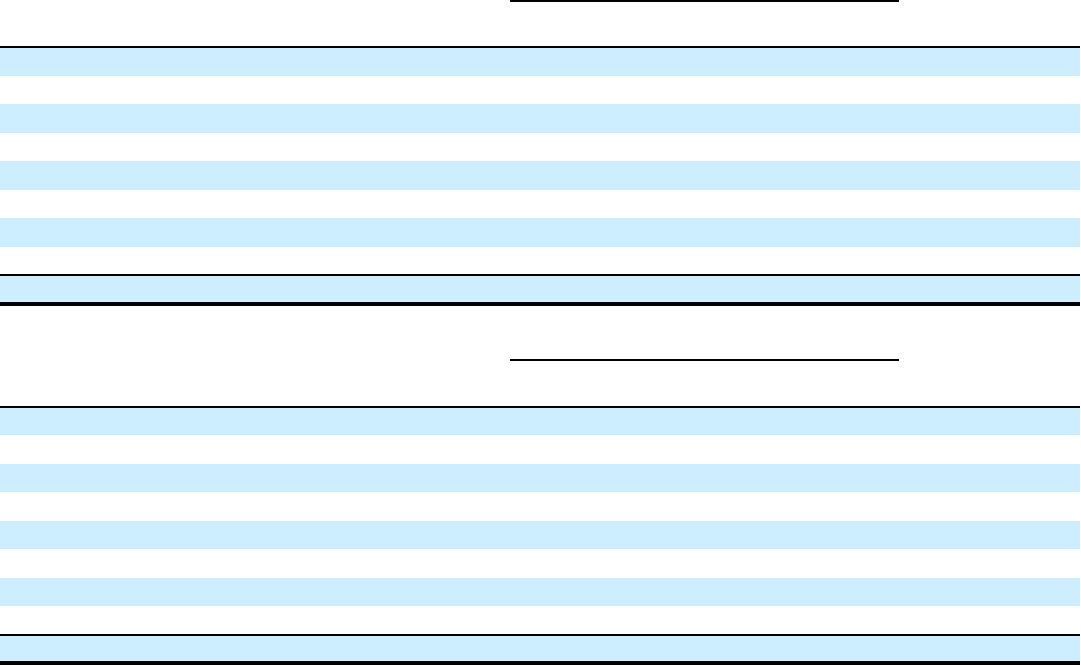
The following tables present information about Citi’s guarantees:
Maximum potential amount of future payments
In billions of dollars at December 31, 2020
Expire within
1 year
Expire after
1 year
Total amount
outstanding
Carrying value
(in millions of dollars)
Financial standby letters of credit $ 25.3 $ 68.4 $ 93.7 $ 1,407
Performance guarantees 7.3 6.0 13.3 72
Derivative instruments considered to be guarantees 20.0 60.9 80.9 671
Loans sold with recourse — 1.2 1.2 9
Securities lending indemnifications
(1)
112.2 — 112.2 —
Credit card merchant processing
(1)(2)
101.9 — 101.9 3
Credit card arrangements with partners 0.2 0.8 1.0 7
Custody indemnifications and other — 37.3 37.3 35
Total $ 266.9 $ 174.6 $ 441.5 $ 2,204
Maximum potential amount of future payments
In billions of dollars at December 31, 2019
Expire within
1 year
Expire after
1 year
Total amount
outstanding
Carrying value
(in millions of dollars)
Financial standby letters of credit $ 31.9 $ 61.4 $ 93.3 $ 581
Performance guarantees 6.9 5.5 12.4 36
Derivative instruments considered to be guarantees 35.2 60.8 96.0 474
Loans sold with recourse — 1.2 1.2 7
Securities lending indemnifications
(1)
87.8 — 87.8 —
Credit card merchant processing
(1)(2)
91.6 — 91.6 —
Credit card arrangements with partners 0.2 0.4 0.6 23
Custody indemnifications and other — 33.7 33.7 41
Total $ 253.6 $ 163.0 $ 416.6 $ 1,162
(1) The carrying values of securities lending indemnifications and credit card merchant processing were not material for either period presented, as the probability of
potential liabilities arising from these guarantees is minimal.
(2) At December 31, 2020 and 2019, this maximum potential exposure was estimated to be $102 billion and $92 billion, respectively. However, Citi believes that the
maximum exposure is not representative of the actual potential loss exposure based on its historical experience. This contingent liability is unlikely to arise, as
most products and services are delivered when purchased and amounts are refunded when items are returned to merchants.
Financial Standby Letters of Credit
Citi issues standby letters of credit, which substitute its own
credit for that of the borrower. If a letter of credit is drawn
down, the borrower is obligated to repay Citi. Standby letters
of credit protect a third party from defaults on contractual
obligations. Financial standby letters of credit include
(i) guarantees of payment of insurance premiums and
reinsurance risks that support industrial revenue bond
underwriting, (ii) settlement of payment obligations to clearing
houses, including futures and over-the-counter derivatives
clearing (see further discussion below), (iii) support options
and purchases of securities in lieu of escrow deposit accounts
and (iv) letters of credit that backstop loans, credit facilities,
promissory notes and trade acceptances.
Performance Guarantees
Performance guarantees and letters of credit are issued to
guarantee a customer’s tender bid on a construction or
systems-installation project or to guarantee completion of such
projects in accordance with contract terms. They are also
issued to support a customer’s obligation to supply specified
products, commodities or maintenance or warranty services to
a third party.
Derivative Instruments Considered to Be Guarantees
Derivatives are financial instruments whose cash flows are
based on a notional amount and an underlying instrument,
reference credit or index, where there is little or no initial
investment, and whose terms require or permit net settlement.
For a discussion of Citi’s derivatives activities, see Note 22 to
the Consolidated Financial Statements.
Derivative instruments considered to be guarantees
include only those instruments that require Citi to make
payments to the counterparty based on changes in an
underlying instrument that is related to an asset, a liability or
an equity security held by the guaranteed party. More
specifically, derivative instruments considered to be
guarantees include certain over-the-counter written put options
285
where the counterparty is not a bank, hedge fund or broker-
dealer (such counterparties are considered to be dealers in
these markets and may, therefore, not hold the underlying
instruments). Credit derivatives sold by Citi are excluded from
the tables above as they are disclosed separately in Note 22 to
the Consolidated Financial Statements. In instances where
Citi’s maximum potential future payment is unlimited, the
notional amount of the contract is disclosed.
Loans Sold with Recourse
Loans sold with recourse represent Citi’s obligations to
reimburse the buyers for loan losses under certain
circumstances. Recourse refers to the clause in a sales
agreement under which a seller/lender will fully reimburse the
buyer/investor for any losses resulting from the purchased
loans. This may be accomplished by the seller’s taking back
any loans that become delinquent.
In addition to the amounts shown in the tables above, Citi
has recorded a repurchase reserve for its potential repurchases
or make-whole liability regarding residential mortgage
representation and warranty claims related to its whole loan
sales to U.S. government-sponsored agencies and, to a lesser
extent, private investors. The repurchase reserve was
approximately $31 million and $37 million at December 31,
2020 and 2019, respectively, and these amounts are included
in Other liabilities on the Consolidated Balance Sheet.
Securities Lending Indemnifications
Owners of securities frequently lend those securities for a fee
to other parties who may sell them short or deliver them to
another party to satisfy some other obligation. Banks may
administer such securities lending programs for their clients.
Securities lending indemnifications are issued by the bank to
guarantee that a securities lending customer will be made
whole in the event that the security borrower does not return
the security subject to the lending agreement and collateral
held is insufficient to cover the market value of the security.
Credit Card Merchant Processing
Credit card merchant processing guarantees represent the
Company’s indirect obligations in connection with
(i) providing transaction processing services to various
merchants with respect to its private label cards and
(ii) potential liability for bank card transaction processing
services. The nature of the liability in either case arises as a
result of a billing dispute between a merchant and a cardholder
that is ultimately resolved in the cardholder’s favor. The
merchant is liable to refund the amount to the cardholder. In
general, if the credit card processing company is unable to
collect this amount from the merchant, the credit card
processing company bears the loss for the amount of the credit
or refund paid to the cardholder.
With regard to (i) above, Citi has the primary contingent
liability with respect to its portfolio of private label merchants.
The risk of loss is mitigated as the cash flows between Citi and
the merchant are settled on a net basis, and Citi has the right to
offset any payments with cash flows otherwise due to the
merchant. To further mitigate this risk, Citi may delay
settlement, require a merchant to make an escrow deposit,
include event triggers to provide Citi with more financial and
operational control in the event of the financial deterioration
of the merchant or require various credit enhancements
(including letters of credit and bank guarantees). In the
unlikely event that a private label merchant is unable to deliver
products, services or a refund to its private label cardholders,
Citi is contingently liable to credit or refund cardholders.
With regard to (ii) above, Citi has a potential liability for
bank card transactions where Citi provides the transaction
processing services as well as those where a third party
provides the services and Citi acts as a secondary guarantor,
should that processor fail to perform.
Citi’s maximum potential contingent liability related to
both bank card and private label merchant processing services
is estimated to be the total volume of credit card transactions
that meet the requirements to be valid charge-back
transactions at any given time. At December 31, 2020 and
2019, this maximum potential exposure was estimated to be
$101.9 billion and $91.6 billion, respectively.
However, Citi believes that the maximum exposure is not
representative of the actual potential loss exposure based on its
historical experience. This contingent liability is unlikely to
arise, as most products and services are delivered when
purchased and amounts are refunded when items are returned
to merchants. Citi assesses the probability and amount of its
contingent liability related to merchant processing based on
the financial strength of the primary guarantor, the extent and
nature of unresolved charge-backs and its historical loss
experience. At December 31, 2020 and 2019, the losses
incurred and the carrying amounts of Citi’s contingent
obligations related to merchant processing activities were
immaterial.
Credit Card Arrangements with Partners
Citi, in one of its credit card partner arrangements, provides
guarantees to the partner regarding the volume of certain
customer originations during the term of the agreement. To the
extent that such origination targets are not met, the guarantees
serve to compensate the partner for certain payments that
otherwise would have been generated in connection with such
originations.
Custody Indemnifications
Custody indemnifications are issued to guarantee that custody
clients will be made whole in the event that a third-party
subcustodian or depository institution fails to safeguard
clients’ assets.
286
Other Guarantees and Indemnifications
Credit Card Protection Programs
Citi, through its credit card businesses, provides various
cardholder protection programs on several of its card
products, including programs that provide insurance
coverage for rental cars, coverage for certain losses
associated with purchased products, price protection for
certain purchases and protection for lost luggage. These
guarantees are not included in the table, since the total
outstanding amount of the guarantees and Citi’s maximum
exposure to loss cannot be quantified. The protection is
limited to certain types of purchases and losses, and it is not
possible to quantify the purchases that would qualify for
these benefits at any given time. Citi assesses the probability
and amount of its potential liability related to these programs
based on the extent and nature of its historical loss experience.
At December 31, 2020 and 2019, the actual and estimated
losses incurred and the carrying value of Citi’s obligations
related to these programs were immaterial.
Other Representation and Warranty Indemnifications
In the normal course of business, Citi provides standard
representations and warranties to counterparties in contracts in
connection with numerous transactions and also provides
indemnifications, including indemnifications that protect the
counterparties to the contracts in the event that additional
taxes are owed, due either to a change in the tax law or an
adverse interpretation of the tax law. Counterparties to these
transactions provide Citi with comparable indemnifications.
While such representations, warranties and indemnifications
are essential components of many contractual relationships,
they do not represent the underlying business purpose for the
transactions. The indemnification clauses are often standard
contractual terms related to Citi’s own performance under the
terms of a contract and are entered into in the normal course of
business based on an assessment that the risk of loss is remote.
Often these clauses are intended to ensure that terms of a
contract are met at inception. No compensation is received for
these standard representations and warranties, and it is not
possible to determine their fair value because they rarely, if
ever, result in a payment. In many cases, there are no stated or
notional amounts included in the indemnification clauses, and
the contingencies potentially triggering the obligation to
indemnify have not occurred and are not expected to occur. As
a result, these indemnifications are not included in the tables
above.
Value-Transfer Networks (Including Exchanges and Clearing
Houses) (VTNs)
Citi is a member of, or shareholder in, hundreds of value-
transfer networks (VTNs) (payment, clearing and settlement
systems as well as exchanges) around the world. As a
condition of membership, many of these VTNs require that
members stand ready to pay a pro rata share of the losses
incurred by the organization due to another member’s default
on its obligations. Citi’s potential obligations may be limited
to its membership interests in the VTNs, contributions to the
VTN’s funds, or, in certain narrow cases, to the full pro rata
share. The maximum exposure is difficult to estimate as this
would require an assessment of claims that have not yet
occurred; however, Citi believes the risk of loss is remote
given historical experience with the VTNs. Accordingly, Citi’s
participation in VTNs is not reported in the guarantees tables
above, and there are no amounts reflected on the Consolidated
Balance Sheet as of December 31, 2020 or 2019 for potential
obligations that could arise from Citi’s involvement with VTN
associations.
Long-Term Care Insurance Indemnification
In 2000, Travelers Life & Annuity (Travelers), then a
subsidiary of Citi, entered into a reinsurance agreement to
transfer the risks and rewards of its long-term care (LTC)
business to GE Life (now Genworth Financial Inc., or
Genworth), then a subsidiary of the General Electric Company
(GE). As part of this transaction, the reinsurance obligations
were provided by two regulated insurance subsidiaries of GE
Life, which funded two collateral trusts with securities.
Presently, as discussed below, the trusts are referred to as the
Genworth Trusts.
As part of GE’s spin-off of Genworth in 2004, GE
retained the risks and rewards associated with the 2000
Travelers reinsurance agreement by providing a reinsurance
contract to Genworth through GE’s Union Fidelity Life
Insurance Company (UFLIC) subsidiary that covers the
Travelers LTC policies. In addition, GE provided a capital
maintenance agreement in favor of UFLIC that is designed to
assure that UFLIC will have the funds to pay its reinsurance
obligations. As a result of these reinsurance agreements and
the spin-off of Genworth, Genworth has reinsurance protection
from UFLIC (supported by GE) and has reinsurance
obligations in connection with the Travelers LTC policies. As
noted below, the Genworth reinsurance obligations now
benefit Brighthouse Financial, Inc. (Brighthouse). While
neither Brighthouse nor Citi are direct beneficiaries of the
capital maintenance agreement between GE and UFLIC,
Brighthouse and Citi benefit indirectly from the existence of
the capital maintenance agreement, which helps assure that
UFLIC will continue to have funds necessary to pay its
reinsurance obligations to Genworth.
In connection with Citi’s 2005 sale of Travelers to
MetLife Inc. (MetLife), Citi provided an indemnification to
MetLife for losses (including policyholder claims) relating to
the LTC business for the entire term of the Travelers LTC
policies, which, as noted above, are reinsured by subsidiaries
of Genworth. In 2017, MetLife spun off its retail insurance
business to Brighthouse. As a result, the Travelers LTC
policies now reside with Brighthouse. The original reinsurance
agreement between Travelers (now Brighthouse) and
Genworth remains in place and Brighthouse is the sole
beneficiary of the Genworth Trusts. The Genworth Trusts are
designed to provide collateral to Brighthouse in an amount
equal to the statutory liabilities of Brighthouse in respect of
the Travelers LTC policies. The assets in the Genworth Trusts
are evaluated and adjusted periodically to ensure that the fair
value of the assets continues to provide collateral in an amount
equal to these estimated statutory liabilities, as the liabilities
change over time.
If both (i) Genworth fails to perform under the original
Travelers/GE Life reinsurance agreement for any reason,
287
including its insolvency or the failure of UFLIC to perform
under its reinsurance contract or GE to perform under the
capital maintenance agreement, and (ii) the assets of the two
Genworth Trusts are insufficient or unavailable, then Citi,
through its LTC reinsurance indemnification, must reimburse
Brighthouse for any losses incurred in connection with the
LTC policies. Since both events would have to occur before
Citi would become responsible for any payment to
Brighthouse pursuant to its indemnification obligation, and the
likelihood of such events occurring is currently not probable,
there is no liability reflected on the Consolidated Balance
Sheet as of December 31, 2020 and 2019 related to this
indemnification. However, if both events become reasonably
possible (meaning more than remote but less than probable),
Citi will be required to estimate and disclose a reasonably
possible loss or range of loss to the extent that such an
estimate could be made. In addition, if both events become
probable, Citi will be required to accrue for such liability in
accordance with applicable accounting principles.
Citi continues to closely monitor its potential exposure
under this indemnification obligation, given GE’s 2018 LTC
and other charges and the September 2019 AM Best credit
ratings downgrade for the Genworth subsidiaries.
Separately, Genworth announced that it had agreed to be
purchased by China Oceanwide Holdings Co., Ltd, subject to a
series of conditions and regulatory approvals. Citi is
monitoring these developments.
Futures and Over-the-Counter Derivatives Clearing
Citi provides clearing services on central clearing parties
(CCPs) for clients that need to clear exchange-traded and
over-the-counter (OTC) derivatives contracts with CCPs.
Based on all relevant facts and circumstances, Citi has
concluded that it acts as an agent for accounting purposes in
its role as clearing member for these client transactions. As
such, Citi does not reflect the underlying exchange-traded or
OTC derivatives contracts in its Consolidated Financial
Statements. See Note 22 for a discussion of Citi’s derivatives
activities that are reflected in its Consolidated Financial
Statements.
As a clearing member, Citi collects and remits cash and
securities collateral (margin) between its clients and the
respective CCP. In certain circumstances, Citi collects a higher
amount of cash (or securities) from its clients than it needs to
remit to the CCPs. This excess cash is then held at depository
institutions such as banks or carry brokers.
There are two types of margin: initial and variation.
Where Citi obtains benefits from or controls cash initial
margin (e.g., retains an interest spread), cash initial margin
collected from clients and remitted to the CCP or depository
institutions is reflected within Brokerage payables (payables
to customers) and Brokerage receivables (receivables from
brokers, dealers and clearing organizations) or Cash and due
from banks, respectively.
However, for exchange-traded and OTC-cleared
derivatives contracts where Citi does not obtain benefits from
or control the client cash balances, the client cash initial
margin collected from clients and remitted to the CCP or
depository institutions is not reflected on Citi’s Consolidated
Balance Sheet. These conditions are met when Citi has
contractually agreed with the client that (i) Citi will pass
through to the client all interest paid by the CCP or depository
institutions on the cash initial margin, (ii) Citi will not utilize
its right as a clearing member to transform cash margin into
other assets, (iii) Citi does not guarantee and is not liable to
the client for the performance of the CCP or the depository
institution and (iv) the client cash balances are legally isolated
from Citi’s bankruptcy estate. The total amount of cash initial
margin collected and remitted in this manner was
approximately $16.6 billion and $13.3 billion as of
December 31, 2020 and 2019, respectively.
Variation margin due from clients to the respective CCP,
or from the CCP to clients, reflects changes in the value of the
client’s derivative contracts for each trading day. As a clearing
member, Citi is exposed to the risk of non-performance by
clients (e.g., failure of a client to post variation margin to the
CCP for negative changes in the value of the client’s
derivative contracts). In the event of non-performance by a
client, Citi would move to close out the client’s positions. The
CCP would typically utilize initial margin posted by the client
and held by the CCP, with any remaining shortfalls required to
be paid by Citi as clearing member. Citi generally holds
incremental cash or securities margin posted by the client,
which would typically be expected to be sufficient to mitigate
Citi’s credit risk in the event that the client fails to perform.
As required by ASC 860-30-25-5, securities collateral
posted by clients is not recognized on Citi’s Consolidated
Balance Sheet.
288
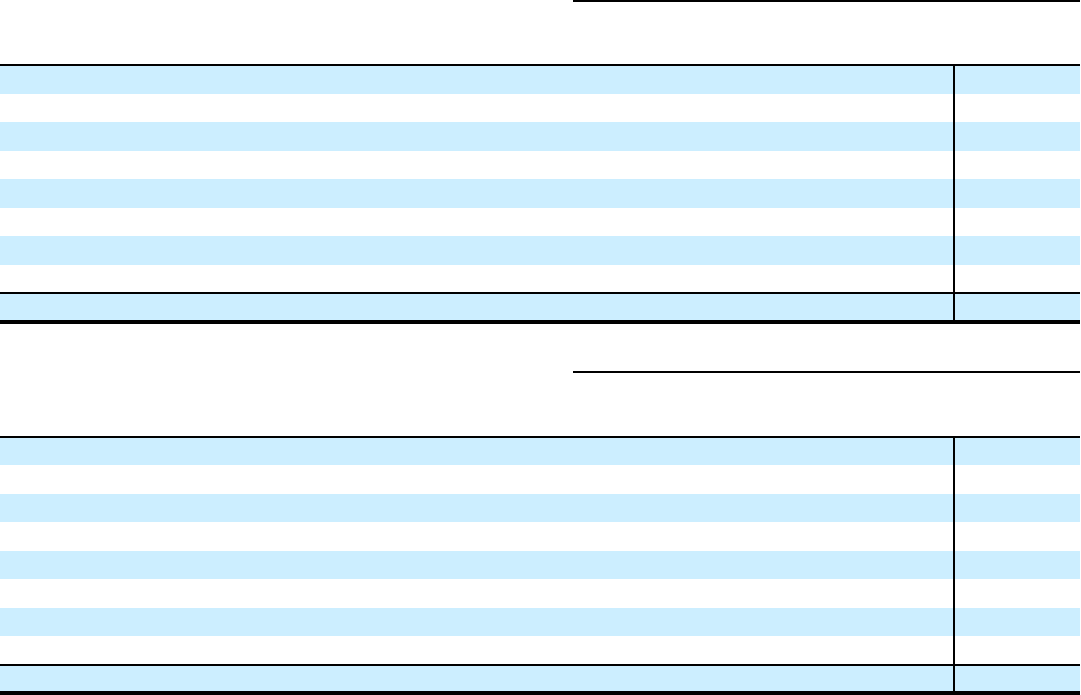
Carrying Value—Guarantees and Indemnifications
At December 31, 2020 and 2019, the total carrying amounts of
the liabilities related to the guarantees and indemnifications
included in the tables above amounted to approximately $2.2
billion and $1.2 billion, respectively. The carrying value of
financial and performance guarantees is included in Other
liabilities. For loans sold with recourse, the carrying value of
the liability is included in Other liabilities.
Collateral
Cash collateral available to Citi to reimburse losses realized
under these guarantees and indemnifications amounted to
$51.6 billion and $46.7 billion at December 31, 2020 and
2019, respectively. Securities and other marketable assets held
as collateral amounted to $80.1 billion and $58.6 billion at
December 31, 2020 and 2019, respectively. The majority of
collateral is held to reimburse losses realized under securities
lending indemnifications. In addition, letters of credit in favor
of Citi held as collateral amounted to $6.6 billion and
$4.4 billion at December 31, 2020 and 2019, respectively.
Other property may also be available to Citi to cover losses
under certain guarantees and indemnifications; however, the
value of such property has not been determined.
Performance Risk
Citi evaluates the performance risk of its guarantees based on
the assigned referenced counterparty internal or external
ratings. Where external ratings are used, investment-grade
ratings are considered to be Baa/BBB and above, while
anything below is considered non-investment grade. Citi’s
internal ratings are in line with the related external rating
system. On certain underlying referenced assets or entities,
ratings are not available. Such referenced assets are included
in the “not rated” category. The maximum potential amount of
the future payments related to the outstanding guarantees is
determined to be the notional amount of these contracts, which
is the par amount of the assets guaranteed.
Presented in the tables below are the maximum potential
amounts of future payments that are classified based on
internal and external credit ratings. The determination of the
maximum potential future payments is based on the notional
amount of the guarantees without consideration of possible
recoveries under recourse provisions or from collateral held or
pledged. As such, Citi believes such amounts bear no
relationship to the anticipated losses, if any, on these
guarantees.
Maximum potential amount of future payments
In billions of dollars at December 31, 2020
Investment
grade
Non-
investment
grade
Not
rated Total
Financial standby letters of credit $ 78.5 $ 14.6 $ 0.6 $ 93.7
Performance guarantees 9.8 3.0 0.5 13.3
Derivative instruments deemed to be guarantees — — 80.9 80.9
Loans sold with recourse — — 1.2 1.2
Securities lending indemnifications — — 112.2 112.2
Credit card merchant processing — — 101.9 101.9
Credit card arrangements with partners — — 1.0 1.0
Custody indemnifications and other 24.9 12.4 — 37.3
Total $ 113.2 $ 30.0 $ 298.3 $ 441.5
Maximum potential amount of future payments
In billions of dollars at December 31, 2019
Investment
grade
Non-
investment
grade
Not
rated Total
Financial standby letters of credit $ 81.2 $ 11.6 $ 0.5 $ 93.3
Performance guarantees 9.7 2.3 0.4 12.4
Derivative instruments deemed to be guarantees — — 96.0 96.0
Loans sold with recourse — — 1.2 1.2
Securities lending indemnifications — — 87.8 87.8
Credit card merchant processing — — 91.6 91.6
Credit card arrangements with partners — — 0.6 0.6
Custody indemnifications and other 21.3 12.4 — 33.7
Total $ 112.2 $ 26.3 $ 278.1 $ 416.6
289
Credit Commitments and Lines of Credit
The table below summarizes Citigroup’s credit commitments:
In millions of dollars
U.S.
Outside of
U.S.
December 31,
2020
December 31,
2019
Commercial and similar letters of credit $ 658 $ 4,563 $ 5,221 $ 4,533
One- to four-family residential mortgages 2,654 2,348 5,002 3,721
Revolving open-end loans secured by one- to four-family residential properties 8,326 1,300 9,626 10,799
Commercial real estate, construction and land development 11,256 1,611 12,867 12,981
Credit card lines 606,768 103,631 710,399 708,023
Commercial and other consumer loan commitments 201,969 120,489 322,458 324,359
Other commitments and contingencies 5,177 538 5,715 1,948
Total $ 836,808 $ 234,480 $ 1,071,288 $ 1,066,364
The majority of unused commitments are contingent upon
customers’ maintaining specific credit standards.
Commercial commitments generally have floating interest
rates and fixed expiration dates and may require payment of
fees. Such fees (net of certain direct costs) are deferred and,
upon exercise of the commitment, amortized over the life of
the loan or, if exercise is deemed remote, amortized over the
commitment period.
Commercial and Similar Letters of Credit
A commercial letter of credit is an instrument by which
Citigroup substitutes its credit for that of a customer to enable
the customer to finance the purchase of goods or to incur other
commitments. Citigroup issues a letter on behalf of its client to
a supplier and agrees to pay the supplier upon presentation of
documentary evidence that the supplier has performed in
accordance with the terms of the letter of credit. When a letter
of credit is drawn, the customer is then required to reimburse
Citigroup.
One- to Four-Family Residential Mortgages
A one- to four-family residential mortgage commitment is a
written confirmation from Citigroup to a seller of a property
that the bank will advance the specified sums enabling the
buyer to complete the purchase.
Revolving Open-End Loans Secured by One- to Four-Family
Residential Properties
Revolving open-end loans secured by one- to four-family
residential properties are essentially home equity lines of
credit. A home equity line of credit is a loan secured by a
primary residence or second home to the extent of the excess
of fair market value over the debt outstanding for the first
mortgage.
Commercial Real Estate, Construction and Land
Development
Commercial real estate, construction and land development
include unused portions of commitments to extend credit for
the purpose of financing commercial and multifamily
residential properties as well as land development projects.
Both secured-by-real-estate and unsecured commitments
are included in this line, as well as undistributed loan
proceeds, where there is an obligation to advance for
construction progress payments. However, this line only
includes those extensions of credit that, once funded, will be
classified as Total loans, net on the Consolidated Balance
Sheet.
Credit Card Lines
Citigroup provides credit to customers by issuing credit cards.
The credit card lines are cancelable by providing notice to the
cardholder or without such notice as permitted by local law.
Commercial and Other Consumer Loan Commitments
Commercial and other consumer loan commitments include
overdraft and liquidity facilities as well as commercial
commitments to make or purchase loans, purchase third-party
receivables, provide note issuance or revolving underwriting
facilities and invest in the form of equity.
Other Commitments and Contingencies
Other commitments and contingencies include all other
transactions related to commitments and contingencies not
reported on the lines above.
Unsettled Reverse Repurchase and Securities Borrowing
Agreements and Unsettled Repurchase and Securities
Lending Agreements
In addition, in the normal course of business, Citigroup enters
into reverse repurchase and securities borrowing agreements,
as well as repurchase and securities lending agreements, which
settle at a future date. At December 31, 2020 and 2019,
Citigroup had approximately $71.8 billion and $34.0 billion in
unsettled reverse repurchase and securities borrowing
agreements, and $62.5 billion and $38.7 billion in unsettled
repurchase and securities lending agreements, respectively.
For a further discussion of securities purchased under
agreements to resell and securities borrowed, and securities
sold under agreements to repurchase and securities loaned,
including the Company’s policy for offsetting repurchase and
reverse repurchase agreements, see Note 11 to the
Consolidated Financial Statements.
290
27. CONTINGENCIES
Accounting and Disclosure Framework
ASC 450 governs the disclosure and recognition of loss
contingencies, including potential losses from litigation,
regulatory, tax and other matters. ASC 450 defines a “loss
contingency” as “an existing condition, situation, or set of
circumstances involving uncertainty as to possible loss to an
entity that will ultimately be resolved when one or more future
events occur or fail to occur.” It imposes different
requirements for the recognition and disclosure of loss
contingencies based on the likelihood of occurrence of the
contingent future event or events. It distinguishes among
degrees of likelihood using the following three terms:
“probable,” meaning that “the future event or events are likely
to occur”; “remote,” meaning that “the chance of the future
event or events occurring is slight”; and “reasonably possible,”
meaning that “the chance of the future event or events
occurring is more than remote but less than likely.” These
three terms are used below as defined in ASC 450.
Accruals. ASC 450 requires accrual for a loss contingency
when it is “probable that one or more future events will occur
confirming the fact of loss” and “the amount of the loss can be
reasonably estimated.” In accordance with ASC 450,
Citigroup establishes accruals for contingencies, including the
litigation, regulatory and tax matters disclosed herein, when
Citigroup believes it is probable that a loss has been incurred
and the amount of the loss can be reasonably estimated. When
the reasonable estimate of the loss is within a range of
amounts, the minimum amount of the range is accrued, unless
some higher amount within the range is a better estimate than
any other amount within the range. Once established, accruals
are adjusted from time to time, as appropriate, in light of
additional information. The amount of loss ultimately incurred
in relation to those matters may be substantially higher or
lower than the amounts accrued for those matters.
Disclosure. ASC 450 requires disclosure of a loss
contingency if “there is at least a reasonable possibility that a
loss or an additional loss may have been incurred” and there is
no accrual for the loss because the conditions described above
are not met or an exposure to loss exists in excess of the
amount accrued. In accordance with ASC 450, if Citigroup has
not accrued for a matter because Citigroup believes that a loss
is reasonably possible but not probable, or that a loss is
probable but not reasonably estimable, and the reasonably
possible loss is material, it discloses the loss contingency. In
addition, Citigroup discloses matters for which it has accrued
if it believes a reasonably possible exposure to material loss
exists in excess of the amount accrued. In accordance with
ASC 450, Citigroup’s disclosure includes an estimate of the
reasonably possible loss or range of loss for those matters as to
which an estimate can be made. ASC 450 does not require
disclosure of an estimate of the reasonably possible loss or
range of loss where an estimate cannot be made. Neither
accrual nor disclosure is required for losses that are deemed
remote.
Litigation, Regulatory and Other Contingencies
Overview. In addition to the matters described below, in the
ordinary course of business, Citigroup, its affiliates and
subsidiaries, and current and former officers, directors and
employees (for purposes of this section, sometimes
collectively referred to as Citigroup and Related Parties)
routinely are named as defendants in, or as parties to, various
legal actions and proceedings. Certain of these actions and
proceedings assert claims or seek relief in connection with
alleged violations of consumer protection, fair lending,
securities, banking, antifraud, antitrust, anti-money laundering,
employment and other statutory and common laws. Certain of
these actual or threatened legal actions and proceedings
include claims for substantial or indeterminate compensatory
or punitive damages, or for injunctive relief, and in some
instances seek recovery on a class-wide basis.
In the ordinary course of business, Citigroup and Related
Parties also are subject to governmental and regulatory
examinations, information-gathering requests, investigations
and proceedings (both formal and informal), certain of which
may result in adverse judgments, settlements, fines, penalties,
restitution, disgorgement, injunctions or other relief. In
addition, certain affiliates and subsidiaries of Citigroup are
banks, registered broker-dealers, futures commission
merchants, investment advisors or other regulated entities and,
in those capacities, are subject to regulation by various U.S.,
state and foreign securities, banking, commodity futures,
consumer protection and other regulators. In connection with
formal and informal inquiries by these regulators, Citigroup
and such affiliates and subsidiaries receive numerous requests,
subpoenas and orders seeking documents, testimony and other
information in connection with various aspects of their
regulated activities. From time to time Citigroup and Related
Parties also receive grand jury subpoenas and other requests
for information or assistance, formal or informal, from federal
or state law enforcement agencies including, among others,
various United States Attorneys’ Offices, the Asset Forfeiture
and Money Laundering Section and other divisions of the
Department of Justice, the Financial Crimes Enforcement
Network of the United States Department of the Treasury, and
the Federal Bureau of Investigation relating to Citigroup and
its customers.
Because of the global scope of Citigroup’s operations, and
its presence in countries around the world, Citigroup and
Related Parties are subject to litigation and governmental and
regulatory examinations, information-gathering requests,
investigations and proceedings (both formal and informal) in
multiple jurisdictions with legal, regulatory and tax regimes
that may differ substantially, and present substantially
different risks, from those Citigroup and Related Parties are
subject to in the United States. In some instances, Citigroup
and Related Parties may be involved in proceedings involving
the same subject matter in multiple jurisdictions, which may
result in overlapping, cumulative or inconsistent outcomes.
Citigroup seeks to resolve all litigation, regulatory, tax
and other matters in the manner management believes is in the
best interests of Citigroup and its shareholders, and contests
liability, allegations of wrongdoing and, where applicable, the
amount of damages or scope of any penalties or other relief
sought as appropriate in each pending matter.
291
Inherent Uncertainty of the Matters Disclosed. Certain of
the matters disclosed below involve claims for substantial or
indeterminate damages. The claims asserted in these matters
typically are broad, often spanning a multiyear period and
sometimes a wide range of business activities, and the
plaintiffs’ or claimants’ alleged damages frequently are not
quantified or factually supported in the complaint or statement
of claim. Other matters relate to regulatory investigations or
proceedings, as to which there may be no objective basis for
quantifying the range of potential fine, penalty or other
remedy. As a result, Citigroup is often unable to estimate the
loss in such matters, even if it believes that a loss is probable
or reasonably possible, until developments in the case,
proceeding or investigation have yielded additional
information sufficient to support a quantitative assessment of
the range of reasonably possible loss. Such developments may
include, among other things, discovery from adverse parties or
third parties, rulings by the court on key issues, analysis by
retained experts and engagement in settlement negotiations.
Depending on a range of factors, such as the complexity of the
facts, the novelty of the legal theories, the pace of discovery,
the court’s scheduling order, the timing of court decisions and
the adverse party’s, regulator’s or other authority’s willingness
to negotiate in good faith toward a resolution, it may be
months or years after the filing of a case or commencement of
a proceeding or an investigation before an estimate of the
range of reasonably possible loss can be made.
Matters as to Which an Estimate Can Be Made. For some
of the matters disclosed below, Citigroup is currently able to
estimate a reasonably possible loss or range of loss in excess
of amounts accrued (if any). For some of the matters included
within this estimation, an accrual has been made because a
loss is believed to be both probable and reasonably estimable,
but an exposure to loss exists in excess of the amount accrued.
In these cases, the estimate reflects the reasonably possible
range of loss in excess of the accrued amount. For other
matters included within this estimation, no accrual has been
made because a loss, although estimable, is believed to be
reasonably possible, but not probable; in these cases, the
estimate reflects the reasonably possible loss or range of loss.
As of December 31, 2020, Citigroup estimates that the
reasonably possible unaccrued loss for these matters ranges up
to approximately $1.4 billion in the aggregate.
These estimates are based on currently available
information. As available information changes, the matters for
which Citigroup is able to estimate will change, and the
estimates themselves will change. In addition, while many
estimates presented in financial statements and other financial
disclosures involve significant judgment and may be subject to
significant uncertainty, estimates of the range of reasonably
possible loss arising from litigation, regulatory and tax
proceedings are subject to particular uncertainties. For
example, at the time of making an estimate, (i) Citigroup may
have only preliminary, incomplete, or inaccurate information
about the facts underlying the claim, (ii) its assumptions about
the future rulings of the court, other tribunal or authority on
significant issues, or the behavior and incentives of adverse
parties, regulators or other authorities, may prove to be wrong
and (iii) the outcomes it is attempting to predict are often not
amenable to the use of statistical or other quantitative
analytical tools. In addition, from time to time an outcome
may occur that Citigroup had not accounted for in its estimate
because it had deemed such an outcome to be remote. For all
of these reasons, the amount of loss in excess of accruals
ultimately incurred for the matters as to which an estimate has
been made could be substantially higher or lower than the
range of loss included in the estimate.
Matters as to Which an Estimate Cannot Be Made. For
other matters disclosed below, Citigroup is not currently able
to estimate the reasonably possible loss or range of loss. Many
of these matters remain in very preliminary stages (even in
some cases where a substantial period of time has passed since
the commencement of the matter), with few or no substantive
legal decisions by the court, tribunal or other authority
defining the scope of the claims, the class (if any) or the
potentially available damages or other exposure, and fact
discovery is still in progress or has not yet begun. In many of
these matters, Citigroup has not yet answered the complaint or
statement of claim or asserted its defenses, nor has it engaged
in any negotiations with the adverse party (whether a
regulator, taxing authority or a private party). For all these
reasons, Citigroup cannot at this time estimate the reasonably
possible loss or range of loss, if any, for these matters.
Opinion of Management as to Eventual Outcome. Subject
to the foregoing, it is the opinion of Citigroup’s management,
based on current knowledge and after taking into account its
current legal or other accruals, that the eventual outcome of all
matters described in this Note would not likely have a material
adverse effect on the consolidated financial condition of
Citigroup. Nonetheless, given the substantial or indeterminate
amounts sought in certain of these matters, and the inherent
unpredictability of such matters, an adverse outcome in certain
of these matters could, from time to time, have a material
adverse effect on Citigroup’s consolidated results of
operations or cash flows in particular quarterly or annual
periods.
ANZ Underwriting Matter
In 2018, the Australian Commonwealth Director of Public
Prosecutions (CDPP) filed charges against Citigroup Global
Markets Australia Pty Limited (CGMA) for alleged criminal
cartel offenses following a referral by the Australian
Competition and Consumer Commission. CDPP alleges that
the cartel conduct took place following an institutional share
placement by Australia and New Zealand Banking Group
Limited (ANZ) in August 2015, where CGMA acted as joint
underwriter and lead manager with other banks. CDPP also
charged other banks and individuals, including current and
former Citi employees. Separately, the Australian Securities
and Investments Commission is conducting an investigation,
and CGMA is cooperating with the investigation. Charges
relating to CGMA are captioned R v. CITIGROUP GLOBAL
MARKETS AUSTRALIA PTY LIMITED. The matter is
before the Federal Court in New South Wales, Australia.
Additional information concerning this action is publicly
available in court filings under the docket number NSD 1316 -
NSD 1324/2020.
292
Facilitation Trading Matters
Regulatory agencies in Asia Pacific countries and elsewhere
are conducting investigations or making inquiries regarding
Citigroup affiliates’ equity sales trading desks in connection
with facilitation trades, which are securities transactions in
which Citigroup trades fully or partially as principal. Citigroup
is cooperating with these investigations and inquiries.
Foreign Exchange Matters
Regulatory Actions: Government and regulatory agencies in
the U.S. and in other jurisdictions are conducting
investigations or making inquiries regarding Citigroup’s
foreign exchange business. Citigroup is cooperating with these
and related investigations and inquiries.
Antitrust and Other Litigation: In 2018, a number of
institutional investors who opted out of the previously
disclosed August 2018 final settlement filed an action against
Citigroup, Citibank, Citigroup Global Markets Inc. (CGMI)
and other defendants, captioned ALLIANZ GLOBAL
INVESTORS, ET AL. v. BANK OF AMERICA CORP., ET
AL., in the United States District Court for the Southern
District of New York. Plaintiffs allege that defendants
manipulated, and colluded to manipulate, the foreign exchange
markets. Plaintiffs assert claims under the Sherman Act and
unjust enrichment claims, and seek consequential and punitive
damages and other forms of relief. On July 28, 2020, plaintiffs
filed a third amended complaint. Additional information
concerning this action is publicly available in court filings
under the docket number 18 Civ. 10364 (S.D.N.Y.)
(Schofield, J.).
In 2018, a group of institutional investors issued a claim
against Citigroup, Citibank and other defendants, captioned
ALLIANZ GLOBAL INVESTORS GMBH AND OTHERS v.
BARCLAYS BANK PLC AND OTHERS, in the High Court
of Justice in London. Claimants allege that defendants
manipulated, and colluded to manipulate, the foreign exchange
market in violation of EU and U.K. competition laws.
Additional information concerning this action is publicly
available in court filings under the case number
CL-2018-000840.
In 2015, a putative class of consumers and businesses in
the U.S. who directly purchased supracompetitive foreign
currency at benchmark exchange rates filed an action against
Citigroup and other defendants, captioned NYPL v.
JPMORGAN CHASE & CO., ET AL., in the United States
District Court for the Northern District of California (later
transferred to the United States District Court for the Southern
District of New York). Subsequently, plaintiffs filed an
amended class action complaint against Citigroup, Citibank
and Citicorp as defendants. Plaintiffs allege that they suffered
losses as a result of defendants’ alleged manipulation of, and
collusion with respect to, the foreign exchange market.
Plaintiffs assert claims under federal and California antitrust
and consumer protection laws, and seek compensatory
damages, treble damages and declaratory and injunctive relief.
Additional information concerning this action is publicly
available in court filings under the docket numbers 15 Civ.
2290 (N.D. Cal.) (Chhabria, J.) and 15 Civ. 9300 (S.D.N.Y.)
(Schofield, J.).
In 2017, putative classes of indirect purchasers of certain
foreign exchange instruments filed an action against Citigroup,
Citibank, Citicorp, CGMI and other defendants, captioned
CONTANT, ET AL. v. BANK OF AMERICA CORP., ET
AL., in the United States District Court for the Southern
District of New York. Plaintiffs allege that defendants
engaged in a conspiracy to fix currency prices. Plaintiffs assert
claims under the Sherman Act and various state antitrust laws,
and seek compensatory damages and treble damages. On
November 19, 2020, the court granted final approval of a
settlement between plaintiffs and Citigroup, Citibank, Citicorp
and CGMI. Additional information concerning this action is
publicly available in court filings under the docket number 17
Civ. 3139 (S.D.N.Y.) (Schofield, J.).
In 2019, an application, captioned MICHAEL
O’HIGGINS FX CLASS REPRESENTATIVE LIMITED v.
BARCLAYS BANK PLC AND OTHERS, was made to the
U.K.’s Competition Appeal Tribunal requesting permission to
commence collective proceedings against Citigroup, Citibank
and other defendants. The application seeks compensatory
damages for losses alleged to have arisen from the actions at
issue in the European Commission’s foreign exchange spot
trading infringement decision (European Commission
Decision of May 16, 2019 in Case AT.40135-FOREX (Three
Way Banana Split) C(2019) 3631 final). Additional
information concerning this action is publicly available in
court filings under the case number 1329/7/7/19.
In 2019, an application, captioned PHILLIP EVANS v.
BARCLAYS BANK PLC AND OTHERS, was made to the
U.K.’s Competition Appeal Tribunal requesting permission to
commence collective proceedings against Citigroup, Citibank
and other defendants. The application seeks compensatory
damages similar to those in the Michael O’Higgins FX Class
Representative Limited application. Additional information
concerning this action is publicly available in court filings
under the case number 1336/7/7/19.
In 2019, a putative class action was filed against Citibank
and other defendants, captioned J WISBEY & ASSOCIATES
PTY LTD v. UBS AG & ORS, in the Federal Court of
Australia. Plaintiffs allege that defendants manipulated the
foreign exchange markets. Plaintiffs assert claims under
antitrust laws, and seek compensatory damages and
declaratory and injunctive relief. Additional information
concerning this action is publicly available in court filings
under the docket number VID567/2019.
In 2019, two motions for certification of class actions
filed against Citigroup, Citibank and Citicorp and other
defendants were consolidated, under the caption GERTLER,
ET AL. v. DEUTSCHE BANK AG, in the Tel Aviv Central
District Court in Israel. Plaintiffs allege that defendants
manipulated the foreign exchange markets. A hearing on
Citibank’s motion to dismiss plaintiffs’ petition for
certification is scheduled for April 12, 2021. Additional
information concerning this action is publicly available in
court filings under the docket number CA 29013-09-18.
293
Hong Kong Private Bank Litigation
In 2007, a claim was filed in the High Court of Hong Kong
claiming damages of over $51 million against Citibank. The
case, captioned PT ASURANSI TUGU PRATAMA
INDONESIA TBK v. CITIBANK N.A., was dismissed in
2018 by the Hong Kong Court of First Instance on grounds
that the claim was time-barred. Plaintiff has appealed the
court’s dismissal. Additional information concerning this
action is publicly available in court filings under the docket
number CACV 548/2018.
Interbank Offered Rates-Related Litigation and Other
Matters
Antitrust and Other Litigation: In 2016, a putative class action
was filed against Citibank, Citigroup and other defendants,
now captioned FUND LIQUIDATION HOLDINGS LLC, AS
ASSIGNOR AND SUCCESSOR-IN-INTEREST TO
FRONTPOINT ASIAN EVENT DRIVEN FUND L.P., ET
AL. v. CITIBANK, N.A., ET AL., in the United States District
Court for the Southern District of New York. Plaintiffs allege
that defendants manipulated the Singapore Interbank Offered
Rate and Singapore Swap Offer Rate. Plaintiffs assert claims
under the Sherman Act, the Clayton Act, the RICO Act and
state law. In 2018, plaintiffs entered into a settlement with
Citigroup and Citibank, under which Citigroup and Citibank
agreed to pay approximately $10 million. In July 2019, the
court found that it lacked subject-matter jurisdiction over the
non-settling defendants and dismissed the case. The court also
found that it lacked jurisdiction to approve the settlement and
denied plaintiffs’ motion for preliminary approval of the
settlement. In August 2019, plaintiffs filed an appeal with the
United States Court of Appeals for the Second Circuit.
Additional information concerning this action is publicly
available in court filings under the docket numbers 16 Civ.
5263 (S.D.N.Y.) (Hellerstein, J.) and 19-2719 (2d Cir.).
In 2016, Banque Delubac filed an action against
Citigroup, Citigroup Global Markets Limited (CGML) and
Citigroup Europe Plc, captioned SCS BANQUE DELUBAC
& CIE v. CITIGROUP INC., ET AL., in the Commercial
Court of Aubenas in France. Plaintiff alleges that defendants
suppressed LIBOR submissions between 2005 and 2012 and
that Banque Delubac’s EURIBOR-linked lending activity was
negatively impacted as a result. Plaintiff asserts a claim under
tort law, and seeks compensatory damages and consequential
damages. In November 2018, the Commercial Court of
Aubenas referred the case to the Commercial Court of
Marseille. In March 2019, the Court of Appeal of Nîmes held
that neither the Commercial Court of Aubenas nor any other
court of France has territorial jurisdiction over Banque
Delubac’s claims. In May 2019, plaintiff filed an appeal
before the Cour de cassation of France challenging the Court
of Appeal of Nîmes’s decision. Additional information
concerning this action is publicly available in court filings
under docket numbers RG no. 2018F02750 in the Commercial
Court of Marseille and 19-16.931 in the Cour de cassation.
In May 2019, three putative class actions filed against
Citigroup, Citibank, CGMI and other defendants were
consolidated, under the caption IN RE ICE LIBOR
ANTITRUST LITIGATION, in the United States District
Court of the Southern District of New York. In July 2019,
plaintiffs filed a consolidated amended complaint. Plaintiffs
allege that defendants suppressed ICE LIBOR. Plaintiffs assert
claims under the Sherman Act, the Clayton Act, and unjust
enrichment, and seek compensatory damages, disgorgement,
and treble damages. In March 2020, the court granted
defendants’ motion to dismiss the action for failure to state a
claim, which plaintiffs appealed to the United States Court of
Appeals for the Second Circuit. On December 28, 2020, DYJ
Holdings, LLC filed a motion to intervene as a plaintiff, given
that the existing plaintiffs intended to withdraw from the case,
which defendants opposed and separately moved to dismiss
for lack of subject matter jurisdiction. Additional information
concerning this action is publicly available in court filings
under the docket numbers 19 Civ. 439 (S.D.N.Y.) (Daniels, J.)
and 20-1492 (2d Cir.).
On August 18, 2020, individual borrowers and consumers
of loans and credit cards filed an action against Citigroup,
Citibank, CGMI and other defendants, captioned
MCCARTHY, ET AL. v. INTERCONTINENTAL
EXCHANGE, INC., ET AL., in the United States District
Court for the Northern District of California. Plaintiffs allege
that defendants conspired to fix ICE LIBOR, assert claims
under the Sherman Act and the Clayton Act, and seek
declaratory relief, injunctive relief, and treble damages. On
November 11, 2020, defendants filed a motion to transfer the
case to the United States District Court for the Southern
District of New York. Additional information concerning this
action is publicly available in court filings under the docket
number 20 Civ. 5832 (N.D. Cal.) (Donato, J.).
Interchange Fee Litigation
Beginning in 2005, several putative class actions were filed
against Citigroup, Citibank, and Citicorp, together with Visa,
MasterCard, and other banks and their affiliates, in various
federal district courts and consolidated with other related
individual cases in a multi-district litigation proceeding in the
United States District Court for the Eastern District of New
York. This proceeding is captioned IN RE PAYMENT CARD
INTERCHANGE FEE AND MERCHANT DISCOUNT
ANTITRUST LITIGATION.
The plaintiffs, merchants that accept Visa and MasterCard
branded payment cards, as well as various membership
associations that claim to represent certain groups of
merchants, allege, among other things, that defendants have
engaged in conspiracies to set the price of interchange and
merchant discount fees on credit and debit card transactions
and to restrain trade unreasonably through various Visa and
MasterCard rules governing merchant conduct, all in violation
of Section 1 of the Sherman Act and certain California
statutes. Plaintiffs further alleged violations of Section 2 of the
Sherman Act. Supplemental complaints also were filed against
defendants in the putative class actions alleging that Visa’s
and MasterCard’s respective initial public offerings were
anticompetitive and violated Section 7 of the Clayton Act, and
that MasterCard’s initial public offering constituted a
fraudulent conveyance.
In 2014, the district court entered a final judgment
approving the terms of a class settlement. Various objectors
appealed from the final class settlement approval order to the
United States Court of Appeals for the Second Circuit.
294
In 2016, the Court of Appeals reversed the district court’s
approval of the class settlement and remanded for further
proceedings. The district court thereafter appointed separate
interim counsel for a putative class seeking damages and a
putative class seeking injunctive relief. Amended or new
complaints on behalf of the putative classes and various
individual merchants were subsequently filed, including a
further amended complaint on behalf of a putative damages
class and a new complaint on behalf of a putative injunctive
class, both of which named Citigroup and Related Parties. In
addition, numerous merchants have filed amended or new
complaints against Visa, MasterCard, and in some instances
one or more issuing banks, including Citigroup and affiliates.
In 2019, the district court granted the damages class
plaintiffs’ motion for final approval of a new settlement with
the defendants. The settlement involves the damages class
only and does not settle the claims of the injunctive relief class
or any actions brought on a non-class basis by individual
merchants. The settlement provides for a cash payment to the
damages class of $6.24 billion, later reduced by $700 million
based on the transaction volume of class members that opted-
out from the settlement. Several merchants and merchant
groups have appealed the final approval order. Additional
information concerning these consolidated actions is publicly
available in court filings under the docket number MDL
05-1720 (E.D.N.Y.) (Brodie, J.).
Interest Rate and Credit Default Swap Matters
Regulatory Actions: The Commodity Futures Trading
Commission (CFTC) is conducting an investigation into
alleged anticompetitive conduct in the trading and clearing of
interest rate swaps (IRS) by investment banks. Citigroup is
cooperating with the investigation.
Antitrust and Other Litigation: Beginning in 2015,
Citigroup, Citibank, CGMI, CGML, and numerous other
parties were named as defendants in a number of industry-
wide putative class actions related to IRS trading. These
actions have been consolidated in the United States District
Court for the Southern District of New York under the caption
IN RE INTEREST RATE SWAPS ANTITRUST
LITIGATION. The actions allege that defendants colluded to
prevent the development of exchange-like trading for IRS and
assert federal and state antitrust claims and claims for unjust
enrichment. Also consolidated under the same caption are
individual actions filed by swap execution facilities, asserting
federal and state antitrust claims, as well as claims for unjust
enrichment and tortious interference with business relations.
Plaintiffs in all of these actions seek treble damages, fees,
costs, and injunctive relief. Lead plaintiffs in the class action
moved for class certification in 2019, and subsequently filed
an amended complaint. Additional information concerning
these actions is publicly available in court filings under the
docket numbers 18-CV-5361 (S.D.N.Y.) (Oetken, J.) and 16-
MD-2704 (S.D.N.Y.) (Oetken, J.).
In 2017, Citigroup, Citibank, CGMI, CGML and
numerous other parties were named as defendants in an action
filed in the United States District Court for the Southern
District of New York under the caption TERA GROUP, INC.,
ET AL. v. CITIGROUP, INC., ET AL. The complaint alleges
that defendants colluded to prevent the development of
exchange-like trading for credit default swaps and asserts
federal and state antitrust claims and state law tort claims. In
January 2020, plaintiffs filed an amended complaint, which
defendants later moved to dismiss. Additional information
concerning this action is publicly available in court filings
under the docket number 17-CV-4302 (S.D.N.Y.) (Sullivan,
J.).
Parmalat Litigation
In 2004, an Italian commissioner appointed to oversee the
administration of various Parmalat companies filed a
complaint against Citigroup, Citibank, and related parties,
alleging that the defendants facilitated a number of frauds by
Parmalat insiders. In 2008, a jury rendered a verdict in
Citigroup’s favor and awarded Citi $431 million. In 2019, the
Italian Supreme Court affirmed the decision in the full amount
of $431 million. Citigroup has taken steps to enforce the
judgment in Italian and Belgian courts. Additional information
concerning these actions is publicly available in court filings
under the docket numbers 27618/2014, 4133/2019, and
22098/2019 (Italy), and 20/3617/A and 20/4007/A (Brussels).
In 2015, Parmalat filed a claim in an Italian civil court in
Milan claiming damages of €1.8 billion against Citigroup,
Citibank, and related parties. The Milan court dismissed
Parmalat’s claim on grounds that it was duplicative of
Parmalat’s previously unsuccessful claims. In 2019, the Milan
Court of Appeal rejected Parmalat’s appeal of the Milan
court’s dismissal. In June 2019, Parmalat filed a further appeal
with the Italian Supreme Court. Additional information
concerning this action is publicly available in court filings
under the docket numbers 1009/2018 and 20598/2019.
On January 29, 2020, Parmalat, its three directors, and its
sole shareholder, Sofil S.a.s., as co-plaintiffs, filed a claim
before the Italian civil court in Milan seeking a declaratory
judgment that they do not owe compensatory damages of
€990 million to Citibank. On November 5, 2020, Citibank
joined the proceedings, seeking dismissal of the declaratory
judgment application. Additional information concerning this
action is publicly available in court filings under the docket
number 8611/2020.
Payment Protection Insurance
Regulators and courts in the U.K. have scrutinized the selling
of payment protection insurance (PPI) by financial institutions
for several years. Citibank continues to review customer
claims relating to the sale of PPI in the U.K., to grant redress
in accordance with the requirements of the U.K. Financial
Conduct Authority, and to defend claims filed in U.K. courts.
Revlon Credit Facility Litigation
On August 12, 2020, Citibank and numerous other parties
were named as defendants in an action filed in the United
States District Court for the Southern District of New York
under the caption UMB BANK, NATIONAL ASSOCIATION
v. REVLON, INC., ET AL. Plaintiff alleged that, with respect
to a 2016 credit agreement between Revlon and various
lenders for which Citibank served as administrative and
collateral agent, the defendants deprived lenders of the
collateral securing loans they made to Revlon under the credit
agreement. On November 8, 2020, plaintiffs withdrew the case
295
without prejudice. Additional information concerning this
action is publicly available in court filings under the docket
number 20-CV-6352 (S.D.N.Y.) (Schofield, J.).
Revlon-related Wire Transfer Litigation
On August 17, 18, and 20, 2020, Citibank filed actions in the
United States District Court for the Southern District of New
York, which have been consolidated under the caption IN RE
CITIBANK AUGUST 11, 2020 WIRE TRANSFERS. The
actions relate to a payment erroneously made by Citibank on
August 11, 2020, in its capacity as administrative agent for a
Revlon credit facility. The action seeks the return of the
erroneously transferred funds from certain fund managers.
Citibank has asserted claims for unjust enrichment,
conversion, money had and received, and payment by mistake.
The court issued temporary restraining orders related to the
subject funds. A trial was held in December 2020. On
February 16, 2021, the court issued a judgment in favor of the
defendants. Additional information concerning this action is
publicly available in court filings under the docket number 20-
CV-6539 (S.D.N.Y.) (Furman, J.).
Shareholder Derivative and Securities Litigation
Beginning on October 16, 2020, four derivative actions were
filed in the United States District Court for the Southern
District of New York, purportedly on behalf of Citigroup (as
nominal defendant) against Citigroup’s current directors and
certain former directors. On December 3, 2020, the actions
were consolidated under the caption IN RE CITIGROUP INC.
SHAREHOLDER DERIVATIVE LITIGATION. On
December 24, 2020, plaintiffs filed a consolidated complaint
asserting claims for breach of fiduciary duty, unjust
enrichment, and contribution and indemnification in
connection with defendants’ alleged failures to implement
adequate internal controls. In addition, the consolidated
complaint asserts derivative claims for violations of Sections
10(b) and 14(a) of the Securities Exchange Act of 1934 in
connection with statements in Citigroup’s 2019 and 2020
annual meeting proxy statements. Additional information
concerning this action is publicly available in court filings
under the docket number 1:20-cv-09438 (S.D.N.Y.) (Nathan,
J.).
Beginning on December 4, 2020, two derivative actions
were filed in the Supreme Court of the State of New York,
purportedly on behalf of Citigroup (as nominal defendant)
against Citigroup’s current directors, certain former directors,
and certain current and former officers. The actions are
captioned P. ALEXANDER ATAII v. CORBAT, ET AL. and
ASHLEY IKEDA v. CORBAT, ET AL. The complaints assert
claims for breach of fiduciary duty and unjust enrichment in
connection with defendants’ alleged failures to implement
adequate internal controls. Additional information concerning
these actions is publicly available in court filings under the
docket numbers 656759/2020 (N.Y. Sup. Ct.) and
657086/2020 (N.Y. Sup. Ct.).
Beginning on October 30, 2020, three putative class
action complaints were filed in the United States District
Court for the Southern District of New York against Citigroup
and certain of its current and former officers, asserting
violations of Sections 10(b) and 20(a) of the Securities
Exchange Act of 1934 in connection with defendants’ alleged
misstatements concerning Citigroup’s internal controls. The
actions are captioned CITY OF SUNRISE FIREFIGHTERS’
PENSION FUND v. CITIGROUP INC., ET AL., CITY OF
STERLING HEIGHTS GENERAL EMPLOYEES’
RETIREMENT SYSTEM v. CITIGROUP INC., ET AL., and
TIMOTHY LIM v. CITIGROUP INC., ET AL. Additional
information concerning these actions is publicly available in
court filings under the docket numbers 1:20-CV-9132
(S.D.N.Y.) (Nathan, J.), 1:20-CV-09573 (S.D.N.Y.) (Nathan,
J.), and 1:20-CV-10360 (S.D.N.Y.) (Nathan, J.).
Sovereign Securities Matters
Regulatory Actions: Government and regulatory agencies in
the U.S. and in other jurisdictions are conducting
investigations or making inquiries regarding Citigroup’s sales
and trading activities in connection with sovereign and other
government-related securities. Citigroup is cooperating with
these investigations and inquiries.
Antitrust and Other Litigation: In 2015, putative class
actions filed against CGMI and other defendants were
consolidated, under the caption IN RE TREASURY
SECURITIES AUCTION ANTITRUST LITIGATION, in the
United States District Court for the Southern District of New
York. In 2017, a consolidated amended complaint was filed,
alleging that defendants colluded to fix U.S. treasury auction
bids by sharing competitively sensitive information ahead of
the auctions, and that defendants colluded to boycott and
prevent the emergence of an anonymous, all-to-all electronic
trading platform in the U.S. Treasuries secondary market. The
complaint asserts claims under antitrust laws, and seeks
damages, including treble damages where authorized by
statute, and injunctive relief. In February 2018, defendants
moved to dismiss the complaint. Additional information
concerning this action is publicly available in court filings
under the docket number 15-MD-2673 (S.D.N.Y.) (Gardephe,
J.).
In 2016 and 2017, actions by putative classes of direct
purchasers of supranational, sub-sovereign and agency (SSA)
bonds filed against Citigroup, Citibank, CGMI, CGML and
other defendants were consolidated, under the caption IN RE
SSA BONDS ANTITRUST LITIGATION, in the United
States District Court for the Southern District of New York. In
2018, a second amended consolidated complaint was filed,
alleging that defendants, as market makers and traders of SSA
bonds, colluded to fix the price at which they bought and sold
SSA bonds in the secondary market. The complaint asserts
claims under the antitrust laws and unjust enrichment, and
seeks damages, including treble damages where authorized by
statute, and disgorgement. In 2019, the court granted
defendants’ motion to dismiss certain defendants, including
CGML. On June 1, 2020, plaintiffs appealed to the United
States Court of Appeals for the Second Circuit from the
district court’s grant of defendants’ remaining motion to
dismiss the second amended consolidated complaint.
Additional information concerning this action is publicly
available in court filings under the docket numbers 16 Civ.
3711 (S.D.N.Y.) (Ramos, J.) and 20-1759 (2d Cir.).
In 2017, purchasers of SSA bonds filed a proposed class
action on behalf of direct and indirect purchasers of SSA
296
bonds against Citigroup, Citibank, CGMI, CGML, Citibank
Canada, Citigroup Global Markets Canada, Inc. and other
defendants, captioned JOSEPH MANCINELLI, ET AL. v.
BANK OF AMERICA CORPORATION, ET AL., in the
Federal Court in Canada. In October 2019, plaintiffs filed an
amended claim. The complaint alleges that defendants
manipulated, and colluded to manipulate, the SSA bonds
market, asserts claims for breach of the Competition Act,
breach of foreign law, civil conspiracy, unjust enrichment,
waiver of tort, and breach of contract, and seeks compensatory
and punitive damages, among other relief. Additional
information concerning this action is publicly available in
court filings under the docket number T-1871-17 (Fed. Ct.).
In 2019, the State of Louisiana filed an action against
CGMI and other defendants, captioned STATE OF
LOUISIANA v. BANK OF AMERICA, N.A., ET AL., in the
United States District Court for the Middle District of
Louisiana. The complaint alleges that defendants conspired to
manipulate the market for bonds issued by U.S. government-
sponsored agencies. The complaint asserts a claim for a
violation of the Sherman Act, and seeks treble damages and
injunctive relief. Additional information concerning this action
is publicly available in court filings under the docket number
19 Civ. 638 (M.D. La.) (Dick, C.J.).
In 2019, the City of Baton Rouge and related plaintiffs
filed a substantially similar action against CGMI and other
defendants, captioned CITY OF BATON ROUGE, ET AL. v.
BANK OF AMERICA, N.A., ET AL., in the United States
District Court for the Middle District of Louisiana. Additional
information concerning this action is publicly available in
court filings under the docket number 19 Civ. 725 (M.D. La.)
(Dick, C.J.).
On April 1, 2020, the Louisiana Asset Management Pool
filed a substantially similar action against CGMI and other
defendants, captioned LOUISIANA ASSET MANAGEMENT
POOL v. BANK OF AMERICA CORPORATION, ET AL.,
in the United States District Court for the Eastern District of
Louisiana, which was subsequently transferred to the United
States District Court for the Middle District of Louisiana.
Additional information concerning this action is publicly
available in court filings under the docket number 21 Civ.
0003 (M.D. La.) (Dick, C.J.).
On September 21, 2020, the City of New Orleans and
related entities filed a substantially similar action against
CGMI and other defendants, captioned CITY OF NEW
ORLEANS, ET AL. v. BANK OF AMERICA
CORPORATION, ET AL., in the United States District Court
for the Eastern District of Louisiana. Additional information
concerning this action is publicly available in court filings
under the docket number 20 Civ. 2570 (E.D. La.) (Vitter, J.).
In 2018, a putative class action was filed against
Citigroup, CGMI, Citigroup Financial Products Inc., Citigroup
Global Markets Holdings Inc., Citibanamex, Grupo Banamex
and other banks, captioned IN RE MEXICAN
GOVERNMENT BONDS ANTITRUST LITIGATION, in the
United States District Court for the Southern District of New
York. The complaint alleges that defendants colluded in the
Mexican sovereign bond market. In September 2019, the court
granted defendants’ motion to dismiss. In December 2019,
plaintiffs filed an amended complaint against Citibanamex and
other market makers in the Mexican sovereign bond market.
Plaintiffs no longer assert any claims against Citigroup and
any other U.S. Citi affiliates. The amended complaint alleges a
conspiracy to fix prices in the Mexican sovereign bond market
from January 1, 2006 to April 19, 2017, and asserts antitrust
and unjust enrichment claims, and seeks treble damages,
restitution and injunctive relief. On February 21, 2020, certain
defendants, including Citibanamex, moved to dismiss the
amended, which the court later granted. Additional
information concerning this action is publicly available in
court filings under the docket number 18 Civ. 2830 (S.D.N.Y.)
(Oetken, J.).
Transaction Tax Matters
Citigroup and Citibank are engaged in litigation or
examinations with non-U.S. tax authorities, including in the
U.K., India, and Germany, concerning the payment of
transaction taxes and other non-income tax matters.
Tribune Company Bankruptcy
Certain Citigroup affiliates (along with numerous other
parties) have been named as defendants in adversary
proceedings related to the Chapter 11 cases of Tribune
Company (Tribune) filed in the United States Bankruptcy
Court for the District of Delaware, asserting claims arising out
of the approximately $11 billion leveraged buyout of Tribune
in 2007. The actions were consolidated as IN RE TRIBUNE
COMPANY FRAUDULENT CONVEYANCE LITIGATION
and transferred to the United States District Court for the
Southern District of New York.
In the adversary proceeding captioned KIRSCHNER v.
FITZSIMONS, ET AL., the litigation trustee, as successor
plaintiff to the unsecured creditors committee, seeks to avoid
and recover as actual fraudulent transfers the transfers of
Tribune stock that occurred as a part of the leveraged buyout.
Several Citigroup affiliates, along with numerous other
parties, were named as shareholder defendants and were
alleged to have tendered Tribune stock to Tribune as a part of
the buyout. In 2017, the United States District Court for the
Southern District of New York dismissed the actual fraudulent
transfer claim against the shareholder defendants, including
the Citigroup affiliates. In 2019, the litigation trustee filed an
appeal to the United States Court of Appeals for the Second
Circuit.
Several Citigroup affiliates, along with numerous other
parties, are named as defendants in certain actions brought by
Tribune noteholders, which seek to recover the transfers of
Tribune stock that occurred as a part of the leveraged buyout,
as state-law constructive fraudulent conveyances. The
noteholders’ claims were previously dismissed and the
dismissal was affirmed on appeal. In 2018, the United States
Court of Appeals for the Second Circuit withdrew its 2016
transfer of jurisdiction to the district court to reconsider its
decision in light of a recent United States Supreme Court
decision. In 2019, the Court of Appeals issued an amended
decision again affirming the dismissal. In January 2020, the
noteholders filed a petition for rehearing. On July 6, 2020, the
noteholders filed a petition for a writ of certiorari in the United
States Supreme Court. On October 5, 2020, the Supreme
297
Court called for the views of the Acting Solicitor General on
whether the petition should be granted.
CGMI was named as a defendant in a separate action,
KIRSCHNER v. CGMI, in connection with its role as advisor
to Tribune. In 2019, the court dismissed the action, which the
litigation trustee has appealed to the United States Court of
Appeals for the Second Circuit.
Additional information concerning these actions is
publicly available in court filings under the docket numbers
08-13141 (Bankr. D. Del.) (Carey, J.), 11 MD 02296
(S.D.N.Y.) (Cote, J.), 12 MC 2296 (S.D.N.Y.) (Cote, J.),
13-3992 (2d Cir.), 19-0449 (2d Cir.), 19-3049 (2d Cir.),
16-317 (U.S.), and 20-8 (U.S. Supreme Court).
Variable Rate Demand Obligation Litigation
In 2019, plaintiffs in the consolidated actions CITY OF
PHILADELPHIA v. BANK OF AMERICA CORP., ET AL.
and MAYOR AND CITY COUNCIL OF BALTIMORE v.
BANK OF AMERICA CORP., ET AL. filed a consolidated
complaint naming as defendants Citigroup, Citibank, CGMI,
CGML and numerous other industry participants. The
consolidated complaint asserts violations of the Sherman Act,
as well as claims for breach of contract, breach of fiduciary
duty, and unjust enrichment, and seeks damages and injunctive
relief based on allegations that defendants served as
remarketing agents for municipal bonds called variable rate
demand obligations (VRDOs) and colluded to set artificially
high VRDO interest rates. On November 6, 2020, the court
granted in part and denied in part defendants’ motion to
dismiss the consolidated complaint. Additional information
concerning this action is publicly available in court filings
under the docket numbers 19-CV-1608 (S.D.N.Y.) (Furman,
J.) and 19-CV-2667 (S.D.N.Y.) (Furman, J.).
Settlement Payments
Payments required in settlement agreements described above
have been made or are covered by existing litigation or other
accruals.
298
This page intentionally left blank.
299
28. CONDENSED CONSOLIDATING FINANCIAL
STATEMENTS
Citigroup amended its Registration Statement on Form S-3 on
file with the SEC (File No. 33-192302) to add its wholly
owned subsidiary, Citigroup Global Markets Holdings Inc.
(CGMHI), as a co-registrant. Any securities issued by CGMHI
under the Form S-3 will be fully and unconditionally
guaranteed by Citigroup.
The following are the Condensed Consolidating
Statements of Income and Comprehensive Income for the
years ended December 31, 2020, 2019 and 2018, Condensed
Consolidating Balance Sheet as of December 31, 2020 and
2019 and Condensed Consolidating Statement of Cash Flows
for the years ended December 31, 2020, 2019 and 2018 for
Citigroup Inc., the parent holding company (Citigroup parent
company), CGMHI, other Citigroup subsidiaries and
eliminations and total consolidating adjustments. “Other
Citigroup subsidiaries and eliminations” includes all other
subsidiaries of Citigroup, intercompany eliminations and
income (loss) from discontinued operations. “Consolidating
adjustments” includes Citigroup parent company elimination
of distributed and undistributed income of subsidiaries and
investment in subsidiaries.
These Condensed Consolidating Financial Statements
have been prepared and presented in accordance with SEC
Regulation S-X Rule 3-10, “Financial Statements of
Guarantors and Issuers of Guaranteed Securities Registered or
Being Registered.”
These Condensed Consolidating Financial Statements
schedules are presented for purposes of additional analysis,
but should be considered in relation to the Consolidated
Financial Statements of Citigroup taken as a whole.
300
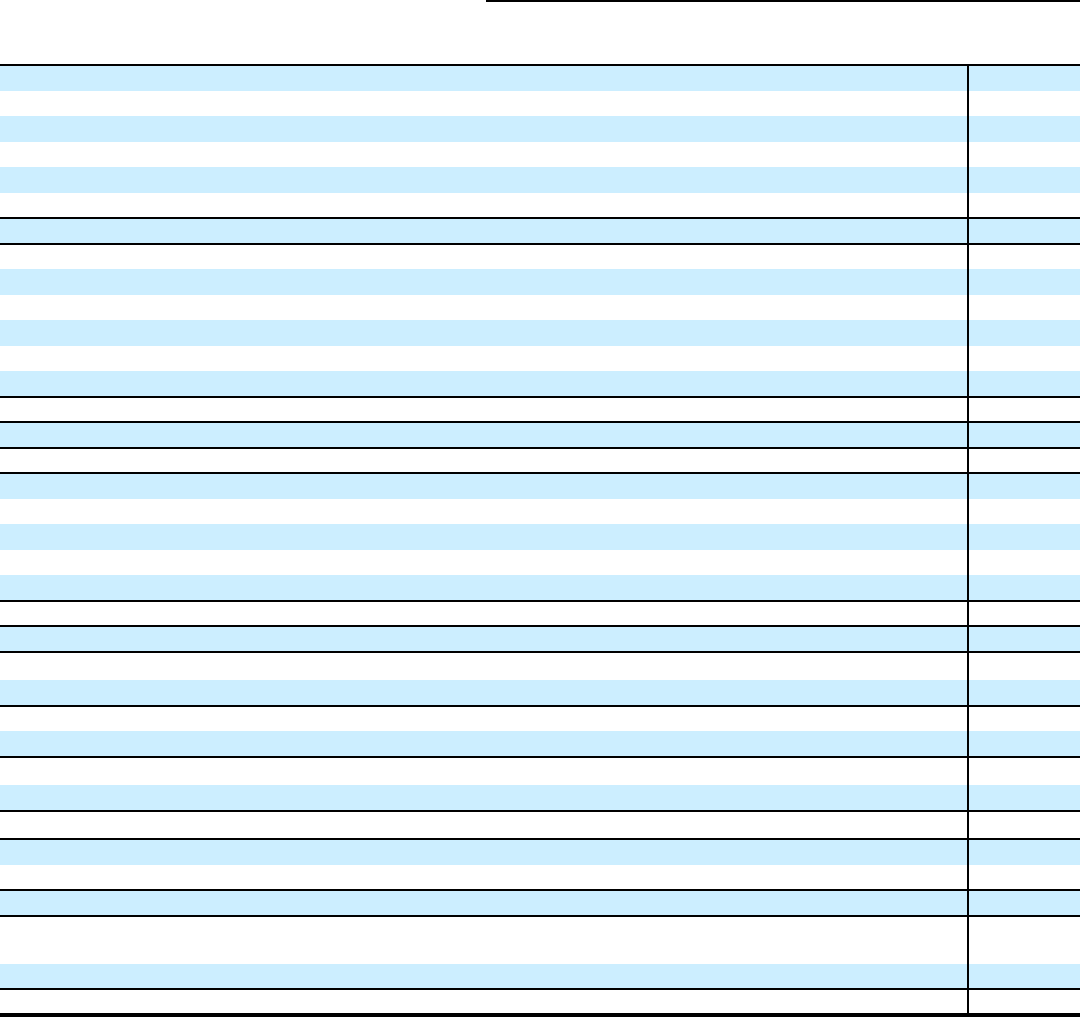
Condensed Consolidating Statements of Income and Comprehensive Income
Year ended December 31, 2020
In millions of dollars
Citigroup
parent
company CGMHI
Other Citigroup
subsidiaries and
eliminations
Consolidating
adjustments
Citigroup
consolidated
Revenues
Dividends from subsidiaries $ 2,355 $ — $ — $ (2,355) $ —
Interest revenue — 5,364 52,725 — 58,089
Interest revenue—intercompany 4,162 920 (5,082) — —
Interest expense 4,992 1,989 7,560 — 14,541
Interest expense—intercompany 502 2,170 (2,672) — —
Net interest revenue $ (1,332) $ 2,125 $ 42,755 $ — $ 43,548
Commissions and fees $ — $ 6,216 $ 5,169 $ — $ 11,385
Commissions and fees—intercompany (36) 290 (254) — —
Principal transactions (1,254) (4,252) 19,391 — 13,885
Principal transactions—intercompany 693 9,064 (9,757) — —
Other revenue (127) 706 4,901 — 5,480
Other revenue—intercompany 111 23 (134) — —
Total non-interest revenues $ (613) $ 12,047 $ 19,316 $ — $ 30,750
Total revenues, net of interest expense $ 410 $ 14,172 $ 62,071 $ (2,355) $ 74,298
Provisions for credit losses and for benefits and claims $ — $ (1) $ 17,496 $ — $ 17,495
Operating expenses
Compensation and benefits $ (5) $ 4,941 $ 17,278 $ — $ 22,214
Compensation and benefits—intercompany 191 — (191) — —
Other operating 37 2,393 18,527 — 20,957
Other operating—intercompany 15 2,317 (2,332) — —
Total operating expenses $ 238 $ 9,651 $ 33,282 $ — $ 43,171
Equity in undistributed income of subsidiaries $ 9,894 $ — $ — $ (9,894) $ —
Income from continuing operations before income taxes $ 10,066 $ 4,522 $ 11,293 $ (12,249) $ 13,632
Provision (benefit) for income taxes (981) 1,249 2,257 — 2,525
Income from continuing operations $ 11,047 $ 3,273 $ 9,036 $ (12,249) $ 11,107
Income (loss) from discontinued operations, net of taxes — — (20) — (20)
Net income before attribution of noncontrolling interests $ 11,047 $ 3,273 $ 9,016 $ (12,249) $ 11,087
Noncontrolling interests — — 40 — 40
Net income $ 11,047 $ 3,273 $ 8,976 $ (12,249) $ 11,047
Comprehensive income
Add: Other comprehensive income (loss) $ 4,260 $ (223) $ 4,244 $ (4,021) $ 4,260
Total Citigroup comprehensive income $ 15,307 $ 3,050 $ 13,220 $ (16,270) $ 15,307
Add: Other comprehensive income attributable to noncontrolling
interests $ — $ — $ 26 $ — $ 26
Add: Net income attributable to noncontrolling interests — — 40 — 40
Total comprehensive income $ 15,307 $ 3,050 $ 13,286 $ (16,270) $ 15,373
301
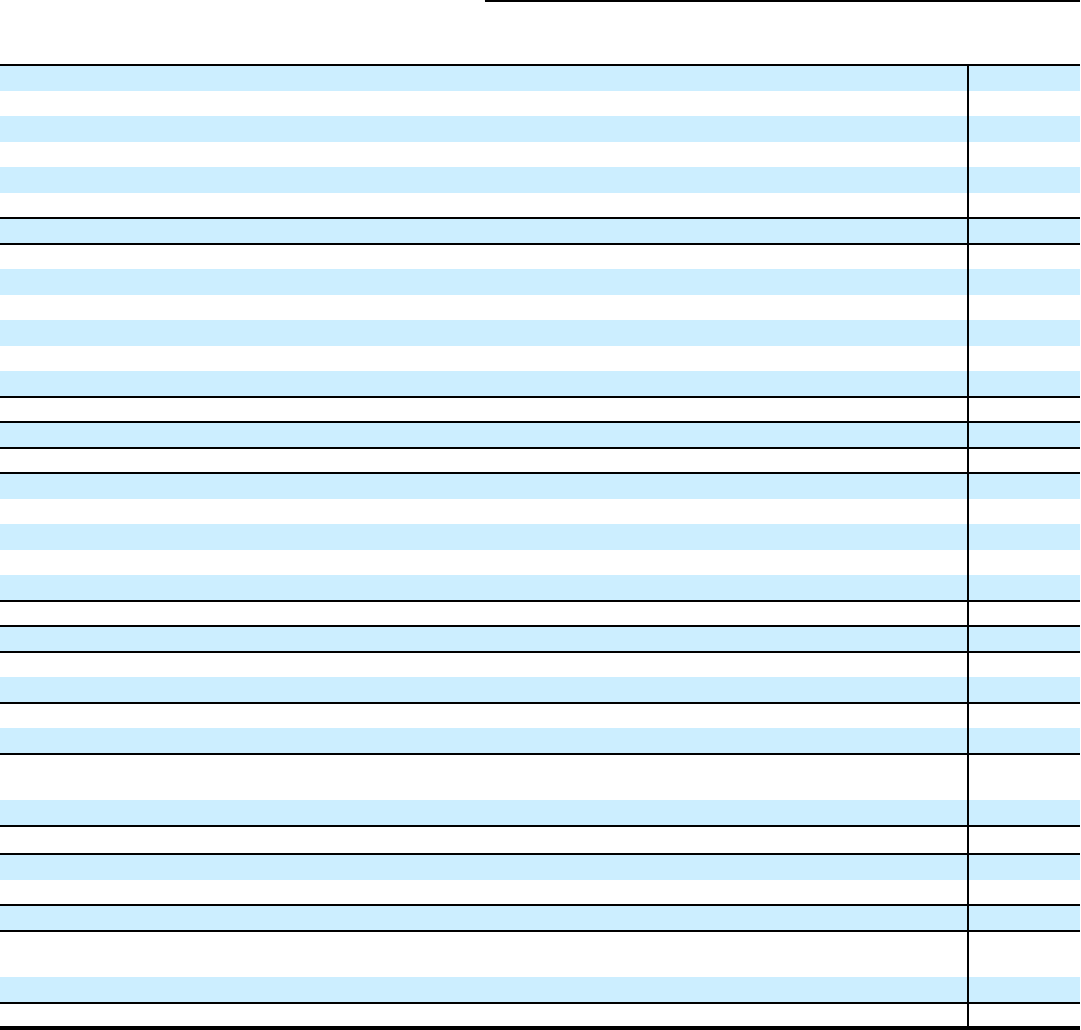
Condensed Consolidating Statements of Income and Comprehensive Income
Year ended December 31, 2019
In millions of dollars
Citigroup
parent
company CGMHI
Other Citigroup
subsidiaries and
eliminations
Consolidating
adjustments
Citigroup
consolidated
Revenues
Dividends from subsidiaries $ 23,347 $ — $ — $ (23,347) $ —
Interest revenue — 10,661 65,849 — 76,510
Interest revenue—intercompany 5,091 1,942 (7,033) — —
Interest expense 4,949 7,010 17,204 — 29,163
Interest expense—intercompany 1,038 4,243 (5,281) — —
Net interest revenue $ (896) $ 1,350 $ 46,893 $ — $ 47,347
Commissions and fees $ — $ 5,265 $ 6,481 $ — $ 11,746
Commissions and fees—intercompany (21) 354 (333) — —
Principal transactions (2,537) 277 11,152 — 8,892
Principal transactions—intercompany 1,252 2,464 (3,716) — —
Other revenue 767 832 4,702 — 6,301
Other revenue—intercompany (55) 102 (47) — —
Total non-interest revenues $ (594) $ 9,294 $ 18,239 $ — $ 26,939
Total revenues, net of interest expense $ 21,857 $ 10,644 $ 65,132 $ (23,347) $ 74,286
Provisions for credit losses and for benefits and claims $ — $ — $ 8,383 $ — $ 8,383
Operating expenses
Compensation and benefits $ 32 $ 4,680 $ 16,721 $ — $ 21,433
Compensation and benefits—intercompany 134 — (134) — —
Other operating (16) 2,326 18,259 — 20,569
Other operating—intercompany 20 2,410 (2,430) — —
Total operating expenses $ 170 $ 9,416 $ 32,416 $ — $ 42,002
Equity in undistributed income of subsidiaries $ (3,620) $ — $ — $ 3,620 $ —
Income from continuing operations before income taxes $ 18,067 $ 1,228 $ 24,333 $ (19,727) $ 23,901
Provision (benefit) for income taxes (1,334) 176 5,588 — 4,430
Income from continuing operations $ 19,401 $ 1,052 $ 18,745 $ (19,727) $ 19,471
Income (loss) from discontinued operations, net of taxes — — (4) — (4)
Net income (loss) before attribution of noncontrolling
interests $ 19,401 $ 1,052 $ 18,741 $ (19,727) $ 19,467
Noncontrolling interests — — 66 — 66
Net income $ 19,401 $ 1,052 $ 18,675 $ (19,727) $ 19,401
Comprehensive income
Add: Other comprehensive income (loss) $ 852 $ (651) $ 1,600 $ (949) $ 852
Total Citigroup comprehensive income $ 20,253 $ 401 $ 20,275 $ (20,676) $ 20,253
Add: Other comprehensive income attributable to noncontrolling
interests $ — $ — $ — $ — $ —
Add: Net income attributable to noncontrolling interests — — 66 — 66
Total comprehensive income $ 20,253 $ 401 $ 20,341 $ (20,676) $ 20,319
302
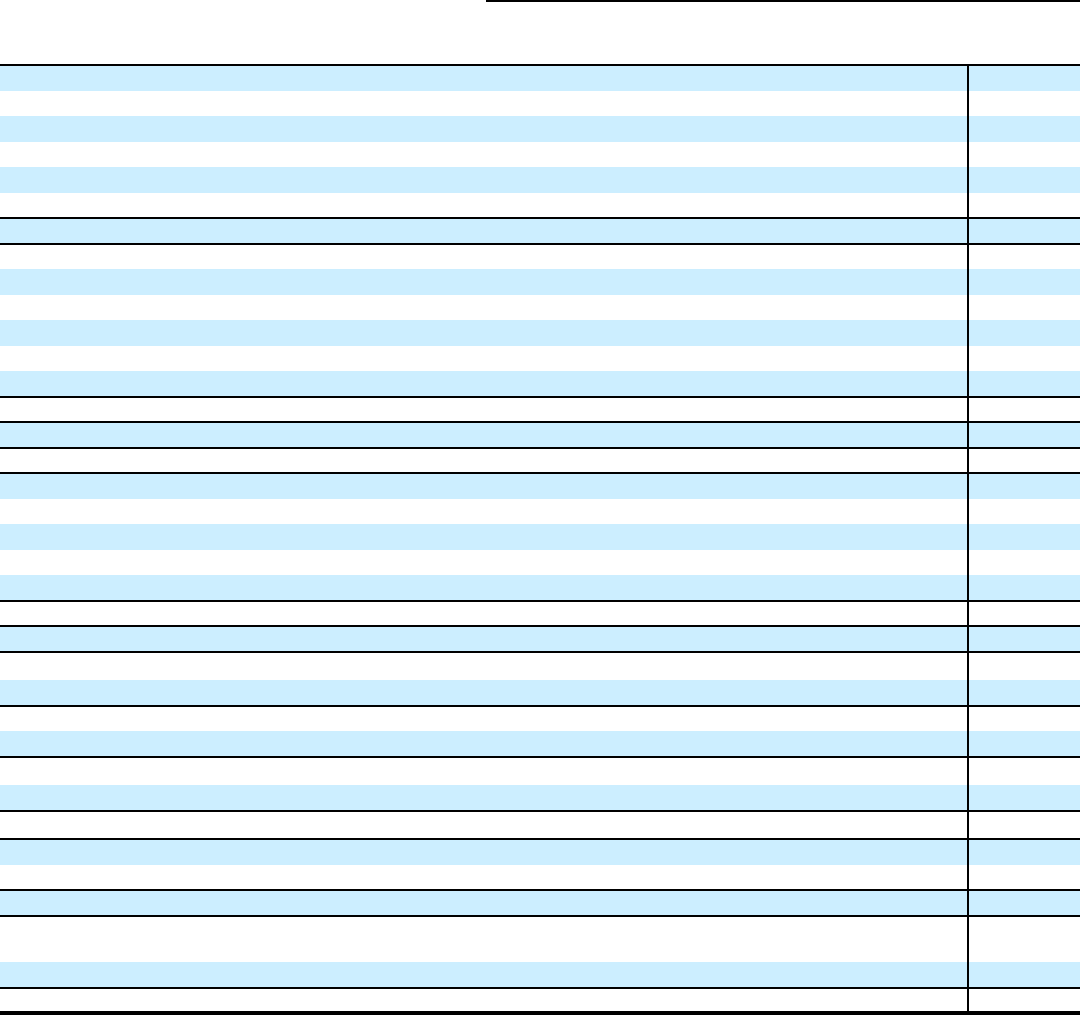
Condensed Consolidating Statements of Income and Comprehensive Income
Year ended December 31, 2018
In millions of dollars
Citigroup
parent
company CGMHI
Other Citigroup
subsidiaries and
eliminations
Consolidating
adjustments
Citigroup
consolidated
Revenues
Dividends from subsidiaries $ 22,854 $ — $ — $ (22,854) $ —
Interest revenue 67 8,732 62,029 — 70,828
Interest revenue—intercompany 4,933 1,659 (6,592) — —
Interest expense 4,783 5,430 14,053 — 24,266
Interest expense—intercompany 1,198 3,539 (4,737) — —
Net interest revenue $ (981) $ 1,422 $ 46,121 $ — $ 46,562
Commissions and fees $ — $ 5,146 $ 6,711 $ — $ 11,857
Commissions and fees—intercompany (2) 237 (235) — —
Principal transactions (1,310) 1,599 8,616 — 8,905
Principal transactions—intercompany (929) 1,328 (399) — —
Other revenue 1,373 710 3,447 — 5,530
Other revenue—intercompany (107) 143 (36) — —
Total non-interest revenues $ (975) $ 9,163 $ 18,104 $ — $ 26,292
Total revenues, net of interest expense $ 20,898 $ 10,585 $ 64,225 $ (22,854) $ 72,854
Provisions for credit losses and for benefits and claims $ — $ (22) $ 7,590 $ — $ 7,568
Operating expenses
Compensation and benefits $ 4 $ 4,484 $ 16,666 $ — $ 21,154
Compensation and benefits—intercompany 115 — (115) — —
Other operating (192) 2,224 18,655 — 20,687
Other operating—intercompany 49 2,312 (2,361) — —
Total operating expenses $ (24) $ 9,020 $ 32,845 $ — $ 41,841
Equity in undistributed income of subsidiaries $ (2,163) $ — $ — $ 2,163 $ —
Income from continuing operations before income taxes $ 18,759 $ 1,587 $ 23,790 $ (20,691) $ 23,445
Provision (benefit) for income taxes 714 1,123 3,520 — 5,357
Income from continuing operations $ 18,045 $ 464 $ 20,270 $ (20,691) $ 18,088
Income (loss) from discontinued operations, net of taxes — — (8) — (8)
Net income before attribution of noncontrolling interests $ 18,045 $ 464 $ 20,262 $ (20,691) $ 18,080
Noncontrolling interests — — 35 — 35
Net income $ 18,045 $ 464 $ 20,227 $ (20,691) $ 18,045
Comprehensive income
Add: Other comprehensive income (loss) $ (2,499) $ 257 $ 3,500 $ (3,757) $ (2,499)
Total Citigroup comprehensive income $ 15,546 $ 721 $ 23,727 $ (24,448) $ 15,546
Add: Other comprehensive income attributable to noncontrolling
interests $ — $ — $ (43) $ — $ (43)
Add: Net income attributable to noncontrolling interests — — 35 — 35
Total comprehensive income $ 15,546 $ 721 $ 23,719 $ (24,448) $ 15,538
303
Condensed Consolidating Balance Sheet
December 31, 2020
In millions of dollars
Citigroup
parent
company CGMHI
Other
Citigroup
subsidiaries
and
eliminations
Consolidating
adjustments
Citigroup
consolidated
Assets
Cash and due from banks $ — $ 628 $ 25,721 $ — $ 26,349
Cash and due from banks—intercompany 16 6,081 (6,097) — —
Deposits with banks, net of allowance — 5,224 278,042 — 283,266
Deposits with banks—intercompany 4,500 8,179 (12,679) — —
Securities borrowed and purchased under resale agreements — 238,718 55,994 — 294,712
Securities borrowed and purchased under resale agreements—
intercompany — 24,309 (24,309) — —
Trading account assets 307 222,278 152,494 — 375,079
Trading account assets—intercompany 723 9,400 (10,123) — —
Investments, net of allowance 1 374 446,984 — 447,359
Loans, net of unearned income — 2,524 673,359 — 675,883
Loans, net of unearned income—intercompany — — — — —
Allowance for credit losses on loans (ACLL) — — (24,956) — (24,956)
Total loans, net $ — $ 2,524 $ 648,403 $ — $ 650,927
Advances to subsidiaries $ 152,383 $ — $ (152,383) $ — $ —
Investments in subsidiaries 213,267 — — (213,267) —
Other assets, net of allowance
(1)
12,156 60,273 109,969 — 182,398
Other assets—intercompany 2,781 51,489 (54,270) — —
Total assets $ 386,134 $ 629,477 $ 1,457,746 $ (213,267) $ 2,260,090
Liabilities and equity
Deposits $ — $ — $ 1,280,671 $ — $ 1,280,671
Deposits—intercompany — — — — —
Securities loaned and sold under repurchase agreements — 184,786 14,739 — 199,525
Securities loaned and sold under repurchase agreements—
intercompany — 76,590 (76,590) — —
Trading account liabilities — 113,100 54,927 — 168,027
Trading account liabilities—intercompany 397 8,591 (8,988) — —
Short-term borrowings — 12,323 17,191 — 29,514
Short-term borrowings—intercompany — 12,757 (12,757) — —
Long-term debt 170,563 47,732 53,391 — 271,686
Long-term debt—intercompany — 67,322 (67,322) — —
Advances from subsidiaries 12,975 — (12,975) — —
Other liabilities, including allowance 2,692 55,217 52,558 — 110,467
Other liabilities—intercompany 65 15,378 (15,443) — —
Stockholders’ equity 199,442 35,681 178,344 (213,267) 200,200
Total liabilities and equity $ 386,134 $ 629,477 $ 1,457,746 $ (213,267) $ 2,260,090
(1) Other assets for Citigroup parent company at December 31, 2020 included $29.5 billion of placements to Citibank and its branches, of which $24.3 billion had a
remaining term of less than 30 days.
304
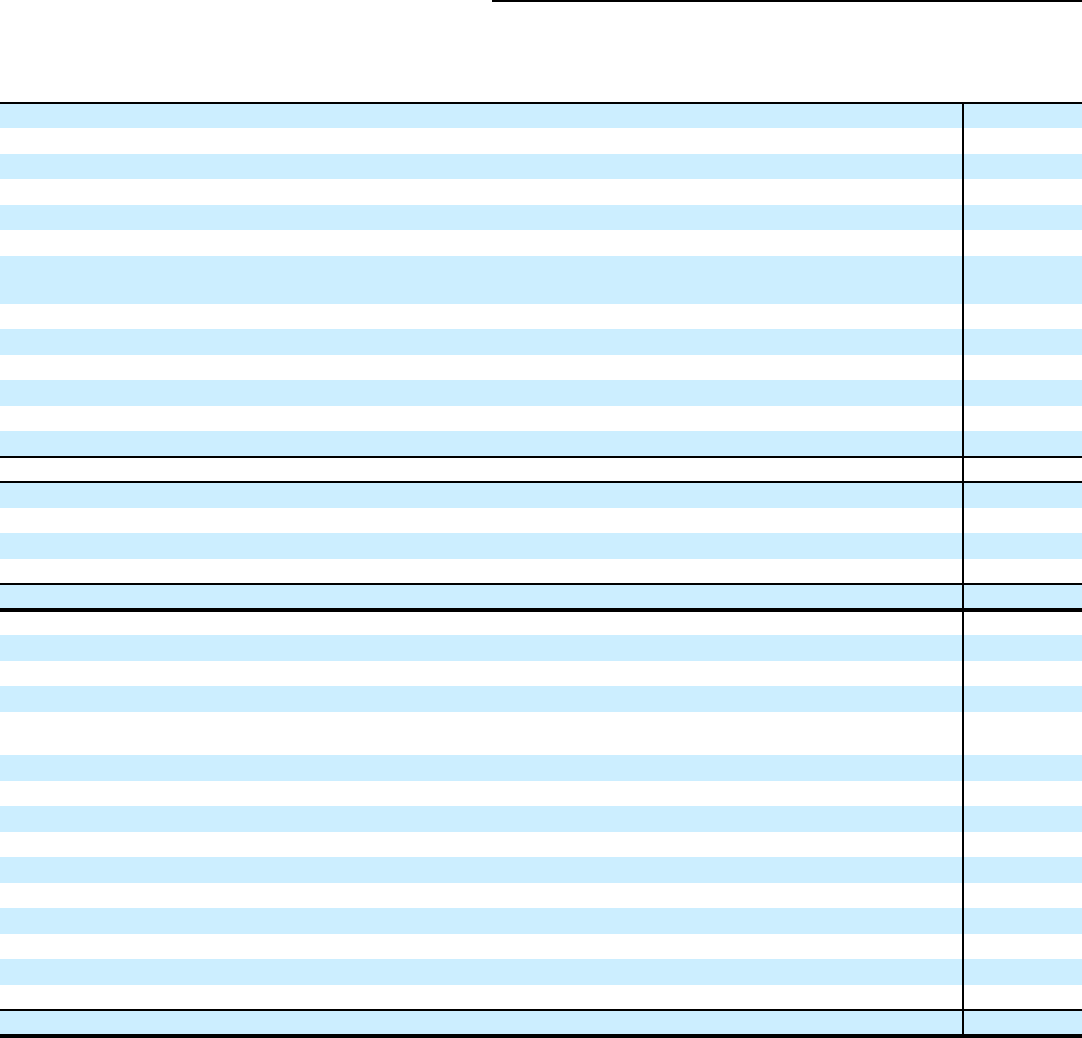
Condensed Consolidating Balance Sheet
December 31, 2019
In millions of dollars
Citigroup
parent
company CGMHI
Other
Citigroup
subsidiaries
and
eliminations
Consolidating
adjustments
Citigroup
consolidated
Assets
Cash and due from banks $ — $ 586 $ 23,381 $ — $ 23,967
Cash and due from banks—intercompany 21 5,095 (5,116) — —
Deposits with banks, net of allowance — 4,050 165,902 — 169,952
Deposits with banks—intercompany 3,000 6,710 (9,710) — —
Securities borrowed and purchased under resale agreements — 195,537 55,785 — 251,322
Securities borrowed and purchased under resale agreements—
intercompany — 21,446 (21,446) — —
Trading account assets 286 152,115 123,739 — 276,140
Trading account assets—intercompany 426 5,858 (6,284) — —
Investments, net of allowance 1 541 368,021 — 368,563
Loans, net of unearned income — 2,497 696,986 — 699,483
Loans, net of unearned income—intercompany — — — — —
Allowance for credit losses on loans (ACLL) — — (12,783) — (12,783)
Total loans, net $ — $ 2,497 $ 684,203 $ — $ 686,700
Advances to subsidiaries $ 144,587 $ — $ (144,587) $ — $ —
Investments in subsidiaries 202,116 — — (202,116) —
Other assets, net of allowance
(1)
12,377 54,784 107,353 — 174,514
Other assets—intercompany 2,799 45,588 (48,387) — —
Total assets $ 365,613 $ 494,807 $ 1,292,854 $ (202,116) $ 1,951,158
Liabilities and equity
Deposits $ — $ — $ 1,070,590 $ — $ 1,070,590
Deposits—intercompany — — — — —
Securities loaned and sold under repurchase agreements — 145,473 20,866 — 166,339
Securities loaned and sold under repurchase agreements—
intercompany — 36,581 (36,581) — —
Trading account liabilities 1 80,100 39,793 — 119,894
Trading account liabilities—intercompany 379 5,109 (5,488) — —
Short-term borrowings 66 11,096 33,887 — 45,049
Short-term borrowings—intercompany — 17,129 (17,129) — —
Long-term debt 150,477 39,578 58,705 — 248,760
Long-term debt—intercompany — 66,791 (66,791) — —
Advances from subsidiaries 20,503 — (20,503) — —
Other liabilities, including allowance 937 51,777 53,866 — 106,580
Other liabilities—intercompany 8 8,414 (8,422) — —
Stockholders’ equity 193,242 32,759 170,061 (202,116) 193,946
Total liabilities and equity $ 365,613 $ 494,807 $ 1,292,854 $ (202,116) $ 1,951,158
(1) Other assets for Citigroup parent company at December 31, 2019 included $35.1 billion of placements to Citibank and its branches, of which $24.9 billion had a
remaining term of less than 30 days.
305

Condensed Consolidating Statement of Cash Flows
Year ended December 31, 2020
In millions of dollars
Citigroup
parent
company CGMHI
Other
Citigroup
subsidiaries
and
eliminations
Consolidating
adjustments
Citigroup
consolidated
Net cash provided by (used in) operating activities of
continuing operations $ 5,002 $ (26,195) $ 572 $ — $ (20,621)
Cash flows from investing activities of continuing operations
Purchases of investments $ — $ — $ (334,900) $ — $ (334,900)
Proceeds from sales of investments — — 146,285 — 146,285
Proceeds from maturities of investments — — 124,229 — 124,229
Change in loans — — 14,249 — 14,249
Proceeds from sales and securitizations of loans — — 1,495 — 1,495
Change in securities borrowed and purchased under agreements
to resell — (46,044) 2,654 — (43,390)
Changes in investments and advances—intercompany (5,584) (6,917) 12,501 — —
Other investing activities — (54) (3,226) — (3,280)
Net cash used in investing activities of continuing operations $ (5,584) $ (53,015) $ (36,713) $ — $ (95,312)
Cash flows from financing activities of continuing operations
Dividends paid $ (5,352) $ (172) $ 172 $ — $ (5,352)
Issuance of preferred stock 2,995 — — — 2,995
Redemption of preferred stock (1,500) — — — (1,500)
Treasury stock acquired (2,925) — — — (2,925)
Proceeds (repayments) from issuance of long-term debt, net 16,798 6,349 (10,091) — 13,056
Proceeds (repayments) from issuance of long-term debt—
intercompany, net — 3,960 (3,960) — —
Change in deposits — — 210,081 — 210,081
Change in securities loaned and sold under agreements to
repurchase — 79,322 (46,136) — 33,186
Change in short-term borrowings — 1,228 (16,763) — (15,535)
Net change in short-term borrowings and other advances—
intercompany (7,528) (7,806) 15,334 — —
Capital contributions from (to) parent — — — — —
Other financing activities (411) — — — (411)
Net cash provided by financing activities of continuing
operations $ 2,077 $ 82,881 $ 148,637 $ — $ 233,595
Effect of exchange rate changes on cash and due from banks $ — $ — $ (1,966) $ — $ (1,966)
Change in cash and due from banks and deposits with banks $ 1,495 $ 3,671 $ 110,530 $ — $ 115,696
Cash and due from banks and deposits with banks at
beginning of year 3,021 16,441 174,457 — 193,919
Cash and due from banks and deposits with banks at end of
year $ 4,516 $ 20,112 $ 284,987 $ — $ 309,615
Cash and due from banks $ 16 $ 6,709 $ 19,624 $ — $ 26,349
Deposits with banks, net of allowance 4,500 13,403 265,363 — 283,266
Cash and due from banks and deposits with banks at end of
year $ 4,516 $ 20,112 $ 284,987 $ — $ 309,615
Supplemental disclosure of cash flow information for
continuing operations
Cash paid during the year for income taxes $ (1,883) $ 1,138 $ 5,542 $ — $ 4,797
Cash paid during the year for interest 2,681 4,516 6,101 — 13,298
Non-cash investing activities
Transfers to loans HFS from loans $ — $ — $ 2,614 $ — $ 2,614
306

Condensed Consolidating Statement of Cash Flows
Year ended December 31, 2019
In millions of dollars
Citigroup
parent
company CGMHI
Other
Citigroup
subsidiaries
and
eliminations
Consolidating
adjustments
Citigroup
consolidated
Net cash provided by (used in) operating activities of
continuing operations $ 25,011 $ (35,396) $ (2,452) $ — $ (12,837)
Cash flows from investing activities of continuing operations
Purchases of investments $ — $ —
$ (274,491)
$ — $ (274,491)
Proceeds from sales of investments 5 — 137,168 — 137,173
Proceeds from maturities of investments — — 119,051 — 119,051
Change in loans — — (22,466) — (22,466)
Proceeds from sales and securitizations of loans — — 2,878 — 2,878
Change in securities borrowed and purchased under agreements to
resell — 15,811 3,551 — 19,362
Changes in investments and advances—intercompany (1,847) (870) 2,717 — —
Other investing activities — (64) (4,817) — (4,881)
Net cash provided by (used in) investing activities of
continuing operations $ (1,842) $ 14,877 $ (36,409) $ — $ (23,374)
Cash flows from financing activities of continuing operations
Dividends paid $ (5,447) $ — $ — $ — $ (5,447)
Issuance of preferred stock 1,496 — — — 1,496
Redemption of preferred stock (1,980) — — — (1,980)
Treasury stock acquired (17,571) — — — (17,571)
Proceeds from issuance of long-term debt, net 1,666 10,389 (3,950) — 8,105
Proceeds (repayments) from issuance of long-term debt—
intercompany, net — (7,177) 7,177 — —
Change in deposits — — 57,420 — 57,420
Change in securities loaned and sold under agreements to
repurchase — 5,115 (16,544) — (11,429)
Change in short-term borrowings — 7,440 5,263 — 12,703
Net change in short-term borrowings and other advances—
intercompany (968) 5,843 (4,875) — —
Capital contributions from (to) parent — (74) 74 — —
Other financing activities (364) (253) 253 — (364)
Net cash provided by (used in) financing activities of
continuing operations $ (23,168) $ 21,283 $ 44,818 $ — $ 42,933
Effect of exchange rate changes on cash and due from banks $ — $ — $ (908) $ — $ (908)
Change in cash and due from banks and deposits with banks $ 1 $ 764 $ 5,049 $ — $ 5,814
Cash and due from banks and deposits with banks at
beginning of year 3,020 15,677 169,408 — 188,105
Cash and due from banks and deposits with banks at end of
year $ 3,021 $ 16,441 $ 174,457 $ — $ 193,919
Cash and due from banks $ 21 $ 5,681 $ 18,265 $ — $ 23,967
Deposits with banks, net of allowance 3,000 10,760 156,192 — 169,952
Cash and due from banks and deposits with banks at end of
year $ 3,021 $ 16,441 $ 174,457 $ — $ 193,919
Supplemental disclosure of cash flow information for
continuing operations
Cash paid (received) during the year for income taxes $ (393) $ 418 $ 4,863 $ — $ 4,888
Cash paid during the year for interest 3,820 12,664 12,198 — 28,682
Non-cash investing activities
Transfers to loans HFS from loans $ — $ — $ 5,500 $ — $ 5,500
307
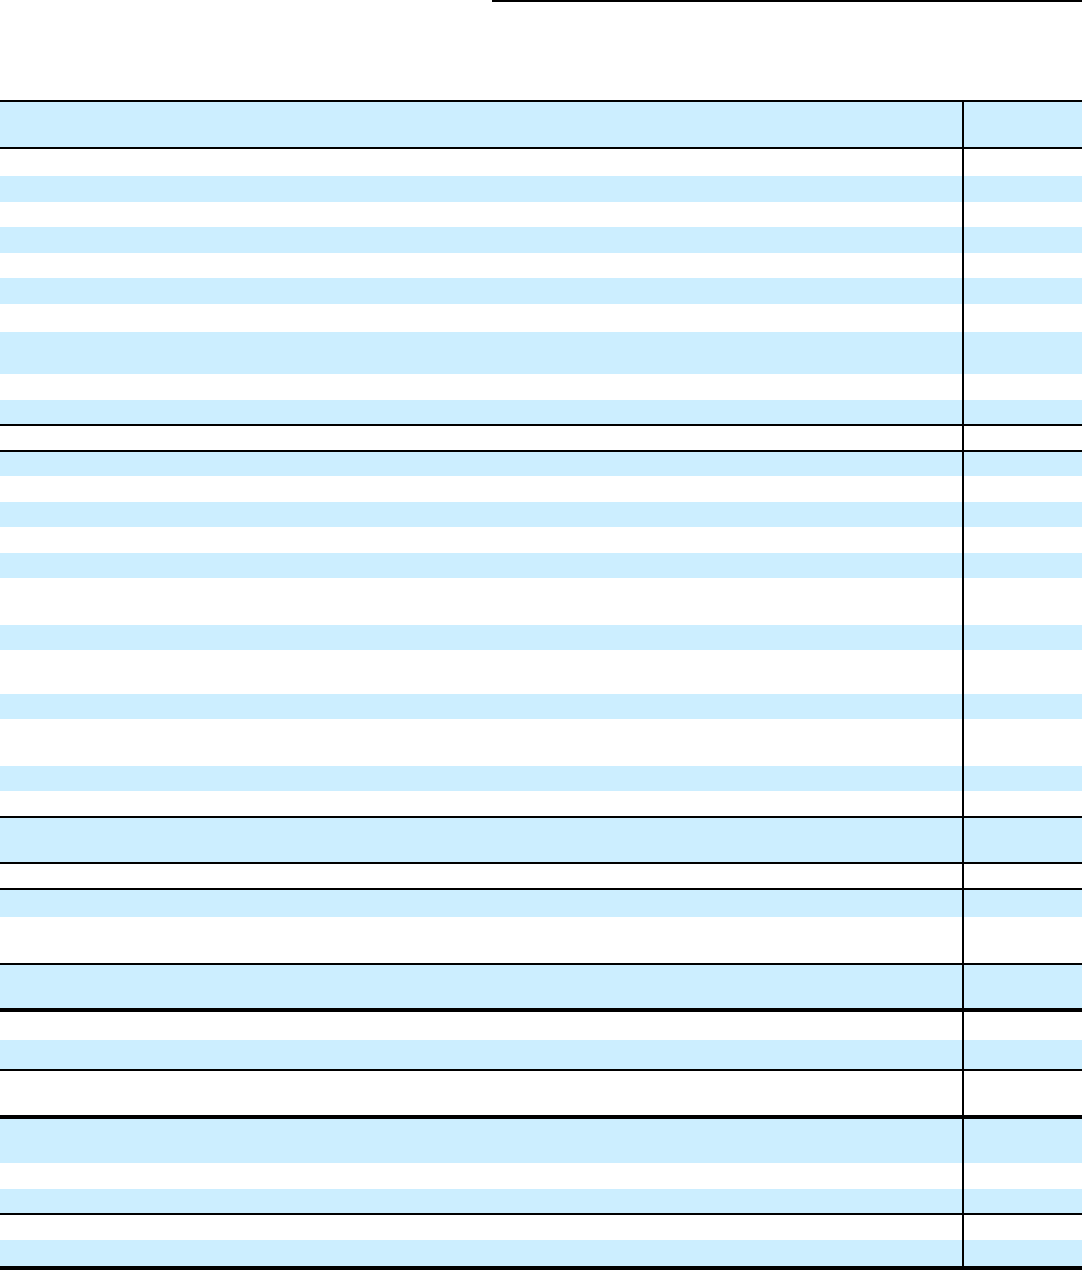
Condensed Consolidating Statements of Cash Flows
Year ended December 31, 2018
In millions of dollars
Citigroup
parent
company CGMHI
Other
Citigroup
subsidiaries
and
eliminations
Consolidating
adjustments
Citigroup
consolidated
Net cash provided by operating activities of continuing
operations $ 21,314 $ 13,287 $ 2,351 $ — $ 36,952
Cash flows from investing activities of continuing operations
Purchases of investments $ (7,955) $ (18) $ (144,514) $ — $ (152,487)
Proceeds from sales of investments 7,634 3 53,854 — 61,491
Proceeds from maturities of investments — — 83,604 — 83,604
Change in loans — — (29,002) — (29,002)
Proceeds from sales and securitizations of loans — — 4,549 — 4,549
Proceeds from significant disposals — — 314 — 314
Change in securities borrowed and purchased under agreements to
resell — (34,018) (4,188) — (38,206)
Changes in investments and advances—intercompany (5,566) (832) 6,398 — —
Other investing activities 556 (59) (3,878) — (3,381)
Net cash used in investing activities of continuing operations $ (5,331) $ (34,924) $ (32,863) $ — $ (73,118)
Cash flows from financing activities of continuing operations
Dividends paid $ (5,020) $ — $ — $ — $ (5,020)
Redemption of preferred stock (793) — — — (793)
Treasury stock acquired (14,433) — — — (14,433)
Proceeds (repayments) from issuance of long-term debt, net (5,099) 10,278 (2,656) — 2,523
Proceeds (repayments) from issuance of long-term debt—
intercompany, net — 10,708 (10,708) — —
Change in deposits — — 53,348 — 53,348
Change in securities loaned and sold under agreements to
repurchase — 23,454 (1,963) — 21,491
Change in short-term borrowings 32 88 (12,226) — (12,106)
Net change in short-term borrowings and other advances—
intercompany 1,819 (19,111) 17,292 — —
Capital contributions from (to) parent — (798) 798 — —
Other financing activities (482) — — — (482)
Net cash provided by (used in) financing activities of
continuing operations $ (23,976) $ 24,619 $ 43,885 $ — $ 44,528
Effect of exchange rate changes on cash and due from banks $ — $ — $ (773) $ — $ (773)
Change in cash and due from banks and deposits with banks $ (7,993) $ 2,982 $ 12,600 $ — $ 7,589
Cash and due from banks and deposits with banks at
beginning of year 11,013 12,695 156,808 — 180,516
Cash and due from banks and deposits with banks at end of
year $ 3,020 $ 15,677 $ 169,408 $ — $ 188,105
Cash and due from banks $ 20 $ 4,234 $ 19,391 $ — $ 23,645
Deposits with banks, net of allowance 3,000 11,443 150,017 — 164,460
Cash and due from banks and deposits with banks at end of
year $ 3,020 $ 15,677 $ 169,408 $ — $ 188,105
Supplemental disclosure of cash flow information for
continuing operations
Cash paid during the year for income taxes $ (783) $ 458 $ 4,638 $ — $ 4,313
Cash paid during the year for interest 3,854 8,671 10,438 — 22,963
Non-cash investing activities
Transfers to loans HFS from loans $ — $ — $ 4,200 $ — $ 4,200
308
29. SUBSEQUENT EVENT
As a result of new information Citi received subsequent to
December 31, 2020, Citi adjusted downward its 2020
financial results (recognized in the fourth quarter of 2020)
from those previously reported on January 15, 2021, due to a
$390 million increase in operating expenses ($323 million
after-tax) recorded within ICG, resulting from operational
losses related to certain legal matters. Citi’s results of
operations and financial condition for the full year 2020, as
reported in this Annual Report on Form 10‑K for the year
ended December 31, 2020, reflect the impact of this
adjustment.
309
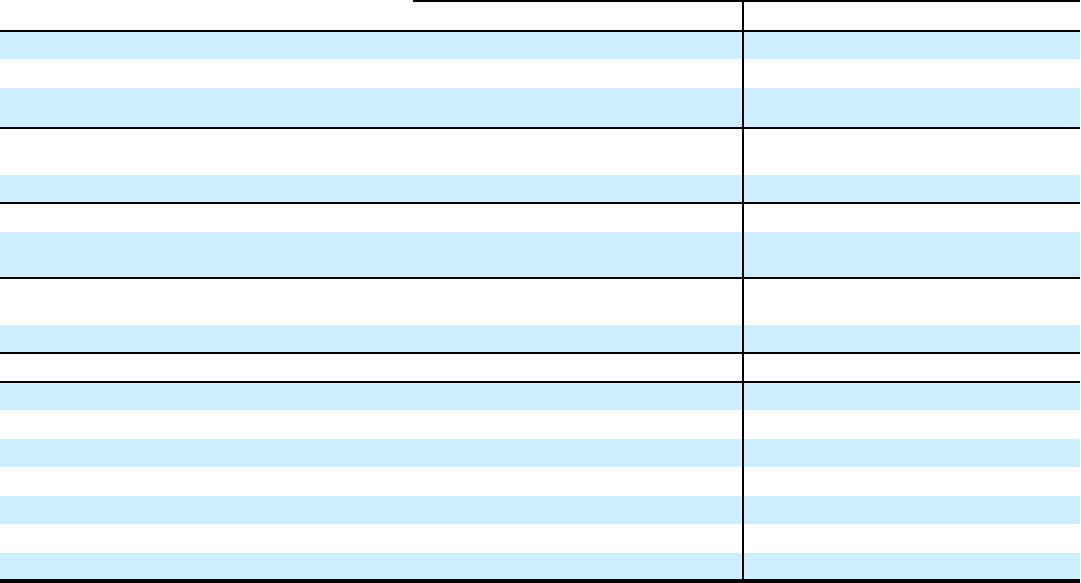
30. SELECTED QUARTERLY FINANCIAL DATA (UNAUDITED)
2020 2019
In millions of dollars, except per share amounts
Fourth
(1)
Third
(2)
Second
(2)
First
(2)
Fourth Third Second First
Revenues, net of interest expense $ 16,499 $ 17,302 $ 19,766 $ 20,731 $ 18,378 $ 18,574 $ 18,758 $ 18,576
Operating expenses 11,104 10,964 10,460 10,643 10,454 10,464 10,500 10,584
Provisions (release) for credit losses and for benefits
and claims (46) 2,384 8,197 6,960 2,222 2,088 2,093 1,980
Income from continuing operations before income
taxes $ 5,441 $ 3,954 $ 1,109 $ 3,128 $ 5,702 $ 6,022 $ 6,165 $ 6,012
Income taxes
(3)
1,116 777 52 580 703 1,079 1,373 1,275
Income from continuing operations $ 4,325 $ 3,177 $ 1,057 $ 2,548 $ 4,999 $ 4,943 $ 4,792 $ 4,737
Income (loss) from discontinued operations, net of
taxes 6 (7) (1) (18) (4) (15) 17 (2)
Net income before attribution of noncontrolling
interests $ 4,331 $ 3,170 $ 1,056 $ 2,530 $ 4,995 $ 4,928 $ 4,809 $ 4,735
Noncontrolling interests 22 24 — (6) 16 15 10 25
Citigroup’s net income $ 4,309 $ 3,146 $ 1,056 $ 2,536 $ 4,979 $ 4,913 $ 4,799 $ 4,710
Earnings per share
(4)
Basic
Income from continuing operations $ 1.93 $ 1.37 $ 0.38 $ 1.07 $ 2.16 $ 2.09 $ 1.94 $ 1.88
Net income 1.93 1.37 0.38 1.06 2.16 2.09 1.95 1.88
Diluted
Income from continuing operations 1.92 1.36 0.38 1.06 2.15 2.08 1.94 1.87
Net income 1.92 1.36 0.38 1.06 2.15 2.07 1.95 1.87
This Note to the Consolidated Financial Statements is unaudited due to the Company’s individual quarterly results not being subject to an audit.
(1) As a result of new information Citi received subsequent to December 31, 2020, Citi adjusted downward its fourth quarter of 2020 financial results from those
previously reported on January 15, 2021, due to a $390 million increase in operating expenses ($323 million after‑tax) recorded within ICG, resulting from
operational losses related to certain legal matters. The downward adjustment lowered Citigroup’s fourth quarter net income from $4.6 billion to $4.3 billion and
earnings per diluted share from $2.08 to $1.92.
(2) In the fourth quarter of 2020, Citi revised the second quarter accounting conclusion for its variable post-charge-off third-party collection costs from a “change in
accounting estimate effected by a change in accounting principle” to a “change in accounting principle,” which requires an adjustment to January 1, 2020 opening
retained earnings, rather than net income. As a result, Citi’s full-year and quarterly results for 2020 have been revised to reflect this change as if it were effective
as of January 1, 2020. Citi recorded an increase to its beginning retained earnings on January 1, 2020 of $330 million and a decrease of $443 million in its
allowance for credit losses on loans, as well as a $113 million increase in other assets related to income taxes, and recorded a decrease of $18 million to its
provisions for credit losses on loans in the first quarter and increases of $339 million and $122 million to its provisions for credit losses on loans in the second and
third quarters, respectively. In addition, Citi’s operating expenses increased by $49 million and $45 million with a corresponding decrease in net credit losses, in
the first and second quarters, respectively. See Note 1 to the Consolidated Financial Statements for additional information.
(3) The fourth quarter of 2019 includes discrete tax items of roughly $540 million including an approximate $430 million benefit of a reduction in Citi’s valuation
allowance related to its DTAs. The third quarter of 2019 includes discrete tax items of roughly $230 million, including an approximate $180 million benefit of a
reduction in Citi’s valuation allowance related to its DTAs.
(4) Certain securities were excluded from the second quarter of 2020 diluted EPS calculation because they were anti-dilutive. Year-to-date EPS will not equal the sum
of the individual quarters because the year-to-date EPS calculation is a separate calculation. In addition, due to averaging of shares, quarterly earnings per share
may not sum to the totals reported for the full year.
End of Consolidated Financial Statements and Notes to Consolidated Financial Statements
310
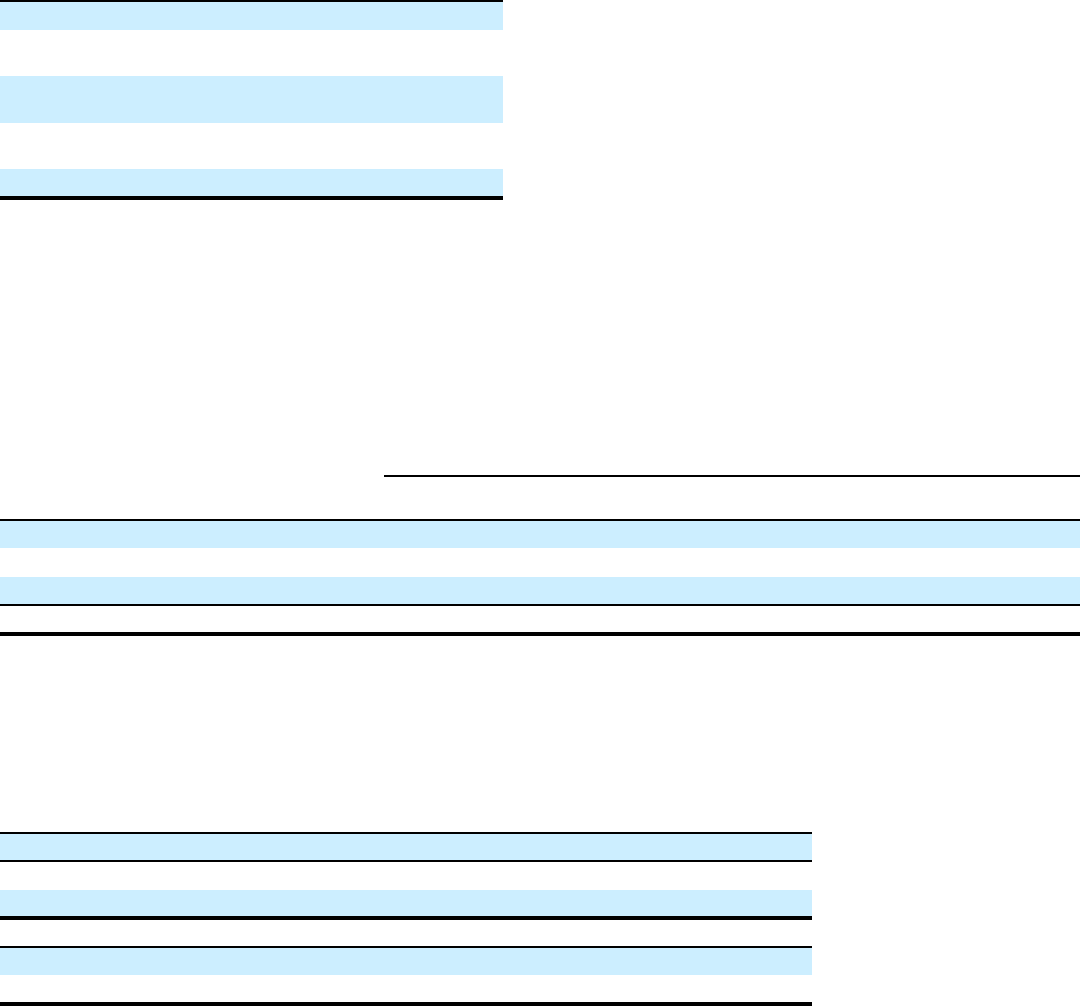
FINANCIAL DATA SUPPLEMENT
RATIOS
2020 2019 2018
Return on average assets 0.50 % 0.98 % 0.94 %
Return on average common
stockholders’ equity
(1)
5.7 10.3 9.4
Return on average total
stockholders’ equity
(2)
5.7 9.9 9.1
Total average equity to average
assets
(3)
8.7 9.9 10.3
Dividend payout ratio
(4)
43 24 23
(1) Based on Citigroup’s net income less preferred stock dividends as a
percentage of average common stockholders’ equity.
(2) Based on Citigroup’s net income as a percentage of average total
Citigroup stockholders’ equity.
(3) Based on average Citigroup stockholders’ equity as a percentage of
average assets.
(4) Dividends declared per common share as a percentage of net income per
diluted share.
AVERAGE DEPOSIT LIABILITIES IN OFFICES OUTSIDE THE U.S.
(1)
2020 2019 2018
In millions of dollars at year end, except ratios
Average
interest rate
Average
balance
Average
interest rate
Average
balance
Average
interest rate
Average
balance
Banks 0.10 % $ 130,970 0.59 % $ 52,699 1.35 % $ 44,426
Other demand deposits 0.33 311,342 1.08 293,209 0.61 287,665
Other time and savings deposits
(2)
0.94 210,896 1.28 223,450 1.31 209,410
Total 0.48 % $ 653,208 1.11 % $ 569,358 0.94 % $ 541,501
(1) Interest rates and amounts include the effects of risk management activities and also reflect the impact of the local interest rates prevailing in certain countries.
(2) Primarily consists of certificates of deposit and other time deposits in denominations of $100,000 or more.
MATURITY PROFILE OF TIME DEPOSITS IN U.S. OFFICES
In millions of dollars at December 31, 2020
Under 3
months
Over 3 to 6
months
Over 6 to 12
months
Over 12
months
Over $100,000
Certificates of deposit $ 8,257 $ 7,478 $ 2,535 $ 501
Other time deposits 4,531 13 21 708
Over $250,000
Certificates of deposit $ 6,434 $ 4,855 $ 1,367 $ 298
Other time deposits 4,499 — — 39
311
SUPERVISION, REGULATION AND OTHER
SUPERVISION AND REGULATION
Citi is subject to regulation under U.S. federal and state laws,
as well as applicable laws in the other jurisdictions in which it
does business.
General
Citigroup is a registered bank holding company and financial
holding company and is regulated and supervised by the
Federal Reserve Board. Citigroup’s nationally chartered
subsidiary banks, including Citibank, are regulated and
supervised by the Office of the Comptroller of the Currency
(OCC). The Federal Deposit Insurance Corporation (FDIC)
also has examination authority for banking subsidiaries whose
deposits it insures. Overseas branches of Citibank are
regulated and supervised by the Federal Reserve Board and
OCC and overseas subsidiary banks by the Federal Reserve
Board. These overseas branches and subsidiary banks are also
regulated and supervised by regulatory authorities in the host
countries. In addition, the Consumer Financial Protection
Bureau (CFPB) regulates consumer financial products and
services. Citi is also subject to laws and regulations
concerning the collection, use, sharing and disposition of
certain customer, employee and other personal and
confidential information, including those imposed by the
Gramm-Leach-Bliley Act, the Fair Credit Reporting Act and
the EU General Data Protection Regulation. For more
information on U.S. and foreign regulation affecting or
potentially affecting Citi, see “Managing Global Risk—
Capital Resources” and “–Liquidity Risk” and “Risk Factors”
above.
Other Bank and Bank Holding Company Regulation
Citi, including its banking subsidiaries, is subject to regulatory
limitations, including requirements for banks to maintain
reserves against deposits, requirements as to liquidity, risk-
based capital and leverage (see “Capital Resources” above and
Note 18 to the Consolidated Financial Statements), restrictions
on the types and amounts of loans that may be made and the
interest that may be charged, and limitations on investments
that can be made and services that can be offered. The Federal
Reserve Board may also expect Citi to commit resources to its
subsidiary banks in certain circumstances. Citi is also subject
to anti-money laundering and financial transparency laws,
including standards for verifying client identification at
account opening and obligations to monitor client transactions
and report suspicious activities.
Securities and Commodities Regulation
Citi conducts securities underwriting, brokerage and dealing
activities in the U.S. through Citigroup Global Markets Inc.
(CGMI), its primary broker-dealer, and other broker-dealer
subsidiaries, which are subject to regulations of the U.S.
Securities and Exchange Commission (SEC), the Financial
Industry Regulatory Authority and certain exchanges. Citi
conducts similar securities activities outside the U.S., subject
to local requirements, through various subsidiaries and
affiliates, principally Citigroup Global Markets Limited in
London (CGML), which is regulated principally by the U.K.
Financial Conduct Authority (FCA), and Citigroup Global
Markets Japan Inc. in Tokyo, which is regulated principally by
the Financial Services Agency of Japan.
Citi also has subsidiaries that are members of futures
exchanges and derivatives clearinghouses. In the U.S., CGMI
is a member of the principal U.S. futures exchanges and
clearinghouses, and Citi has subsidiaries that are registered as
futures commission merchants and commodity pool operators
with the Commodity Futures Trading Commission (CFTC).
Citibank, CGMI, Citigroup Energy Inc., Citigroup Global
Markets Europe AG and CGML are also registered as swap
dealers with the CFTC, and other Citi subsidiaries are
registered with the CFTC as commodity pool operators. CGMI
is also subject to SEC and CFTC rules that specify uniform
minimum net capital requirements. Compliance with these
rules could limit those operations of CGMI that require the
intensive use of capital and also limits the ability of broker-
dealers to transfer large amounts of capital to parent
companies and other affiliates. See “Capital Resources” and
Note 18 to the Consolidated Financial Statements for a further
discussion of capital considerations of Citi’s non-banking
subsidiaries.
Transactions with Affiliates
Transactions between Citi’s U.S. subsidiary depository
institutions and their non-bank affiliates are regulated by the
Federal Reserve Board, and are generally required to be on
arm’s-length terms. See “Managing Global Risk—Liquidity
Risk” above.
COMPETITION
The financial services industry is highly competitive. Citi’s
competitors include a variety of financial services and
advisory companies. Citi competes for clients and capital
(including deposits and funding in the short- and long-term
debt markets) with some of these competitors globally and
with others on a regional or product basis. Citi’s competitive
position depends on many factors, including, among others,
the value of Citi’s brand name, reputation, the types of clients
and geographies served; the quality, range, performance,
innovation and pricing of products and services; the
effectiveness of and access to distribution channels,
technology advances, customer service and convenience; the
effectiveness of transaction execution, interest rates and
lending limits; and regulatory constraints. Citi’s ability to
compete effectively also depends upon its ability to attract
new colleagues and retain and motivate existing colleagues,
while managing compensation and other costs. For additional
information on competitive factors and uncertainties impacting
Citi’s businesses, see “Risk Factors—Strategic Risks” above.
312
DISCLOSURE PURSUANT TO SECTION 219 OF THE
IRAN THREAT REDUCTION AND SYRIA HUMAN
RIGHTS ACT
Pursuant to Section 219 of the Iran Threat Reduction and Syria
Human Rights Act of 2012 (Section 219), which added
Section 13(r) to the Securities Exchange Act of 1934, as
amended, Citi is required to disclose in its annual or quarterly
reports, as applicable, whether it or any of its affiliates
knowingly engaged in certain activities, transactions or
dealings relating to Iran or with certain individuals or entities
that are the subject of sanctions under U.S. law. Disclosure is
generally required even where the activities, transactions or
dealings were conducted in compliance with applicable law.
Citi, in its related quarterly reports on Form 10-Q, previously
disclosed no reportable activities for the first and third quarters
of 2020 and reportable activities pursuant to Section 219 for
the second quarter of 2020.
Citi had no reportable activities pursuant to Section 219
for the fourth quarter of 2020.
313
UNREGISTERED SALES OF EQUITY SECURITIES,
REPURCHASES OF EQUITY SECURITIES AND
DIVIDENDS
Unregistered Sales of Equity Securities
None.
Equity Security Repurchases As previously announced, on
March 15, 2020, Citi joined other major U.S. banks in
suspending share repurchases in light of the COVID-19
pandemic. In addition, based on measures announced by the
Federal Reserve Board throughout 2020, share repurchases
were prohibited through the end of the fourth quarter of 2020.
Accordingly, Citi did not have any share repurchases in the
fourth quarter of 2020, other than permitted repurchases
relating to issuances of common stock related to employee
stock ownership plans. During the fourth quarter, pursuant to
Citigroup’s Board of Directors’ authorization, Citi
repurchased 50,588 shares (at an average price of $54.59) of
common stock, added to treasury stock, related to activity on
employee stock programs where shares were withheld to
satisfy the employee tax requirements.
Based on measures announced by the Federal Reserve
Board in December 2020, share repurchases will be permitted
during the first quarter of 2021, subject to limitations based on
net income for the four preceding calendar quarters, in
addition to the previously announced common dividends paid
during the first quarter of 2021. These limitations on capital
distributions may be extended by the Federal Reserve Board.
Under these modified limitations on capital distributions, Citi
is authorized to return capital to common shareholders of up to
$2.8 billion, during the first quarter of 2021, including the
previously announced common dividends of $0.51 per share in
the quarter. Citi commenced share repurchases in February
2021. For additional information on these capital distribution
limitations, see “Capital Resources—Capital Plan
Resubmission and Related Limitations on Capital
Distributions” above.
Dividends
Consistent with the regulatory capital framework, Citi paid
common dividends of $0.51 per share for the fourth quarter of
2020 and the first quarter of 2021, and intends to maintain its
planned capital actions, which include common dividends of
$0.51 per share through the second and third quarter of 2021
(the remaining quarters of the 2020 CCAR cycle), subject to
approval of Citi’s Board of Directors and the latest financial
and macroeconomic conditions.
In addition to Board of Directors’ approval, Citi’s ability
to pay common stock dividends substantially depends on the
results of the CCAR process required by the Federal Reserve
Board and the supervisory stress tests required under the
Dodd-Frank Act. For additional information regarding Citi’s
capital planning and stress testing, see “Capital Resources—
Stress Testing Component of Capital Planning” and “Risk
Factors—Strategic Risks” above.
Through the end of the first quarter of 2021, dividends
continue to be capped and tied to a formula based on recent
income. These limitations on capital distributions may be
extended by the Federal Reserve Board. For additional
information on these capital distribution limitations, see
“Capital Resources—Capital Plan Resubmission and Related
Limitations on Capital Distributions” above.
Any dividend on Citi’s outstanding common stock would
also need to be made in compliance with Citi’s obligations on
its outstanding preferred stock.
For information on the ability of Citigroup’s subsidiary
depository institutions to pay dividends, see Note 18 to the
Consolidated Financial Statements.
314
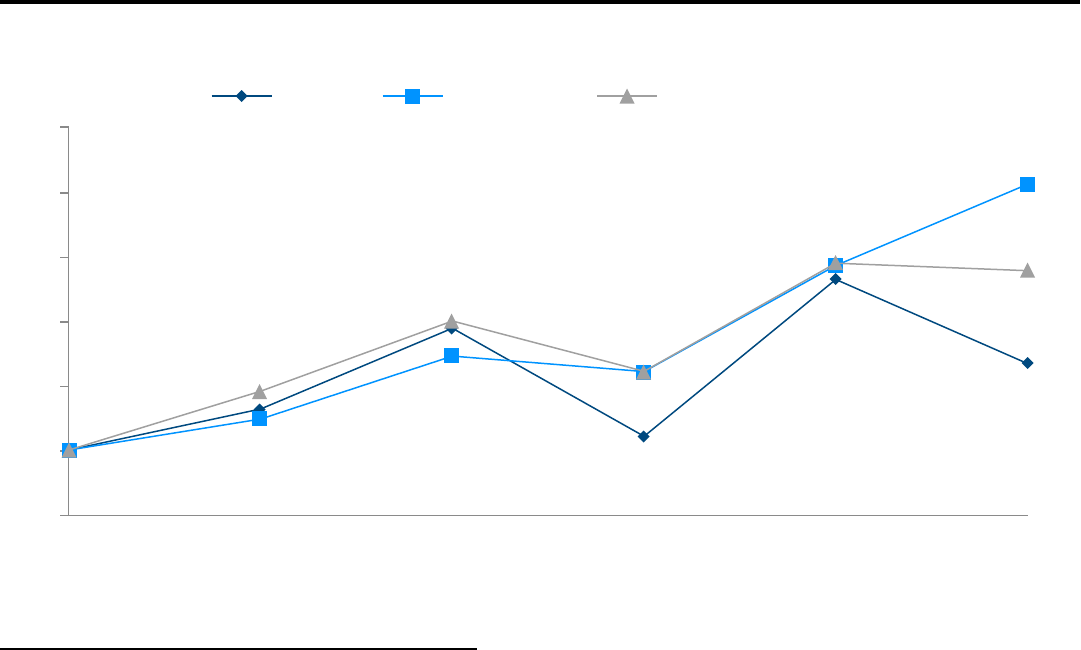
PERFORMANCE GRAPH
Comparison of Five-Year Cumulative Total Return
The following graph and table compare the cumulative total
return on Citi’s common stock with the cumulative total return
of the S&P 500 Index and the S&P Financials Index over the
five-year period through December 31, 2020. The graph and
table assume that $100 was invested on December 31, 2015 in
Citi’s common stock, the S&P 500 Index and the S&P
Financials Index, and that all dividends were reinvested.
Comparison of Five-Year Cumulative Total Return
For the years ended
Citigroup S&P 500 Index S&P Financials Index
2015 2016 2017 2018 2019 2020
75
100
125
150
175
200
225
DATE Citigroup
S&P 500
Index
S&P
Financials
Index
31-Dec-2015 100.0 100.0 100.0
31-Dec-2016 115.9 112.0 122.8
31-Dec-2017 147.2 136.4 150.0
31-Dec-2018 105.3 130.4 130.5
31-Dec-2019 166.1 171.5 172.4
31-Dec-2020 133.5 203.0 169.5
Note: Citi’s common stock is listed on the NYSE under the
ticker symbol “C” and held by 63,632 common stockholders
of record as of January 31, 2021.
315

CORPORATE INFORMATION
EXECUTIVE OFFICERS
Citigroup’s executive officers as of February 26, 2021 are:
Name Age Position and office held
Peter Babej 57 CEO, Asia Pacific
Michael L. Corbat* 60
Chief Executive Officer, Citigroup Inc.
and Citibank, N.A.
Jane Fraser* 53 President
David Livingstone 57 CEO, Europe, Middle East and Africa
Mark A. L. Mason 51 Chief Financial Officer
Mary McNiff 50 Chief Compliance Officer
Johnbull Okpara 49
Controller and Chief Accounting
Officer
Karen Peetz 65 Chief Administrative Officer
Anand Selvakesari
53 CEO, Global Consumer Banking
Edward Skyler 47 Head of Global Public Affairs
Ernesto Torres Cantú 56 CEO, Latin America
Zdenek Turek 56 Chief Risk Officer
Sara Wechter 40 Head of Human Resources
Rohan Weerasinghe 70
General Counsel and Corporate
Secretary
Mike Whitaker 57 Head of Operations and Technology
Paco Ybarra 59 CEO, Institutional Clients Group
* Ms. Fraser will succeed Mr. Corbat as Citigroup’s CEO effective
immediately following the filing of Citi’s 2020 Annual Report on Form 10-K.
Each executive officer has held his or her current executive
officer position with Citigroup for at least five years, except
that:
• Mr. Babej joined Citi in 2010 and assumed his current
position in October 2019. Previously, he served as ICG’s
Global Head of the Financial Institutions Group (FIG)
from January 2017 to October 2019 and Global Co-Head
of FIG from 2010 to January 2017. Prior to joining Citi,
Mr. Babej served as Co-Head, Financial Institutions—
Americas at Deutsche Bank, among other roles;
• Ms. Fraser joined Citi in 2004 and assumed her current
position in October 2019. Previously, she served as CEO
of GCB from October 2019 to December 2020. Before
that, she served as CEO of Citi Latin America from June
2015 to October 2019. She held a number of other roles
across the organization, including CEO of U.S. Consumer
and Commercial Banking and CitiMortgage, CEO of
Citi’s Global Private Bank and Global Head of Strategy
and M&A;
• Mr. Livingstone joined Citi in 2016 and assumed his
current position in March 2019. Previously, he served as
Citi Country Officer for Australia and New Zealand since
June 2016. Prior to joining Citi, he had a nine-year career
at Credit Suisse, where he was Vice Chairman of the
Investment Banking and Capital Markets Division for the
EMEA region, Head of M&A and CEO of Credit Suisse
Australia;
• Mr. Mason joined Citi in 2001 and assumed his current
position in February 2019. Previously, he served as CFO
of ICG since September 2014. He held a number of other
senior operational, strategic and financial executive roles
across the organization, including CEO of Citi Private
Bank, CEO of Citi Holdings and CFO and Head of
Strategy and M&A for Citi’s Global Wealth Management
Division;
• Ms. McNiff joined Citi in 2012 and assumed her current
position in June 2020. Previously, she served as CEO of
Citibank, N.A. from April 2019 to June 2020 and Chief
Auditor of Citi from February 2017 to April 2019. Prior
to taking on that role, Ms. McNiff served as Chief
Administrative Officer of Latin America & Mexico and
interim Chief Auditor. She also led the Global
Transformation initiative within Internal Audit;
• Mr. Okpara joined Citi in his current position in
November 2020. Previously he served as Managing
Director, Global Head of Financial Planning and Analysis
and CFO, Infrastructure Groups at Morgan Stanley since
2016. Prior to that, Mr. Okpara was Managing Vice
President, Finance and Deputy Controller at Capital One
Financial Corporation;
• Ms. Peetz joined Citi in her current position in June 2020.
Previously, she served on the Board of Directors of Wells
Fargo from 2017 to 2019. Ms. Peetz spent nearly 20 years
at BNY Mellon, where she managed several business
units and ultimately served as President for five years
until her departure in 2016. Prior to that, she worked at
JPMorgan Chase, where she held a variety of
management positions during her tenure;
• Mr. Selvakesari joined Citi in 1991 and assumed his
current position in January 2021. Previously, he served as
Head of the U.S. Consumer Bank since October 2018 and
he held various other roles at Citi prior to that, including
Head of Consumer Banking for Asia Pacific from 2015 to
2018, as well as a number of regional and country roles,
including Head of Consumer Banking for ASEAN and
India, leading the consumer banking businesses in
Singapore, Malaysia, Indonesia, Philippines, Thailand and
Vietnam, as well as India;
• Mr. Torres Cantú joined Citi in 1989 and assumed his
current position in October 2019. Previously, he served as
CEO of Citibanamex since October 2014. He served as
CEO of GCB in Mexico from 2006 to 2011 and CEO of
Crédito Familiar from 2003 to 2006. In addition, he
previously held roles in Citibanamex, including Regional
Director and Divisional Director;
• Mr. Turek joined Citi in 1991 and assumed his current
position in December 2020. Previously, he served as CRO
for EMEA since February 2020 and held various other
roles at Citi, including CEO of Citibank Europe as well as
leading significant franchises across Citi, including in
Russia, South Africa and Hungary;
• Ms. Wechter joined Citi in 2004 and assumed her current
position in July 2018. Previously, she served as Citi’s
Head of Talent and Diversity as well as Chief of Staff to
Citi CEO Michael Corbat. She served as Chief of Staff to
both Michael O’Neill and Richard Parsons during their
terms as Chairman of Citigroup’s Board of Directors. In
addition, she held roles in Citi’s ICG, including Corporate
M&A and Strategy and Investment Banking;
316

• Mr. Whitaker joined Citi in 2009 and assumed his current
position in November 2018. Previously, he served as
Head of Operations & Technology for ICG since
September 2014 and held various other roles at Citi,
including Head of Securities & Banking Operations &
Technology, Head of ICG Technology and Regional
Chief Information Officer; and
• Mr. Ybarra joined Citi in 1987 and assumed his current
position in May 2019. Previously, he served as ICG’s
Global Head of Markets and Securities Services since
November 2013. In addition, he has held a number of
other roles across ICG, including Deputy Head of ICG,
Global Head of Markets and Co-Head of Global Fixed
Income.
Code of Conduct, Code of Ethics
Citi has a Code of Conduct that maintains its commitment to
the highest standards of conduct. The Code of Conduct is
supplemented by a Code of Ethics for Financial Professionals
(including accounting, controllers, financial reporting
operations, financial planning and analysis, treasury, tax,
strategy and M&A, investor relations and regional/product
finance professionals and administrative staff) that applies
worldwide. The Code of Ethics for Financial Professionals
applies to Citi’s principal executive officer, principal financial
officer and principal accounting officer. Amendments and
waivers, if any, to the Code of Ethics for Financial
Professionals will be disclosed on Citi’s website,
www.citigroup.com.
Both the Code of Conduct and the Code of Ethics for
Financial Professionals can be found on the Citi website by
clicking on “About Us,” and then “Corporate Governance.”
Citi’s Corporate Governance Guidelines can also be found
there, as well as the charters for the Audit Committee, the
Ethics and Culture Committee, the Nomination, Governance
and Public Affairs Committee, the Operations and Technology
Committee, the Personnel and Compensation Committee and
the Risk Management Committee of Citigroup’s Board of
Directors. These materials are also available by writing to
Citigroup Inc., Corporate Governance, 388 Greenwich Street,
17th Floor, New York, New York 10013.
CITIGROUP BOARD OF DIRECTORS
Michael L. Corbat
Chief Executive Officer
Citigroup Inc. and Citibank, N.A.
Ellen M. Costello
Former President and CEO
BMO Financial Corporation and
Former U.S. Country Head
BMO Financial Group
Grace E. Dailey
Former Senior Deputy Comptroller
for Bank Supervision Policy and
Chief National Bank Examiner
Office of the Comptroller of the
Currency (OCC)
Barbara Desoer
Chair
Citibank, N.A.
John C. Dugan
Chair
Citigroup Inc.
Jane Fraser
President of Citigroup Inc.
Duncan P. Hennes
Co-Founder and Partner
Atrevida Partners, LLC
Peter Blair Henry
Dean Emeritus and W. R.
Berkley Professor of Economics
and Finance
New York University
Stern School of Business
S. Leslie Ireland
Former Assistant Secretary for
Intelligence and Analysis
U.S. Department of the Treasury
Lew W. (Jay) Jacobs, IV
Former President and Managing
Director
Pacific Investment Management
Company LLC (PIMCO)
Renée J. James
Founder, Chairman and CEO
Ampere Computing
Gary M. Reiner
Operating Partner
General Atlantic LLC
Diana L. Taylor
Former Superintendent of Banks
State of New York
James S. Turley
Former Chairman and CEO
Ernst & Young
Deborah C. Wright
Former Chairman
Carver Bancorp, Inc.
Alexander Wynaendts
Former Chief Executive Officer
and Chairman of the Executive
Board
Aegon N.V.
Ernesto Zedillo Ponce de Leon
Director, Center for the
Study of Globalization and
Professor in the Field
of International
Economics and Politics
Yale University
317

Signatures
Pursuant to the requirements of Section 13 or 15(d) of the
Securities Exchange Act of 1934, the registrant has duly
caused this report to be signed on its behalf by the
undersigned, thereunto duly authorized, on the 26th day of
February, 2021.
Citigroup Inc.
(Registrant)
/s/ Mark A. L. Mason
Mark A. L. Mason
Chief Financial Officer
Pursuant to the requirements of the Securities Exchange Act of
1934, this report has been signed below by the following
persons on behalf of the registrant and in the capacities
indicated on the 26th day of February, 2021.
Citigroup’s Principal Executive Officer and a Director:
/s/ Michael L. Corbat
Michael L. Corbat
Citigroup’s Principal Financial Officer:
/s/ Mark A. L. Mason
Mark A. L. Mason
Citigroup’s Principal Accounting Officer:
/s/ Johnbull E. Okpara
Johnbull E. Okpara
The Directors of Citigroup listed below executed a power of
attorney appointing Mark A. L. Mason their attorney-in-fact,
empowering him to sign this report on their behalf.
Ellen M. Costello Lew W. (Jay) Jacobs, IV
Grace E. Dailey Renée J. James
Barbara Desoer Gary M. Reiner
John C. Dugan Diana L. Taylor
Jane Fraser James S. Turley
Duncan P. Hennes Deborah C. Wright
Peter Blair Henry Alexander Wynaendts
S. Leslie Ireland Ernesto Zedillo Ponce de Leon
/s/ Mark A. L. Mason
Mark A. L. Mason
318

EXHIBIT INDEX
Exhibit
Number Description of Exhibit
3.01+ Restated Certificate of Incorporation of Citigroup, as amended, as in effect on the date hereof.
3.02
By-Laws of Citigroup, as amended, as in effect on the date hereof, incorporated by reference to the Company’s
Current Report on Form 8-K filed December 18, 2019 (File No. 001-09924).
4.01
Form of Senior Indenture between Citigroup and The Bank of New York Mellon, as trustee, incorporated by
reference to Exhibit 4.8 to the Company’s Registration Statement on Form S-3 filed November 13, 2013 (File No.
333-192302).
4.02
First Supplemental Indenture, dated as of February 1, 2016, between Citigroup and The Bank of New York Mellon,
as trustee, incorporated by reference to Exhibit 4.01 to the Company’s Current Report on Form 8-K filed on
February 1, 2016 (File No. 001-9924).
4.03
Second Supplemental Indenture, dated as of December 29, 2016, between Citigroup and The Bank of New York
Mellon, as trustee, incorporated by reference to Exhibit 4.01 to the Company’s Current Report on Form 8-K filed
on December 29, 2016 (File No. 001-9924).
4.04
Third Supplemental Indenture dated as of June 26, 2017 among Citigroup Global Markets Holdings Inc., the
Company and The Bank of New York Mellon, as trustee, to Indenture dated as of November 13, 2013,
incorporated by reference to Exhibit 4.01 to the Company’s Quarterly Report on Form 10-Q filed August 1, 2017
(File No. 001-09924).
4.05
Fourth Supplemental Indenture dated as of June 27, 2019, between Citigroup and The Bank of New York Mellon,
as trustee, incorporated by reference to Exhibit 4.2 to the Company’s Current Report on Form 8-K filed on June 28,
2019 (File No. 001-09924).
4.06
Subordinated Debt Indenture, dated as of April 12, 2001, between the Company and The Bank of New York
Mellon, as successor to JP Morgan Chase Bank (formerly Bank One Trust Company, N.A.), as trustee,
incorporated by reference to Exhibit 4.1 to the Company’s Registration Statement on Form S-3 filed February 4,
2013 (File No. 333-186425).
4.07
First Supplemental Indenture, dated as of August 2, 2004, between the Company and J.P. Morgan Trust Company,
N.A. (formerly Bank One Trust Company, N.A.), as trustee, incorporated by reference to Exhibit 4.13 to the
Company’s Registration Statement on Form S-3/A filed August 31, 2004 (File No. 333-117615).
4.08
Second Supplemental Indenture, dated as of May 18, 2016, between Citigroup and The Bank of New York Mellon,
as successor to J.P. Morgan Trust Company, N.A. (formerly Bank One Trust Company, N.A.), as trustee,
incorporated by reference to Exhibit 4.2 to the Company’s Current Report on Form 8-K filed on May 20, 2016
(File No. 001-9924).
4.09
Third Supplemental Indenture, dated as of March 1, 2017, between Citigroup and The Bank of New York Mellon,
as successor to J.P. Morgan Trust Company, N.A. (formerly Bank One Trust Company, N.A.), as trustee,
incorporated by reference to Exhibit 4.11 to the Company’s Registration Statement on Form S-3 filed March 1,
2017 (File No. 333-216372).
4.10
Fourth Supplemental Indenture, dated as of June 27, 2019, between Citigroup and The Bank of New York
Mellon,as trustee, incorporated by reference to Exhibit 4.1 to the Company’s Current Report on Form 8-K filed on
June 28, 2019 (File No. 001-09924).
319

4.11
Indenture, dated as of March 15, 1987, between Primerica Corporation, a New Jersey corporation, and The Bank of
New York, as trustee, incorporated by reference to Exhibit 4.01 to the Company’s Registration Statement on Form
S-3 filed December 8, 1992 (File No. 03355542).
4.12
First Supplemental Indenture, dated as of December 15, 1988, among Primerica Corporation, Primerica Holdings,
Inc. and The Bank of New York, as trustee, incorporated by reference to Exhibit 4.02 to the Company’s
Registration Statement on Form S-3 filed December 8, 1992 (File No. 03355542).
4.13
Second Supplemental Indenture, dated as of January 31, 1991, between Primerica Holdings, Inc. and The Bank of
New York, as trustee, incorporated by reference to Exhibit 4.03 to the Company’s Registration Statement on Form
S-3 filed December 8, 1992 (File No. 03355542).
4.14
Third Supplemental Indenture, dated as of December 9, 1992, among Primerica Holdings, Inc., Primerica
Corporation and The Bank of New York, as trustee, incorporated by reference to Exhibit 5 to the Company’s Form
8-A dated December 21, 1992, with respect to its 7 3/4% Notes Due June 15, 1999 (File No. 001-09924).
4.15
Fourth Supplemental Indenture, dated as of November 2, 1998, between the Company and The Bank of New York,
as trustee, incorporated by reference to Exhibit 4.01 to the Company’s Quarterly Report on Form 10-Q for the
quarter ended September 30, 1998 (File No. 001-09924).
4.16
Fifth Supplemental Indenture, dated as of December 9, 2008, between the Company and The Bank of New York
Mellon, as trustee, incorporated by reference to Exhibit 4.04 to the Company’s Current Report on Form 8-K filed
December 11, 2008 (File No. 001-09924).
4.17
Sixth Supplemental Indenture, dated as of December 20, 2012, between the Company and The Bank of New York
Mellon, as trustee, providing for the issuance of debt securities, incorporated by reference to Exhibit 4.5 to the
Company’s Current Report on Form 8-K filed December 21, 2012 (File No. 001-09924).
4.18
Seventh Supplemental Indenture, dated as of May 18, 2016, between Citigroup Inc. and The Bank of New York
Mellon, as trustee, incorporated by reference to Exhibit 4.1 to the Company’s Current Report on Form 8-K filed
May 20, 2016 (File No. 001-9924).
4.19
Senior Debt Indenture, dated as of June 1, 2005, among Citigroup Funding Inc., the Company and The Bank of
New York Mellon, as successor trustee to JPMorgan Chase Bank, N.A., incorporated by reference to Exhibit 4(b)
to the Company’s Registration Statement on Form S-3 filed March 13, 2006 (File No. 333-132370-01).
4.20
Second Supplemental Indenture, dated as of December 20, 2012, among Citigroup Funding Inc., the Company and
The Bank of New York Mellon, as successor trustee to JPMorgan Chase Bank, N.A., incorporated by reference to
Exhibit 4.2 to the Company’s Current Report on Form 8-K filed December 21, 2012 (File No. 001-09924).
4.21
Indenture, dated as of July 23, 2004, between the Company and The Bank of New York Mellon, as successor
trustee to JPMorgan Chase Bank, as trustee, incorporated by reference to Exhibit 4.28 to the Company’s
Registration Statement on Form S-3 filed July 23, 2004 (File No. 333-117615).
4.22
Form of Indenture, between the Company and The Bank of New York Mellon, as successor trustee to JPMorgan
Chase Bank, incorporated by reference to Exhibit 4.01 to the Company’s Post-Effective Amendment No. 2 to the
Registration Statement on Form S-3 filed May 4, 2007 (File No. 333-135163).
4.23
Form of Indenture, between the Company and The Bank of New York Mellon, as successor trustee to JPMorgan
Chase Bank (formerly known as The Chase Manhattan Bank), incorporated by reference to Exhibit 4.11 to the
Travelers Group Inc. Registration Statement on Form S-3 filed September 20, 1996 (File No. 333-12439).
4.24
Senior Debt Indenture, dated as of March 8, 2016, between Citigroup Global Markets Holdings Inc., the Company
and The Bank of New York Mellon, as trustee, incorporated by reference to Exhibit 4.1 to the Company’s Current
Report on Form 8-K filed March 9, 2016 (File No. 001-09924).
320

4.25
First Supplemental Indenture, dated as of March 1, 2017, between Citigroup Global Markets Holdings Inc., the
Company and the Bank of New York Mellon, as trustee, incorporated by reference to Exhibit 4.24 to the
Company’s Registration Statement on Form S-3 filed March 1, 2017 (File No. 333-216372).
4.26
Second Supplemental Indenture, dated as of April 13, 2020, between Citigroup Global Markets Holdings Inc., the
Company and the Bank of New York Mellon, as trustee, incorporated by reference to Exhibit 4.01 to the
Company’s Current Report on Form 8-K filed on April 13, 2020 (File No. 001-09924).
4.27
Form of Capital Securities Guarantee Agreement between the Company, as Guarantor, and The Bank of New York
Mellon, as Guarantee Trustee, incorporated by reference to Exhibit 4.32 to the Company’s Registration Statement
on Form S-3 filed July 2, 2004 (File No. 333-117615).
4.28
Specimen Physical Common Stock Certificate of Citigroup, incorporated by reference to Exhibit 4.1 to the
Company’s Current Report on Form 8-K filed May 9, 2011 (File No. 001-09924).
4.29+ Description of Citigroup’s Securities Registered Pursuant to Section 12 of the Securities Exchange Act of 1934.
10.01*
Citi Discretionary Incentive and Retention Award Plan (as Amended and Restated Effective as of January 1, 2015),
incorporated by reference to Exhibit 10.01 to the Company’s Annual Report on Form 10-K for the fiscal year
ended December 31, 2014 (File No. 001-09924) (the “Company’s 2014 10-K”).
10.02.1*
Citigroup 2009 Stock Incentive Plan (as amended and restated effective April 24, 2013), incorporated by reference
to Exhibit 10.1 to the Company’s Current Report on Form 8-K filed April 26, 2013 (File No. 001-09924).
10.02.2*
Citigroup 2014 Stock Incentive Plan (as amended and restated effective April 24, 2018), incorporated by reference
to Exhibit 10.1 to the Company’s Current Report on Form 8-K filed April 30, 2018 (File No. 001-09924).
10.02.3*
Citigroup 2019 Stock Incentive Plan (as amended and restated effective April 21, 2020), incorporated by reference
to Exhibit 10.1 to the Company’s Current Report on Form 8-K filed April 17, 2019 (File No. 001-09924).
10.03*
Citigroup Inc. Deferred Cash Award Plan (as Amended and Restated Effective as of January 1, 2015), incorporated
by reference to Exhibit 10.03 to the Company’s 2014 10-K.
10.04.1*
Form of Citigroup Inc. CAP/DCAP Agreement, incorporated by reference to Exhibit 10.01 to the Company’s
Quarterly Report on Form 10-Q for the quarterly period ended September 30, 2015 (File No. 001-09924).
10.04.2*
Form of Citigroup Inc. CAP/DCAP Agreement (for awards granted on February 14, 2019 and in future years),
incorporated by reference to Exhibit 10.02 to the Company’s Quarterly Report on Form 10-Q for the quarterly
period ended March 31, 2019 (File No. 001-09924).
10.05*
Form of Citigroup Inc. CAP Agreement, incorporated by reference to Exhibit 10.01 to the Company’s Quarterly
Report on Form 10-Q for the quarterly period ended September 30, 2019 (File No. 001-09924).
10.06*
Citigroup Inc. DCAP Agreement, incorporated by reference to Exhibit 10.04 to the Company’s Quarterly Report
on Form 10-Q for the quarterly period ended March 31, 2020 (File No. 001-09924).
10.07*
The Amended and Restated 2011 Citigroup Executive Performance Plan (as amended and restated as of January 1,
2016, and as further amended on February 16, 2017), incorporated by reference to Exhibit 10.2 to the Company’s
Current Report on Form 10-Q filed for the quarterly period ended March 31, 2017 (File No. 001-09924).
10.08.1*
Form of Citigroup Inc. Performance Share Unit Award Agreement (awards dated February 16, 2017 and in future
years), incorporated by reference to Exhibit 10.01 to the Company’s Quarterly Report on Form 10-Q for the
quarterly period ended March 31, 2017 (File No. 001-09924).
321

10.08.2*
Form of Citigroup Inc. Performance Share Unit Award Agreement (awards dated February 14, 2019 and in future
years), incorporated by reference to Exhibit 10.01 to the Company’s Quarterly Report on Form 10-Q for the
quarterly period ended March 31, 2019 (File No. 001-09924).
10.09*
Citigroup Management Committee Termination Notice and Non-Solicitation Policy, effective October 2, 2006,
incorporated by reference to Exhibit 10.1 to the Company’s Current Report on Form 8-K filed October 6, 2006
(File No. 001-09924).
10.10*
Citigroup Inc. Omnibus Non-Qualified Plan Amendment, effective as of June 2, 2014, incorporated by reference to
Exhibit 10.01 to the Company’s Quarterly Report on Form 10-Q for the quarterly period ended June 30, 2014 (File
No. 001-09924).
10.11*
The Retirement Plan for Specified Non-United States International Staff of Citibank, N.A. and Participating
Companies As Amended and Restated Effective January 1, 2000 (with amendments through December 31, 2008),
incorporated by reference to Exhibit 10.02 to the Company’s Quarterly Report on Form 10-Q for the quarterly
period ended March 31, 2020 (File No. 001-09924).
10.12*
Letter Agreement, dated December 21, 2011, between Citigroup Inc. and Michael Corbat, incorporated by
reference to Exhibit 10.1 to the Company’s Current Report on Form 8-K filed December 22, 2011 (File No.
001-09924).
10.13*
Citigroup Inc. Non-Employee Directors Compensation Plan (effective as of January 1, 2008), incorporated by
reference to Exhibit 10.01 to the Company’s Quarterly Report on Form 10-Q for the quarterly period ended
September 30, 2007 (File No. 001-09924).
10.14*
Citigroup Inc. Off-Cycle Award Agreement for Deferred Stock Award and Deferred Cash Award granted to Jane
Fraser (dated November 25, 2019), incorporated by reference to Exhibit 10.14 to the Company’s Annual Report on
Form 10-K for the fiscal year ended December 31, 2019 (File No. 001-09924) (the “Company’s 2019 10-K”).
10.15*
Agreement between Stephen Bird and Citibank, N.A. (dated November 8, 2019), incorporated by reference to
Exhibit 10.15 to the Company’s 2019 form 10-K (File No. 001-09924).
10.16.1*
Letter Agreement, dated April 22, 2020, between Paco Ybarra and Citigroup Global Markets Limited, incorporated
by reference to Exhibit 10.03 to the Company’s Quarterly Report on Form 10-Q for the quarterly period ended
March 31, 2020 (File No. 001-09924).
10.16.2*
Amendment to Letter Agreement, dated April 22, 2020, between Paco Ybarra and Citigroup Global Markets
Limited (dated June 19, 2020), incorporated by reference to Exhibit 10.01 to the Company’s Quarterly Report on
Form 10-Q for the quarterly period ended June 30, 2020 (File No. 001-09924).
10.16.3*
Amendment to Letter Agreement, dated April 22, 2020, between Paco Ybarra and Citigroup Global Markets
Limited (dated June 29, 2020), incorporated by reference to Exhibit 10.02 to the Company’s Quarterly Report on
Form 10-Q for the quarterly period ended June 30, 2020 (File No. 001-09924).
18.01+ Preferability Letter of KPMG LLP, Independent Registered Public Accounting Firm.
21.01+ Subsidiaries of Citigroup.
23.01+ Consent of KPMG LLP, Independent Registered Public Accounting Firm.
24.01+ Powers of Attorney.
31.01+ Certification of principal executive officer pursuant to Section 302 of the Sarbanes-Oxley Act of 2002.
322

31.02+ Certification of principal financial officer pursuant to Section 302 of the Sarbanes-Oxley Act of 2002.
32.01+
Certification pursuant to 18 U.S.C. Section 1350, as adopted pursuant to Section 906 of the Sarbanes-Oxley Act of
2002.
99.01+
List of Securities Registered Pursuant to Section 12(b) of the Securities Exchange Act of 1934, formatted in inline
XBRL.
101.01+
Financial statements from the Annual Report on Form 10-K of Citigroup for the fiscal year ended December 31,
2020, filed on February 26, 2021 , formatted in inline XBRL: (i) the Consolidated Statement of Income, (ii) the
Consolidated Balance Sheet, (iii) the Consolidated Statement of Changes in Equity, (iv) the Consolidated
Statement of Cash Flows and (v) the Notes to Consolidated Financial Statements.
104 The cover page of this Current Report on Form 10-K, formatted in inline XBRL.
The total amount of securities authorized pursuant to any instrument defining rights of holders of long-term debt of the Company does
not exceed 10% of the total assets of the Company and its consolidated subsidiaries. The Company will furnish copies of any such
instrument to the SEC upon request.
Copies of any of the exhibits referred to above will be furnished at a cost of $0.25 per page (although no charge will be made for the
2020 Annual Report on Form 10-K) to security holders who make written request to Citigroup Inc., Corporate Governance, 388
Greenwich Street, New York, NY 10013.
* Denotes a management contract or compensatory plan or arrangement.
+ Filed herewith.
323

Stockholder Information
Produced by Citi Graphic Communications.
The cover and editorial section of this annual report are printed on McCoy, manufactured by Sappi North America with 10% recycled content
and FSC
®®
Chain of Custody Certified. 100% of the electricity used to manufacture McCoy is Green-e
®®
certified renewable energy.
The financial section of this annual report is printed on FSC
®
certified Accent Opaque from International Paper.
Citi, Citi and Arc Design and other marks used herein are service marks of Citigroup Inc. or its affiliates, used and registered throughout the world.
Inside cover photo: Courtesy SOM © Magda Biernat Photography.
Citigroup common stock is listed on the NYSE under the
ticker symbol “C.” Citigroup preferred stock Series J and K
are also listed on the NYSE.
Because Citigroup’s common stock is listed on the NYSE,
the Chief Executive Officer is required to make an annual
certification to the NYSE stating that he was not aware of
any violation by Citigroup of the corporate governance listing
standards of the NYSE. The annual certification to that effect
was made to the NYSE on May 14, 2020.
As of January 31, 2021, Citigroup had approximately 63,632
common stockholders of record. This figure does not
represent the actual number of beneficial owners of common
stock because shares are frequently held in “street name”
by securities dealers and others for the benefit of individual
owners who may vote the shares.
Transfer Agent
Stockholder address changes and inquiries regarding stock
transfers, dividend replacement, 1099-DIV reporting and
lost securities for common and preferred stock should be
directed to:
Computershare
P.O. Box 505005
Louisville, KY 40233-5005
Telephone No. 781 575 4555
Toll-free No. 888 250 3985
E-mail address: shareholder@computershare.com
Web address: www.computershare.com/investor
Exchange Agent
Holders of Golden State Bancorp, Associates First Capital
Corporation or Citicorp common stock should arrange to
exchange their certificates by contacting:
Computershare
P.O. Box 505004
Louisville, KY 40233-5004
Telephone No. 781 575 4555
Toll-free No. 888 250 3985
E-mail address: shareholder@computershare.com
Web address: www.computershare.com/investor
On May 9, 2011, Citi effected a 1-for-10 reverse stock split.
All Citi common stock certificates issued prior to that date
must be exchanged for new certificates by contacting
Computershare at the address noted above.
Citi’s 2020 Form 10-K filed with the SEC, as well as other
annual and quarterly reports, are available from Citi
Document Services toll free at 877 936 2737 (outside the
United States at 716 730 8055), by e-mailing a request to
docserv[email protected]om or by writing to:
Citi Document Services
540 Crosspoint Parkway
Getzville, NY 14068
Stockholder Inquiries
Information about Citi, including quarterly earnings
releases and filings with the U.S. Securities and Exchange
Commission, can be accessed via Citi’s website at
www.citigroup.com. Stockholder inquiries can also be
directed by e-mail to shareholderrelations@citi.com.

© 2021 Citigroup Inc.
2001312 CIT24029 03/21
Take a closer look at Citi with
the digital Annual Report:
citi.com/annualreport
www.citigroup.com
