May 23, 2024
Medtronic plc
Q4 FY24
Earnings presentation
Not started
Work in progress
Update complete
Not started
Work in progress
Update complete

Forward Looking Statements
This presentation contains forward-looking statements within the meaning of the Private Securities Litigation Reform Act of 1995, which are subject to risks and uncertainties,
including risks related to competitive factors, difficulties and delays inherent in the development, manufacturing, marketing and sale of medical products, government
regulation, geopolitical conflicts, general economic conditions, and other risks and uncertainties described in the company’s periodic reports on file with the US Securities and
Exchange Commission including the most recent Annual Report on Form 10-K of the company. Actual results may differ materially from anticipated results. Medtronic does
not undertake to update its forward-looking statements or any of the information contained in this presentation, including to reflect future events or circumstances.
Non-GAAP financial measures
Certain information in this presentation includes calculations or figures that have been prepared internally and have not been reviewed or audited by our independent
registered public accounting firm. Use of different methods for preparing, calculating or presenting information may lead to differences and such differences may be material.
This presentation contains financial measures and guidance which are considered “non-GAAP” financial measures under applicable SEC rules and regulations. Medtronic
management believes that non-GAAP financial measures provide information useful to investors in understanding the company’s underlying operational performance and
trends and to facilitate comparisons with the performance of other companies in the med tech industry. Non-GAAP financial measures should be considered supplemental to
and not a substitute for financial information prepared in accordance with US generally accepted accounting principles (GAAP), and investors are cautioned that Medtronic
may calculate non-GAAP financial measures in a way that is different from other companies. Management strongly encourages investors to review the company’s consolidated
financial statements and publicly filed reports in their entirety. All GAAP to non-GAAP reconciliations are provided on our website.
Medtronic calculates forward-looking non-GAAP financial measures based on internal forecasts that omit certain amounts that would be included in GAAP financial measures.
For instance, forward-looking organic revenue growth guidance excludes the impact of foreign currency fluctuations, as well as significant acquisitions or divestitures.
Forward-looking diluted non-GAAP EPS guidance also excludes other potential charges or gains that would be recorded as non-GAAP adjustments to earnings during the
fiscal year. Medtronic does not attempt to provide reconciliations of forward-looking non-GAAP EPS guidance to projected GAAP EPS guidance because the combined
impact and timing of recognition of these potential charges or gains is inherently uncertain and difficult to predict and is unavailable without unreasonable efforts. In addition,
the company believes such reconciliations would imply a degree of precision and certainty that could be confusing to investors. Such items could have a substantial impact on
GAAP measures of financial performance.
Financial comparisons
References to results increasing, decreasing, or remaining flat are in comparison to the same period in the prior fiscal year. References to organic revenue growth exclude the
impact of significant acquisitions or divestitures, currency, and a one-time payment in the prior year relating to an intellectual property agreement. Unless stated otherwise,
quarterly and annual rates and ranges are given on an organic basis. References to sequential revenue changes are made on an “as reported” basis. Unless stated otherwise,
all references to share gains or losses are as of the most recently completed calendar quarter, on a revenue basis, and in comparison to the same period in the prior year.
| Q4 FY24 Earnings Presentation | May 23, 20242


We delivered a strong finish to the fiscal
year, with broad strength across our
businesses and each of our four segments
posting mid-single digit or higher organic
revenue growth.
Our momentum is building into the new
fiscal year. We’re beginning new product
cycles in some of MedTech’s most
attractive markets, which is further
enhanced as we apply AI across our
portfolio. We are very optimistic about
what we can achieve in fiscal ’25 and
beyond.”
Q4 FY24 Highlights
Delivered a strong finish to fiscal year; broad-based durable growth across the company; gaining momentum as company
enters new product cycles across many high-growth markets
Solid overall execution as momentum continues; durable MSD revenue growth on MSD
comps; delivering on commitments
– Notable strength in Cranial & Spinal Technologies, Diabetes, Cardiac Pacing, Surgical, and Structural Heart
– Strong growth around the globe with MSD non-US Developed growth and 13% EM growth, as we expand access to
our innovative healthcare technologies
Entering new product cycles in some of MedTech’s most attractive markets
– Several recent product approvals that are just starting, or yet to contribute, to growth, including Evolut FX+,
PulseSelect
pulsed field ablation system, Symplicity Spyral RDN system, Percept RC featuring BrainSense
technology, Inceptiv
closed-loop spinal cord stimulator, and MiniMed 780G System with Simplera Sync CGM
– Advancing innovative core tech in robotics, AI, and closed loop systems; 6 AI products already FDA approved
Making progress on restoring earnings power; translating into strong and improving
cash flow and returns to shareholders
Comprehensive transformation taking hold; executing programs to leverage scale and drive efficiencies
– Adj. gross margin remained flat Y/Y, despite FX and continued elevated inflation; seeing early benefits of COGS
efficiency efforts
– $5.2B in free cash flow YTD; $1.6B of net share repurchase in Q4
Issuing FY25 revenue growth and EPS guidance
Reflects durable, mid-single digit revenue growth and a significant step forward on earnings power
– Organic revenue growth: 4% to 5%
– Adjusted EPS: $5.40 – $5.50, implies growth of 4% to 6%
GEOFF MARTHA,
CHAIRMAN & CEO
Table of
Contents
Executive
Summary
Portfolio
Highlights
Sustainability Appendix
Guidance &
Assumptions
Financial
Highlights
FY24
Recap
| Q4 FY24 Earnings Presentation | May 23, 20245
Emerging Markets
$1,572M
+9.2% Y/Y Rep
+13.1% Y/Y Org
Non-US Developed
$2,674M
+1.7% Y/Y Rep
+4.2% Y/Y Org
United States
$4,343M
(3.0%) Y/Y Rep
+3.5% Y/Y Org
Diabetes
$660M
+10.9% Y/Y Rep
+11.1% Y/Y Org
Medical Surgical
$2,198M
+3.5% Y/Y Rep
+4.5% Y/Y Org
Other
$57M
(50.0%) Y/Y Rep
Total MDT
$8,589M
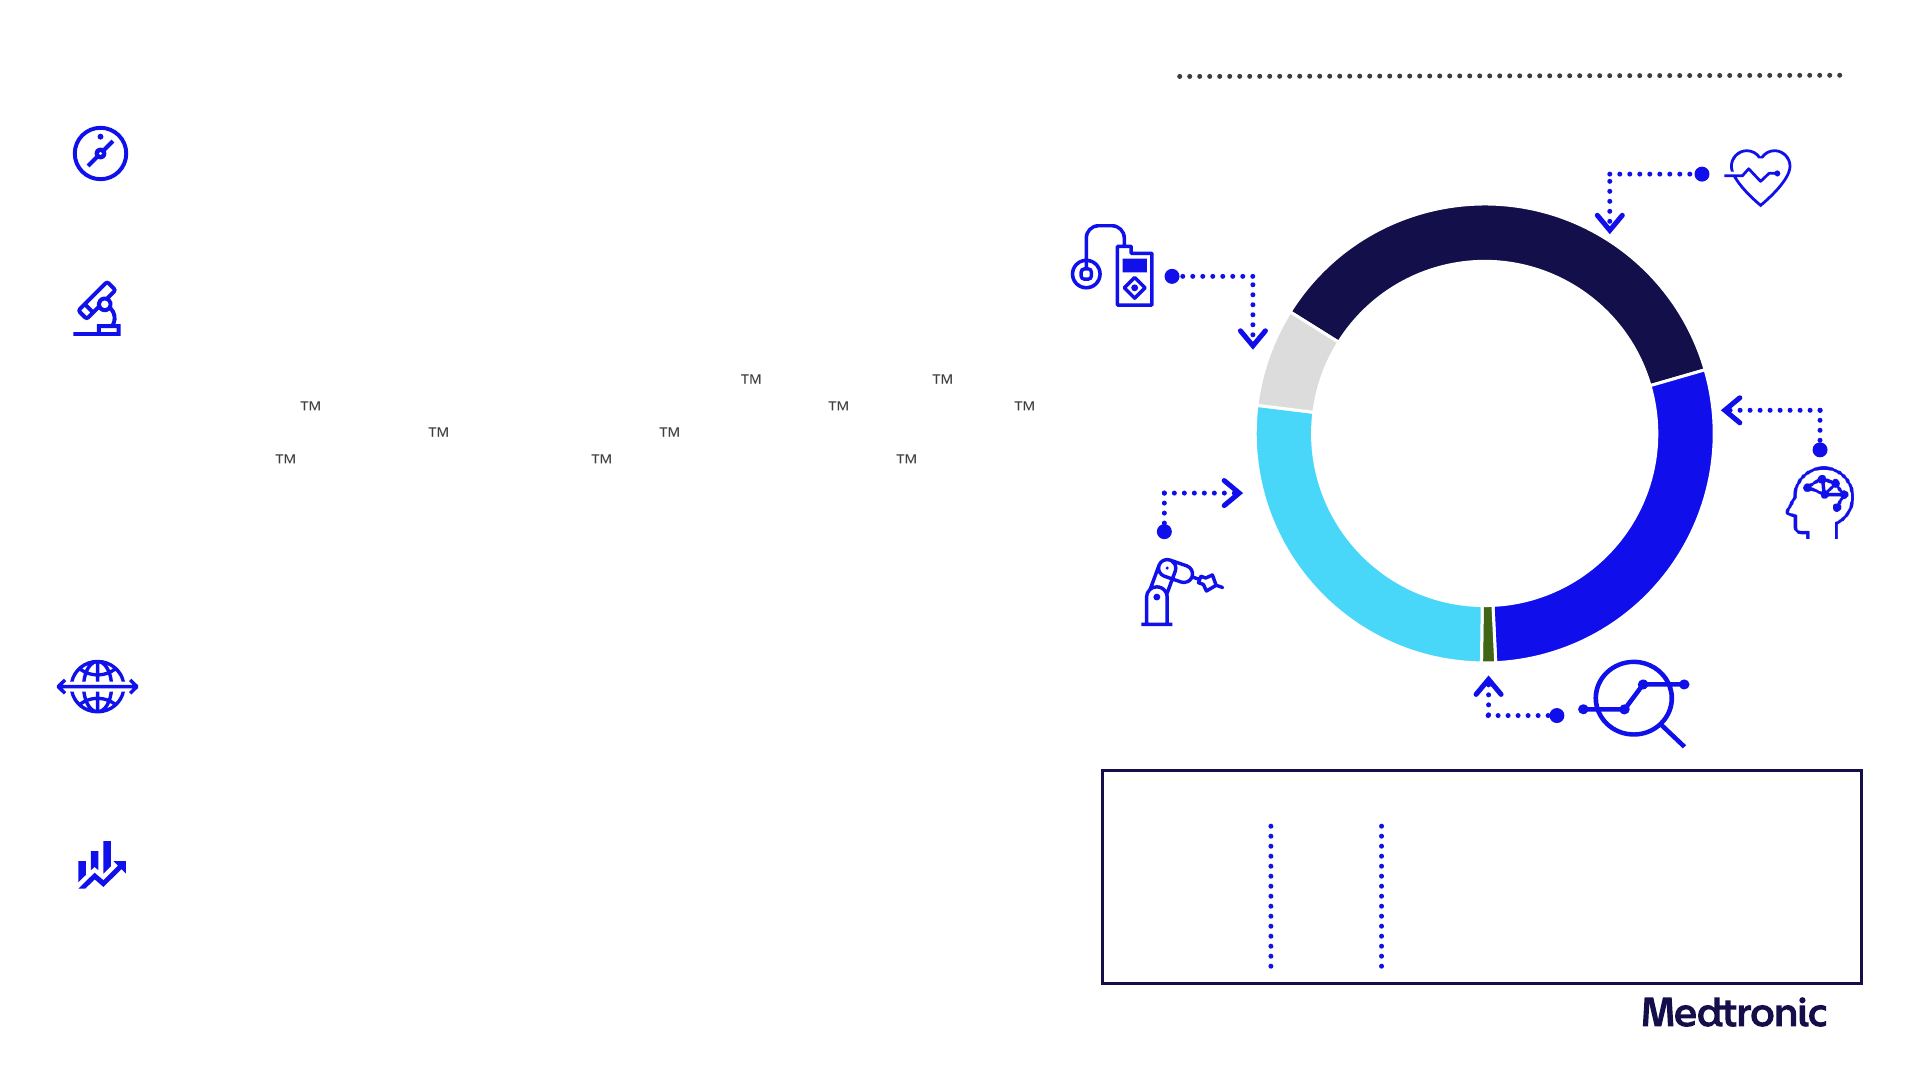
Q4 FY24 Financial summary
+0.5% Y/Y Rep
Cardiovascular
$3,130M
(5.2%) Y/Y Rep
+4.0% Y/Y Org
Neuroscience
$2,545M
+5.6% Y/Y Rep
+6.5% Y/Y Org
Free cash flow
2
YTD
$1.46
GAAP
Diluted EPS
Y/Y %
CC Y/Y %
$0.49
(44.3%)
(2.5%)
N/A
$5.2B
Non-GAAP
+5.4% Y/Y Org
Revenue
1
by segment
Revenue
1
by geography
Cash flow from
operations YTD
$6.8B
1) Data has been intentionally rounded to the nearest million and, therefore, may not sum.
2) Operating cash flows less property, plant, and equipment additions.
(7.0%)
Table of
Contents
Executive
Summary
Portfolio
Highlights
Sustainability Appendix
Guidance &
Assumptions
Financial
Highlights
FY24
Recap
| Q4 FY24 Earnings Presentation | May 23, 20246
Nitron
CryoConsole
System
(Europe & US)
PulseSelect
Pulse Field
Ablation System
(Europe & US)
Key product approvals
Recent rapid cadence of meaningful innovative approvals; ~130 product approvals in last 12 months in key geographies
1
Simplera CGM
(Europe)
Inceptiv Spinal
Cord Stimulator
(Europe)
Q1 FY24
Percept RC
Neurostimulator
with BrainSense
(Europe & US)
Note: Relative positioning is not intended to signify relative timing
1) Includes US, EU, Japan and China. Does not include all indication or partner approvals, though select additional approvals are
displayed
Q4 FY24
Aurora EV-ICD
System
(US)
SynchroMed III
Intrathecal Drug
Delivery System
(US)
Micra AV2 &
Micra
VR2
(Europe)
ClosureFast
Radiofrequency
Ablation Catheter
(US)
Evolut FX
TAVR System
(Europe)
Symplicity Spyral
Renal Denervation
System
(US)
Avalus Ultra
Surgical Aortic
Tissue Valve
(US)
MiniMed 780G
System with
Simplera Sync
(Europe)
OsteoCool 2.0
Bone Tumor
Ablation System
(US)
Evolut FX+
TAVR System
(US)
Inceptiv Spinal
Cord Stimulator
(US)
Table of
Contents
Executive
Summary
Portfolio
Highlights
Sustainability Appendix
Guidance &
Assumptions
Financial
Highlights
FY24
Recap
| Q4 FY24 Earnings Presentation | May 23, 20247

21%
CPV | $660M
+4.6% Y/Y Rep
+5.7% Y/Y Org
$3,130M
-5.2% Y/Y Rep
+4.0% Y/Y Org
28%
SHA | $883M
-20.1% Y/Y Rep
+5.8% Y/Y Org
51%
CRHF | $1,587M
+1.3% Y/Y Rep
+2.2% Y/Y Org
• Cardiac Pacing Therapies: HSD growth; low-20s WW Micra growth driven by Micra
AV2 and VR2 in US & EU; low-40s WW SelectSure
3830 lead growth, only lead
approved for conduction system pacing in US
• Defibrillation Solutions: LSD growth; Aurora EV-ICD LMR underway in US & EU
• CAS: Low-20s sequential WW & US growth driven by PulseSelect ; PFA more than
offsetting cryo declines; SPHERE Per-AF pivotal data presented at HRS 2024 and
published in Nature Medicine, showing Sphere-9
is as safe and effective and more
efficient than traditional focal RF treatment; Affera
mapping and focal ablation system
submitted for US approval
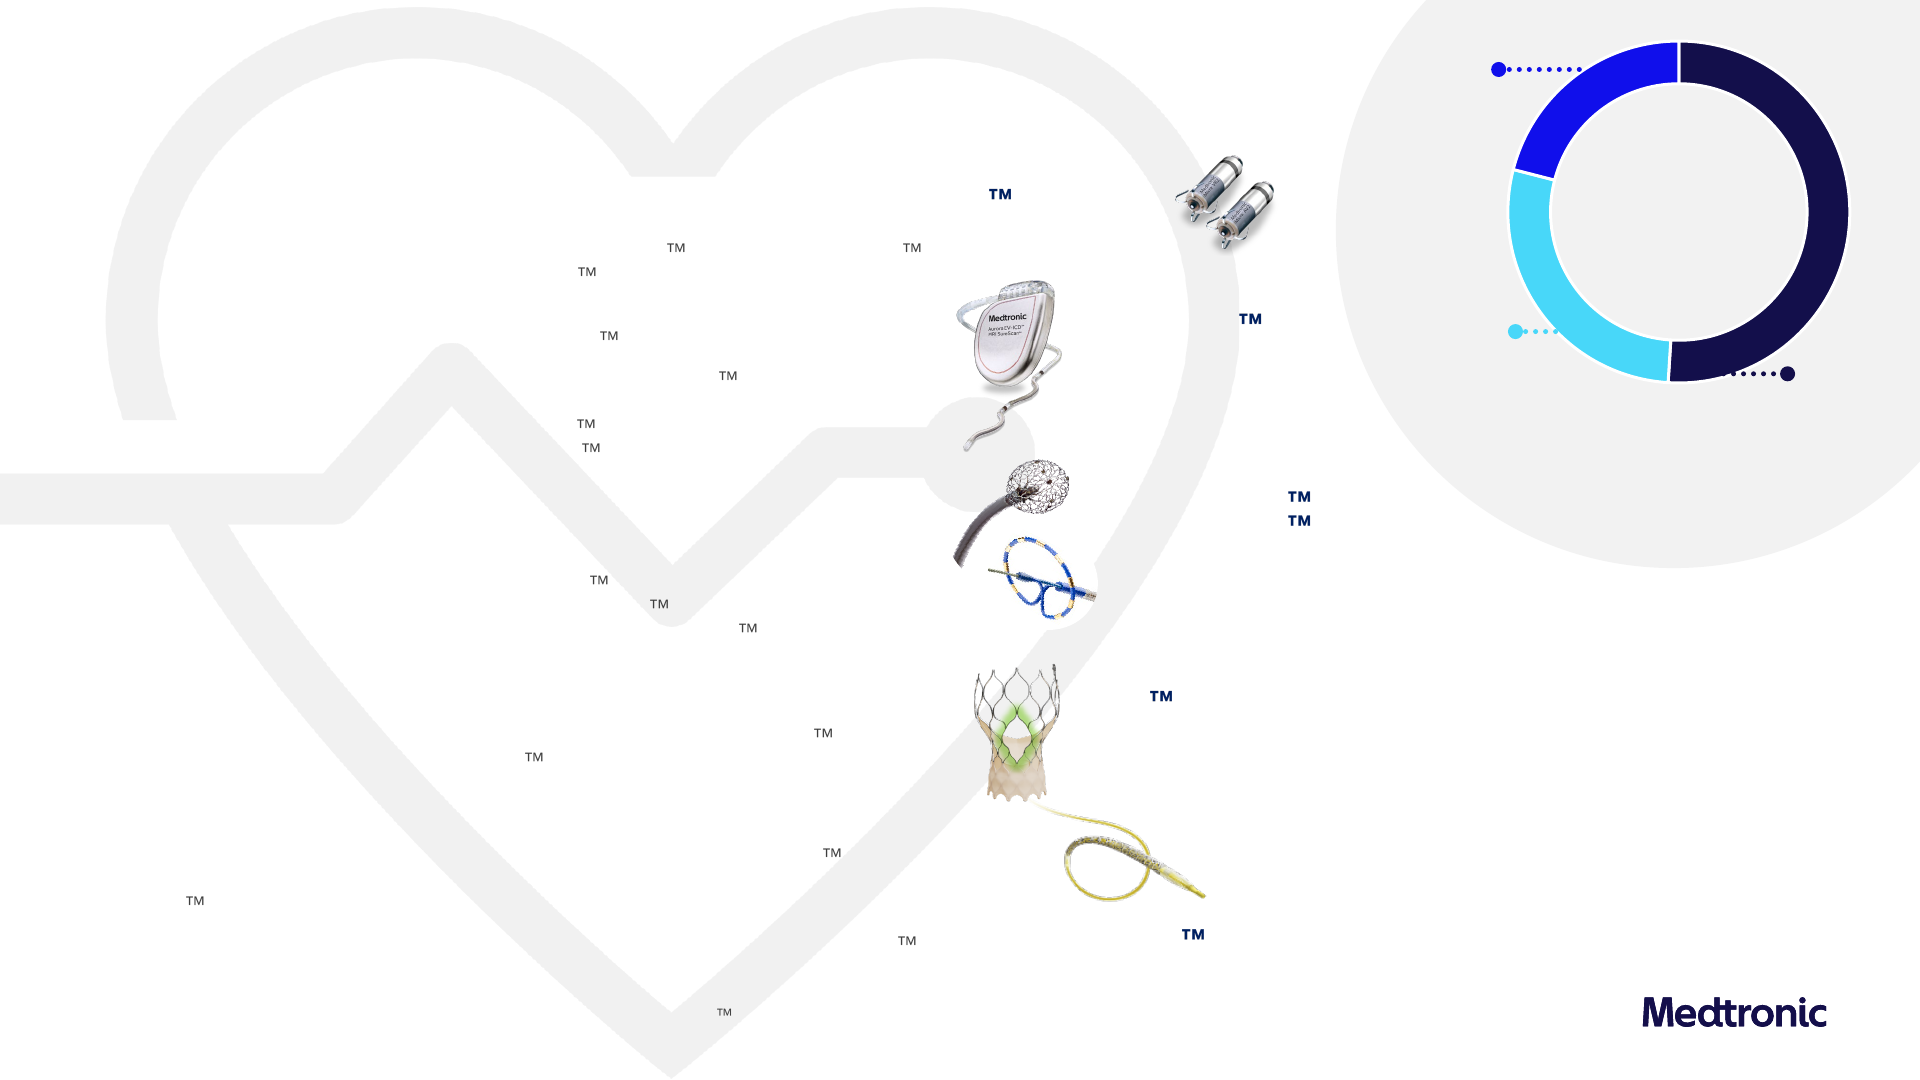
Cardiac Rhythm & Heart Failure (CRHF)
MSD growth driven by strong performance in Pacing, Structural Heart, and Cardiac Surgery
Cardiovascular
• Coronary & Renal Denervation: Y/Y DES share gains driven by Onyx Frontier adoption;
mid-teens growth in guide catheters and low-double digit growth in balloons; Symplicity
Spyral
system for hypertension received NMPA approval in China
• Peripheral Vascular Health: Mid-teens growth in DCBs driven by strength of IN.PACT 018
DCB; Mid-teens growth in vascular embolization offset by MSD declines in atherectomy
Micra AV2 and VR2
Transcatheter
Pacing System
Aurora EV-ICD
System
Evolut FX+
TAVR System
Operating Unit Growth
Cardiac Rhythm Management
LSD
Cardiac Ablation Solutions
MSD
Structural Heart & Aortic
MSD
Cardiac Surgery
HSD
Coronary & Renal Denervation
MSD
Peripheral Vascular Health
MSD
• Structural Heart: HSD WW growth driven by Evolut FX adoption; SMART Trial data
presented at ACC and published in NEJM showed Evolut
TAVR superior valve
performance and non-inferior clinical outcomes at one-year; Evolut
FX+ received US
FDA approval and launching in August 2024
• Aortic: LSD growth driven by TAA growth
• Cardiac Surgery: HSD growth driven by broad portfolio strength; Penditure LAA Clip
US launch underway; Next-gen Avalus Ultra
aortic tissue valve launched in US
Structural Heart & Aortic (SHA)
Coronary and Peripheral Vascular (CPV)
Affera Sphere9
and PulseSelect
Pulse Field Ablation
(PFA) Catheters
Onyx Frontier
DES
Affera is not commercially available in the US
| Q4 FY24 Earnings Presentation | May 23, 20249
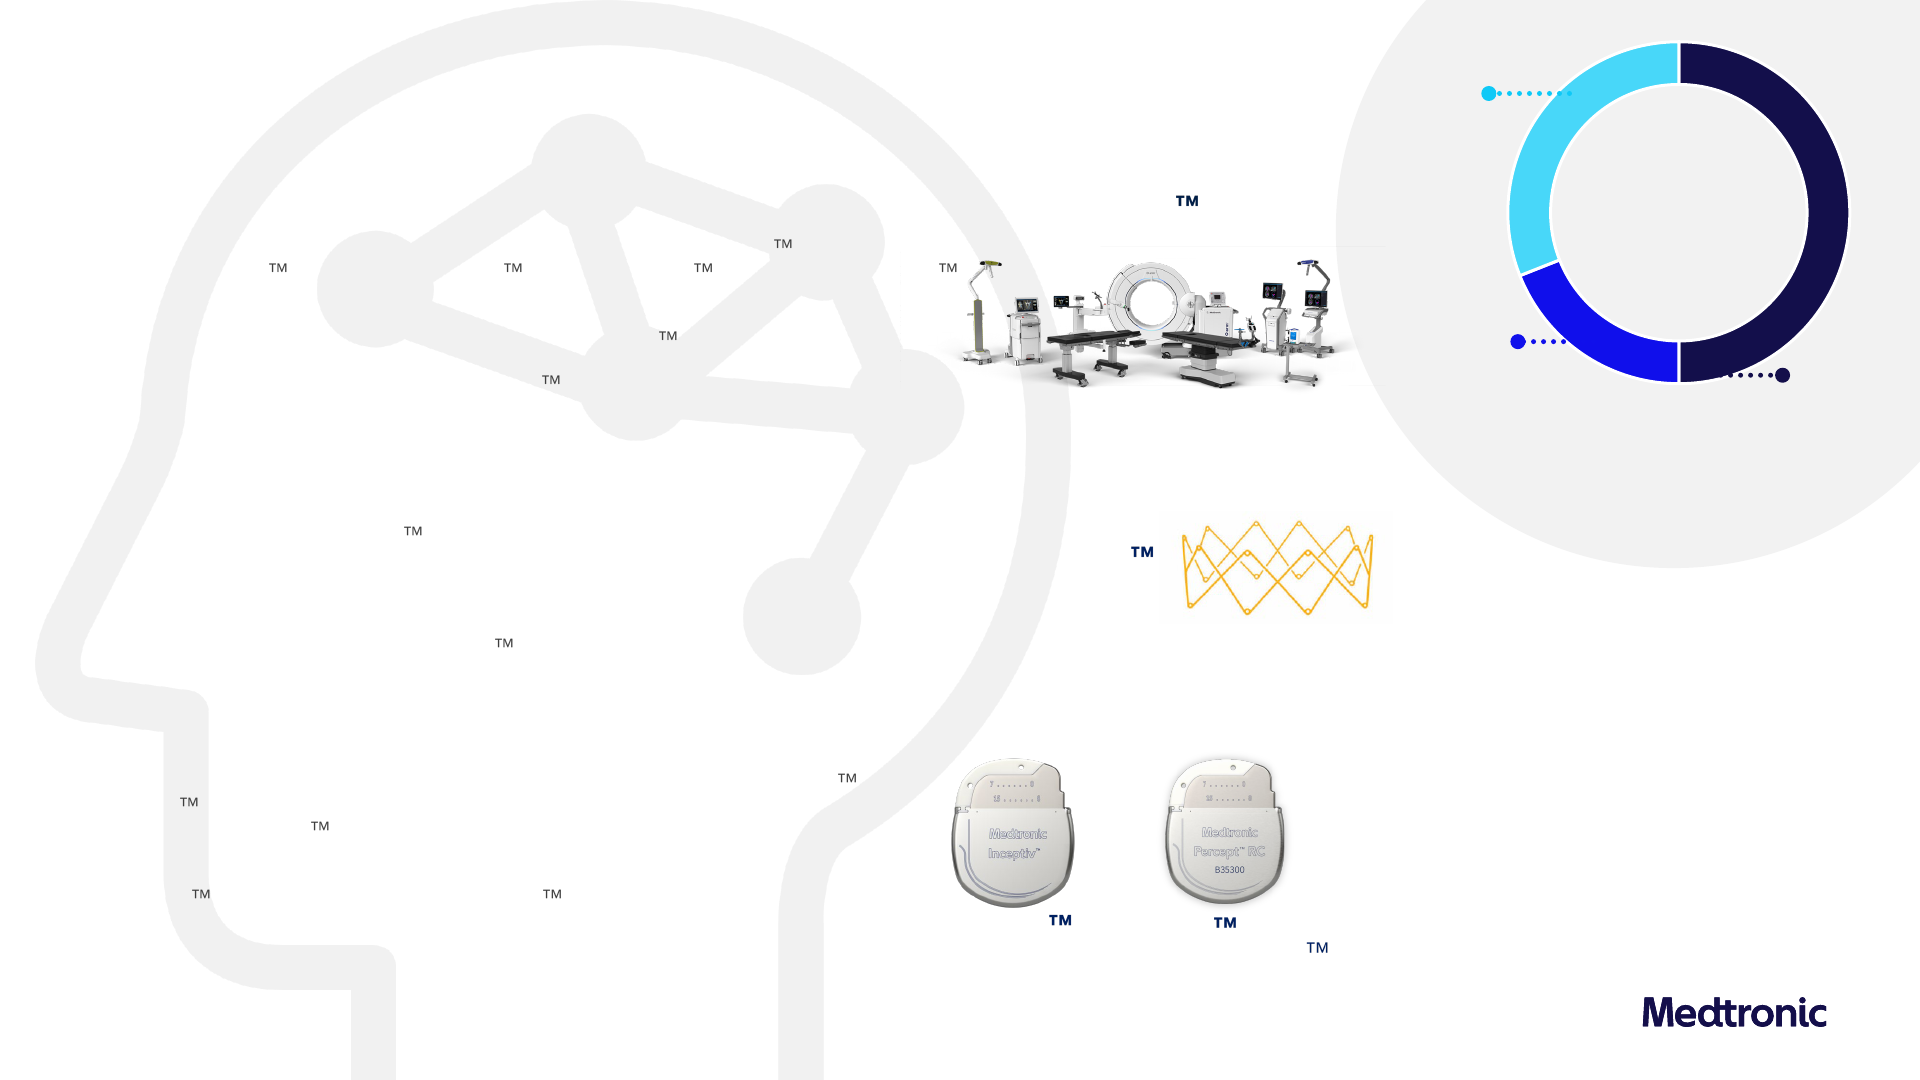
Neuromodulation (NM)
Cranial & Spinal Technologies (CST)
• Spinal Cord Stimulation: LSD WW and US growth driven by differentiated DTM on
Intellis
platform; HSD trialing and LSD new implant growth in US; Received US FDA
approval for Inceptiv
closed-loop spinal cord stimulator
• Brain Modulation: LDD WW growth driven by mid-teens new implant growth of our
Percept
RC neurostimulator with BrainSense technology
6.5% growth benefitting from strength in Spine and Neurosurgery
Neuroscience
31%
ST | $778M
+2.0% Y/Y Rep
+3.1% Y/Y Org
19%
NM | $475M
+5.8% Y/Y Rep
+6.0% Y/Y Org
Specialty Therapies (ST)
• Neurovascular: LSD growth ex-China, with continued DD growth in flow diversion on strong
adoption of Shield Technology
• Ear, Nose & Throat: Growth driven by strong power capital and disposable sales and localized
drug delivery sinus implants
• Pelvic Health: Growth driven by InterStim X
• Neurosurgery: DD WW, US and WE growth; strong DD growth of AiBLE ecosystem
including Mazor
robotics, StealthStation navigation, O-arm imaging, and Midas Rex
powered surgical instruments
• Core Spine: MSD WW and HSD US growth driven by AiBLE ecosystem
• Biologics: HSD growth driven by strong Infuse bone graft performance
51%
CST | $1,291M
+7.8% Y/Y Rep
+8.7% Y/Y Org
Operating Unit Growth
Cranial & Spinal Technologies
HSD
Neurovascular
LSD
ENT
HSD
Pelvic Health
MSD
Neuromodulation
MSD
AiBLE
Surgical Ecosystem
Inceptiv
Rechargeable
Closed-Loop SCS
PROPEL
Sinus Implant
Percept RC DBS
with BrainSense
Technology
$2,545M
+5.6% Y/Y Rep
+6.5% Y/Y Org
| Q4 FY24 Earnings Presentation | May 23, 202410
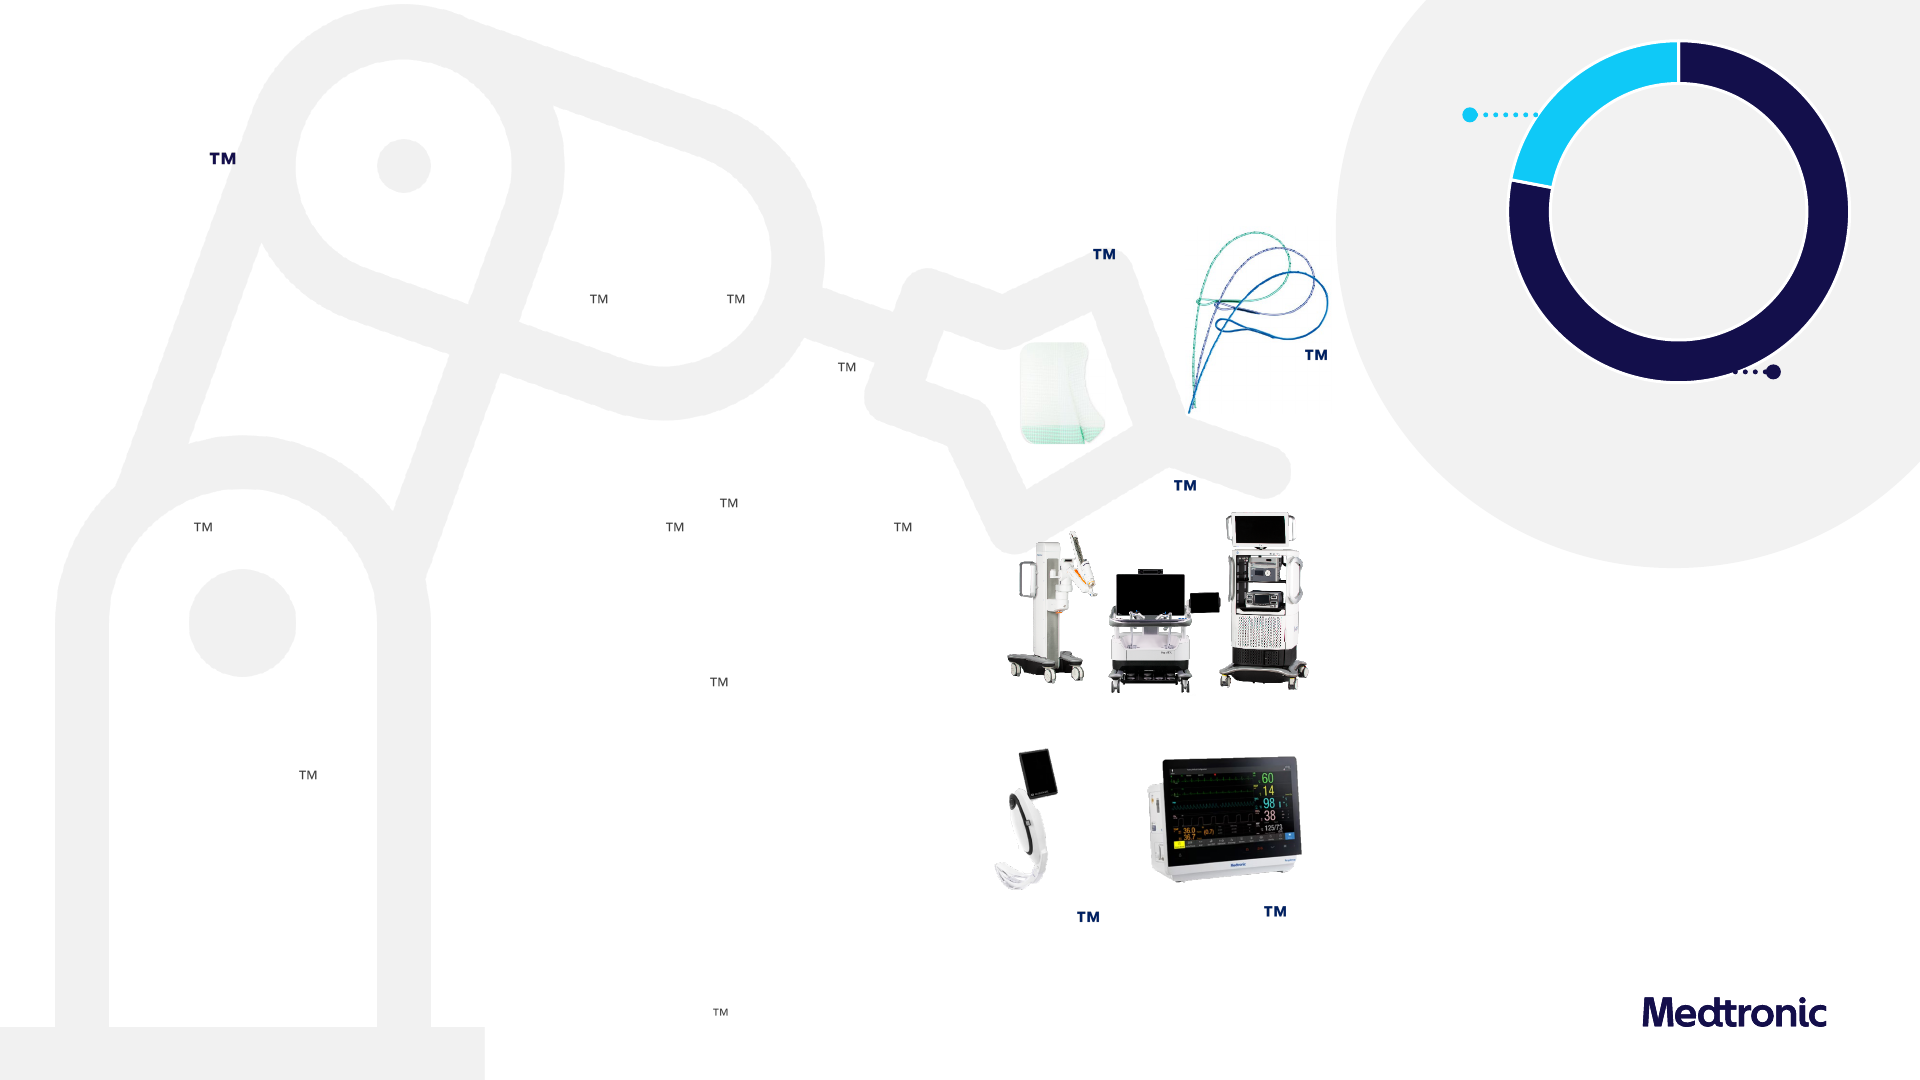
Surgical & Endoscopy
(SE)
4.5% growth driven by General Surgical & Endoscopy; Continued progress on
US Hugo
IDE trials
Medical Surgical
22%
ACM | $492M
+1.2% Y/Y Rep
+2.5% Y/Y Org
Acute Care & Monitoring (ACM)
• Blood Oxygen Management: LSD growth driven by MSD Nellcor pulse oximetry sensor
and monitor growth; picked up 100 bps of share this quarter driven by our clinically-
superior technology and account wins over the past 12 months
• Airways: McGRATH MAC video laryngoscope grew mid-teens on strong adoption
• Surgical driven by DD EM growth; comprises about a quarter of revenue
• General Surgical: WW MSD growth driven by V-Loc and ProGrip Synthetic Mesh,
which reduces the need for fixation and used in robotic cases given ease of use
• Advanced Surgical: WW LSD growth driven by Advanced Energy and LigaSure growth,
partly offset by declines in Advanced Stapling given declines in US bariatric procedures
• Robotics: Started enrollment in Hernia and GYN indication studies; installed base
expansion OUS continues; Expand URO US trial nearing completion
• Endoscopy: Growth driven by strong market adoption of Endoflip 300 system and
Emprint
ablation system; announced launch of ColonPRO software for GI Genius ,
an enhanced polyp detection algorithm incorporating new procedural highlights feature
78%
SE | $1,705M
+4.1% Y/Y Rep
+5.0% Y/Y Org
Operating Unit Growth
Surgical
MSD
Endoscopy
HSD
Acute Care & Monitoring
LSD
Hugo
RAS System
RespArray
Patient Monitor
McGRATH
MAC Video
Laryngoscope
Hugo is not commercially available in the US
V-Loc
Barbed Sutures
ProGrip
Self-Fixating
Mesh
$2,198M
+3.5% Y/Y Rep
+4.5% Y/Y Org
| Q4 FY24 Earnings Presentation | May 23, 202411
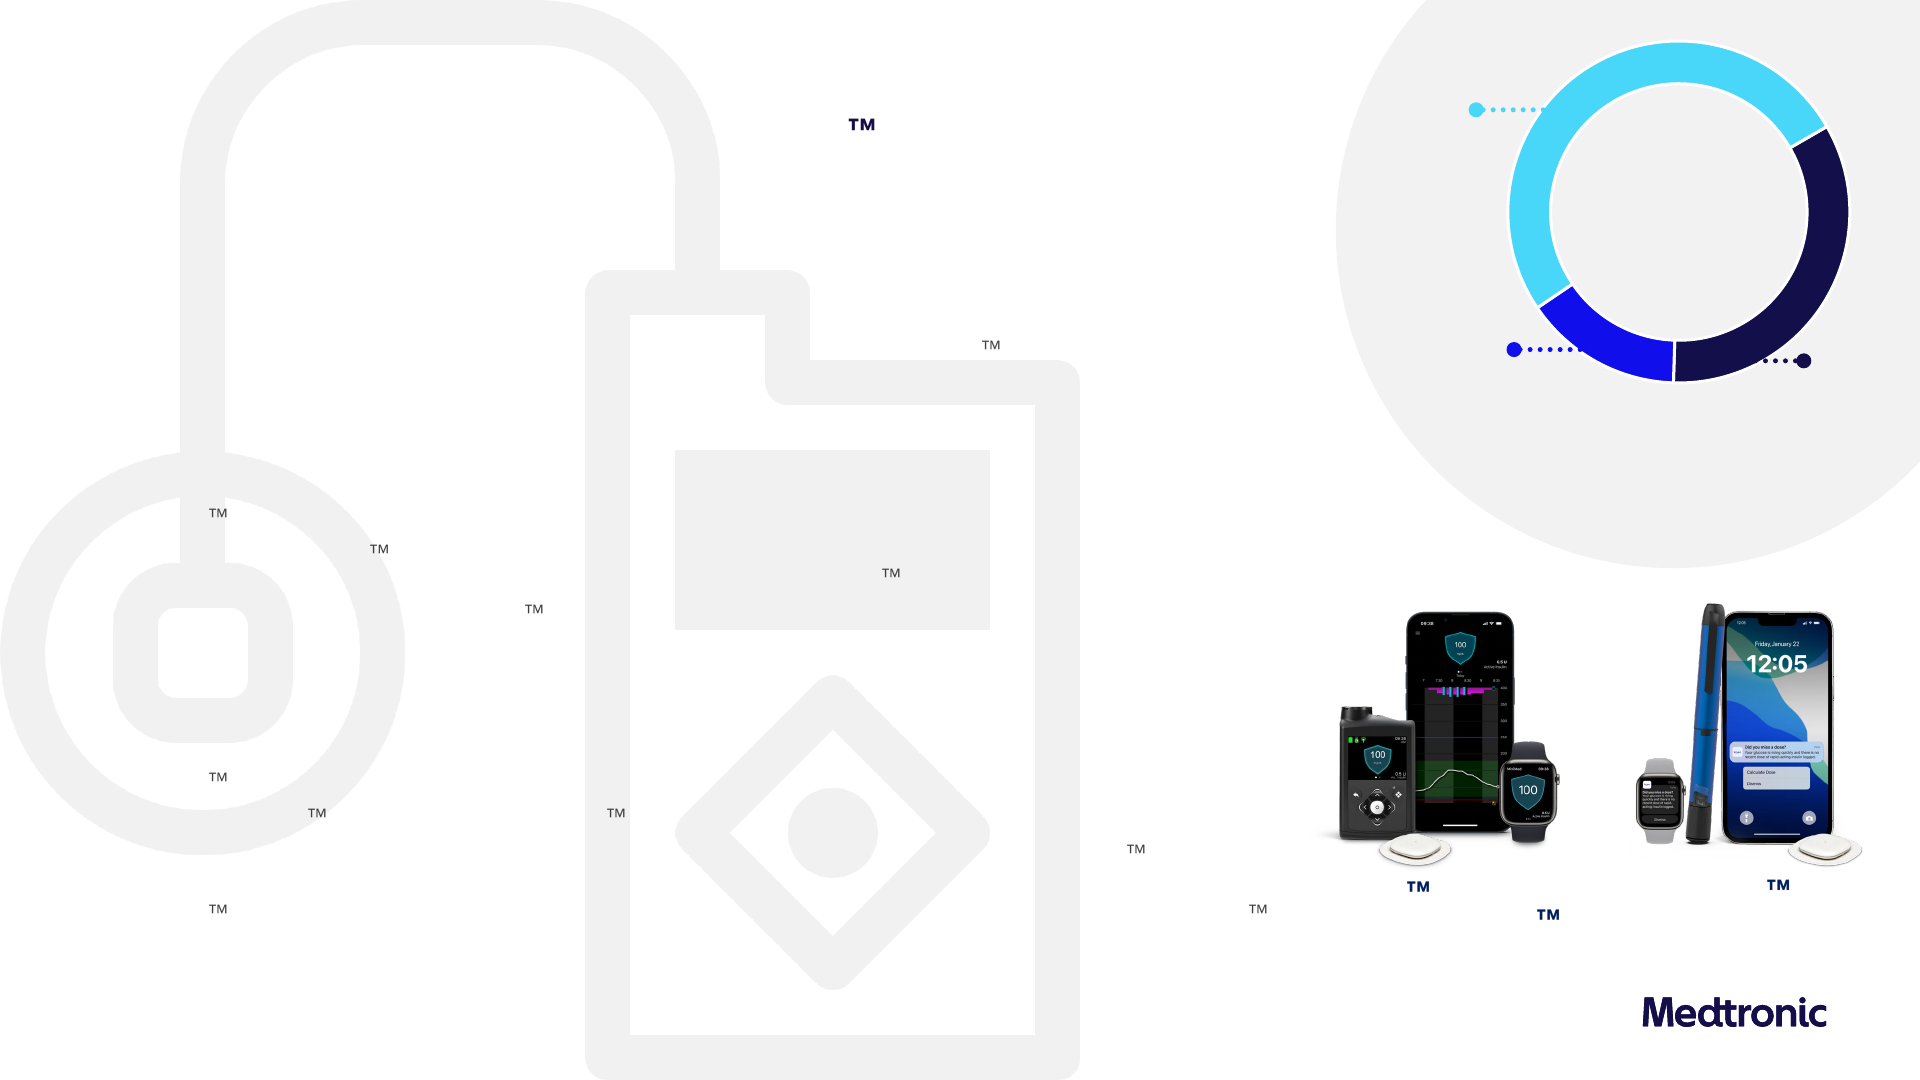
Double-digit US and OUS growth on adoption of MiniMed 780G system
Diabetes
United States
High-40s pump growth led by strong new user adoption and CGM sales growth
– More than doubled new user growth Y/Y; continued strong growth in both MDI users and competitive switchers
– High-teens CGM growth Y/Y; continued growth in CGM attachment rates
– In latest dQ&A data, pump Net Promoter Score increased 15-points from strength of MiniMed 780G system algorithm and
ability to reduce ‘time and effort’ with managing diabetes
1
International
Consistent double-digit growth driven by strong performance in CGM and other consumables given growth in our install base
– MiniMed 780G system remains most widely used AID system in Western Europe
– Limited launch of Simplera Sync in 5 countries with phased commercial launch this summer; customer and HCP feedback
emphasizes ease of insertion, adding to the existing high satisfaction with MiniMed
780G system
– Expanding Smart MDI market with Simplera and InPen Smart MDI launched in 16 EU countries; Majority of customers
leveraging full system to benefit from insulin tracking and dose recommendations
Pipeline
Advancing next-gen pipeline to offer the largest portfolio of diabetes solutions
– MiniMed 780G AID system recognized among Fast Company’s 2024 World Changing Ideas
– Submitted Simplera Sync for use with the MiniMed 780G system (ages 7+) to the US FDA
– Planning US FDA and CE mark labeling expansions for pregnancy, T2, pediatrics (2+), biosimilars for MiniMed 780G
– US data at ATTD demonstrating early success, including average time-in-range (TIR) 80% with recommended settings with the
MiniMed
780G system; adding to our growing body of real-world evidence that demonstrates superiority of the MiniMed
780G system with recommended settings offering the best average TIR and lowest time-above-range (TAR) among FDA-
approved AID systems
3
15%
Emerging
Markets
51%
Non-US
Developed
34 %
US
$660M
+10.9% Y/Y Rep
+11.1% Y/Y Org
Simplera Smart
MDI System
1) dQ&A Q1 2024 US Pump Patient Survey (n=2,014)
2) Time In Range using recommended settings as shown in real-world evidence for MM780G system (n=5,762)
3) Among all published data; does not represent head-to-head comparison
MiniMed 780G system
with Simplera Sync
Global real-world data
achieves ~80% TIR
2
| Q4 FY24 Earnings Presentation | May 23, 202412

FY24 Highlights
Free cash flow
2
YTD
$5.20
GAAP
Diluted EPS
Y/Y %
CC Y/Y %
$2.76
(1.7%)(2.1%)
+4.5%N/A
$5.2B
Non-GAAP
Cash flow from
operations YTD
$6.8B
Delivering on commitments; meaningful step forward in FY24
– MSD revenue growth every quarter; 5.2% organic growth for the year; 1pt above mid-
point of initial guide
– Delivered EPS $0.15 above mid-point of initial guide
Advanced product pipeline and clinical evidence
Received ~130 regulatory approvals with product launches expected to contribute
meaningfully to long-term growth
– Meaningful product approvals including Aurora EV-ICD , Affera Sphere-9 and
PulseSelect
pulsed field ablation systems, Nitron CryoConsole system, Percept
RC featuring BrainSense
technology, Inceptiv closed-loop spinal cord stimulator,
MiniMed
780G System+Simplera Sync CGM, and Symplicity Spyral RDN system
– Building upon our clinical body of evidence, including our SMART trial & 4-year low
risk data in TAVR, and FIH 1-year Sphere-360 results in PFA
R&D spend of $2.7B with operating committee allocating disproportionate funds to
highest growth market opportunities
Comprehensive transformation taking hold and seeing results
– Made and continue to make necessary enhancements to operations and quality
systems to make the company even more resilient; Global workforce continues to
embrace and instill performance-driven culture
– Announced exit of increasingly unprofitable ventilator product line
Generated significant FCF and return to shareholders
– FCF of $5.2B, +14% y/y driven by improvements in working capital
– Total return to shareholders of $5.5B, including $1.9B of net share repurchases
– Dividend increased to $0.70 per share quarterly; 47th consecutive year of increases
Revenue
1
by segment
Medical Surgical
$8,417M
+5.4% Y/Y Rep
+4.7% Y/Y Org
Diabetes
$2,488M
+10.0% Y/Y Rep
+8.6% Y/Y Org
Total MDT
$32,364M
+3.6% Y/Y Rep
Cardiovascular
$11,831M
+2.7% Y/Y Rep
+5.0% Y/Y Org
Neuroscience
$9,406M
+5.0% Y/Y Rep
+5.2% Y/Y Org
+5.2% Y/Y Org
Other
$221M
(55.4%) Y/Y Rep
Table of
Contents
Executive
Summary
Portfolio
Highlights
Sustainability Appendix
Guidance &
Assumptions
Financial
Highlights
FY24
Recap
1) Data has been intentionally rounded to the nearest million and, therefore, may not sum.
2) Operating cash flows less property, plant, and equipment additions.
| Q4 FY24 Earnings Presentation | May 23, 202414
Emerging Markets
$5,823M
+6.9% Y/Y Rep
+10.1% Y/Y Org
Non-US Developed
$9,979M
+6.1% Y/Y Rep
+6.0% Y/Y Org
United States
$16,562M
+1.2% Y/Y Rep
+3.2% Y/Y Org
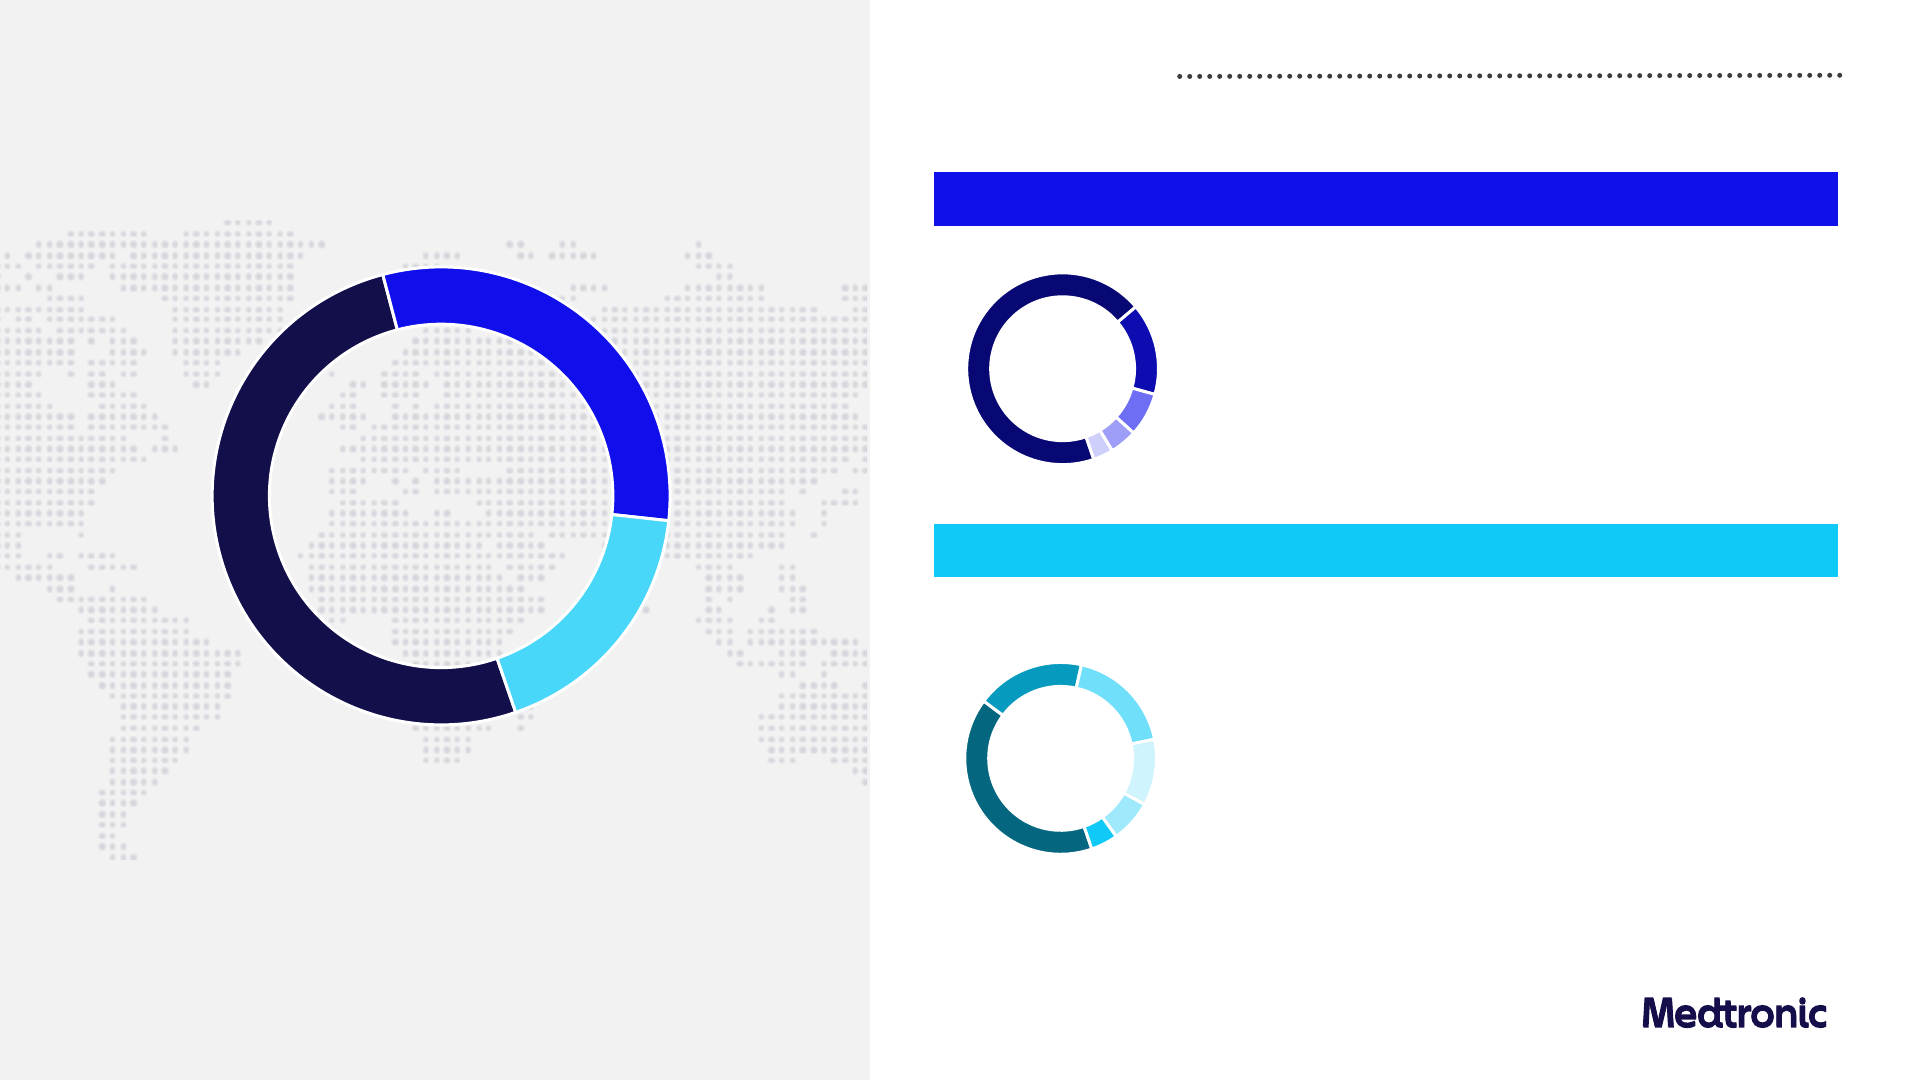
FY24 Financial summary
Revenue
1
by geography
Non-US Developed 6.0%
Emerging Markets 10.1%
Western Europe
HSD
Japan
MSD
Australia & New Zealand
MSD
Canada
LSD
South Korea
MSD
China
HSD
Middle East & Africa
High-teens
Latin America
LDD
Southeast Asia
LDD
Eastern Europe
MSD
South Asia
Low-20’s
WE
~70%
JPN
~15%
ANZ
<10%
S. Korea
<10%
Canada
<10%
China
~40%
MEA
~20%
LatAm
~20%
EE
<10%
SEA
<10%
SA
<10%
$9,979M
$5,823M
Table of
Contents
Executive
Summary
Portfolio
Highlights
Sustainability Appendix
Guidance &
Assumptions
Financial
Highlights
FY24
Recap
1) Data has been intentionally rounded to the nearest million and, therefore, may not sum
| Q4 FY24 Earnings Presentation | May 23, 202415


Q4 FY24 Income statement
($ in millions) Q4 FY23 Q4 FY24 Y/Y
Revenue
$8,544 $8,589 0.5%
Gross Margin
65.1% 64.6% (50 bps)
SG&A
% of Sales
30.6% 32.2% +160 bps
R&D
% of Sales
7.5% 7.9% +40 bps
Operating Margin
18.3% 12.3% (600 bps)
Net Income
$1,179 $654 (44.5%)
Diluted EPS
$0.88 $0.49 (44.3%)
GAAP
1
Non-GAAP
1
($ in millions) Q4 FY23 Q4 FY24 Y/Y
Revenue
$8,544 $8,589 0.5%
Gross Margin
65.9% 65.8% (10 bps)
SG&A
% of Sales
29.7% 31.8% +210 bps
R&D
% of Sales
7.3% 7.8% +50 bps
Operating Margin
29.4% 26.9% (250 bps)
Net Income
$2,091 $1,929 (7.7%)
Diluted EPS
$1.57 $1.46 (7.0%)
Full
GAAP to
non-GAAP
reconciliation
in Appendix
1) The data in this table has been intentionally rounded and, therefore, may not sum; Dollars in millions except for EPS.
Table of
Contents
Executive
Summary
Portfolio
Highlights
Sustainability Appendix
Guidance &
Assumptions
Financial
Highlights
FY24
Recap
| Q4 FY24 Earnings Presentation | May 23, 202417

FY24 Income statement
($ in millions) FY23 FY24 Y/Y
Revenue
$31,227 $32,364 3.6%
Gross Margin
65.7% 65.3% (40 bps)
SG&A
% of Sales
33.4% 33.2% (20 bps)
R&D
% of Sales
8.6% 8.5% (10 bps)
Operating Margin
17.6% 15.9% (170 bps)
Net Income
$3,758 $3,676 (2.2%)
Diluted EPS
$2.82 $2.76 (2.1%)
GAAP
1
Non-GAAP
1
($ in millions) FY23 FY24 Y/Y
Revenue
$31,227 $32,364 3.6%
Gross Margin
66.5% 66.1% (40 bps)
SG&A
% of Sales
32.6% 32.6% Flat
R&D
% of Sales
8.4% 8.3% (10 bps)
Operating Margin
26.6% 25.6% (100 bps)
Net Income
$7,045 $6,918 (1.8%)
Diluted EPS
$5.29 $5.20 (1.7%)
Full
GAAP to
non-GAAP
reconciliation
in Appendix
1) The data in this table has been intentionally rounded and, therefore, may not sum; Dollars in millions except for EPS.
Table of
Contents
Executive
Summary
Portfolio
Highlights
Sustainability Appendix
Guidance &
Assumptions
Financial
Highlights
FY24
Recap
| Q4 FY24 Earnings Presentation | May 23, 202418

Free Cash Flow
Included in
Free Cash Flow:
($ in billions)
FY23 FY24
Certain Litigation Payments, net
1,2
$0.0 $0.2
Restructuring Payments
1
$0.4 $0.5
Other Payments
1,3
$0.4 $0.4
Puerto Rico IRS Pre-Payment
$0.3 $0.2
Certain Other Tax Payments
$0.5 $0.4
Pre-Tax
Discipline in working capital delivering improved free cash flow
Table of
Contents
Executive
Summary
Portfolio
Highlights
Sustainability Appendix
Guidance &
Assumptions
Financial
Highlights
FY24
Recap
*Operating cash flows less property, plant, and equipment additions
1 Cash flow impact does not reflect associated tax cost / benefit, as timing and amount are difficult to estimate
2 Includes payments accrued as “Non-GAAP” charges
3 Includes acquisition-related, divestiture-related, charges associated with the exit of a business, European Union medical
device regulation charges, and contributions to the Medtronic Foundation
$4.6B
$5.2B
FY23 FY24
Free Cash Flow*
+14%
| Q4 FY24 Earnings Presentation | May 23, 202419

FY25
REVENUE
FY24 base
Organic
revenue growth
guidance
FX
2
Inorganic Other
1
Implied
reported
revenue range
FY24 reported
$32,364M
4.0% to 5.0%
($375M) to
($275M)
$0 ~$80M
~$33.1B to
$33.6B
Less Other
2
($221M)
FY24 base
$32,143M
Guidance and assumptions
FY25
EPS
FY24
base
Implied constant
currency growth
FX
2
FY25 EPS
guidance
$5.20 +9% to +11% ~(5%) $5.40 to $5.50
Table of
Contents
Executive
Summary
Portfolio
Highlights
Sustainability Appendix
Guidance &
Assumptions
Financial
Highlights
FY24
Recap
Note: EPS guidance does not include any charges or gains that would be reported as non-GAAP adjustments to earnings during
the fiscal year
1) Other includes Mozarc Medical Manufacturing & Servicing Agreements, Cardinal Health Manufacturing Agreements &
Ventilation Service Solutions
2) While FX rates are fluid, assumptions above are based on rates as of the beginning of May 2024
| Q4 FY24 Earnings Presentation | May 23, 202421

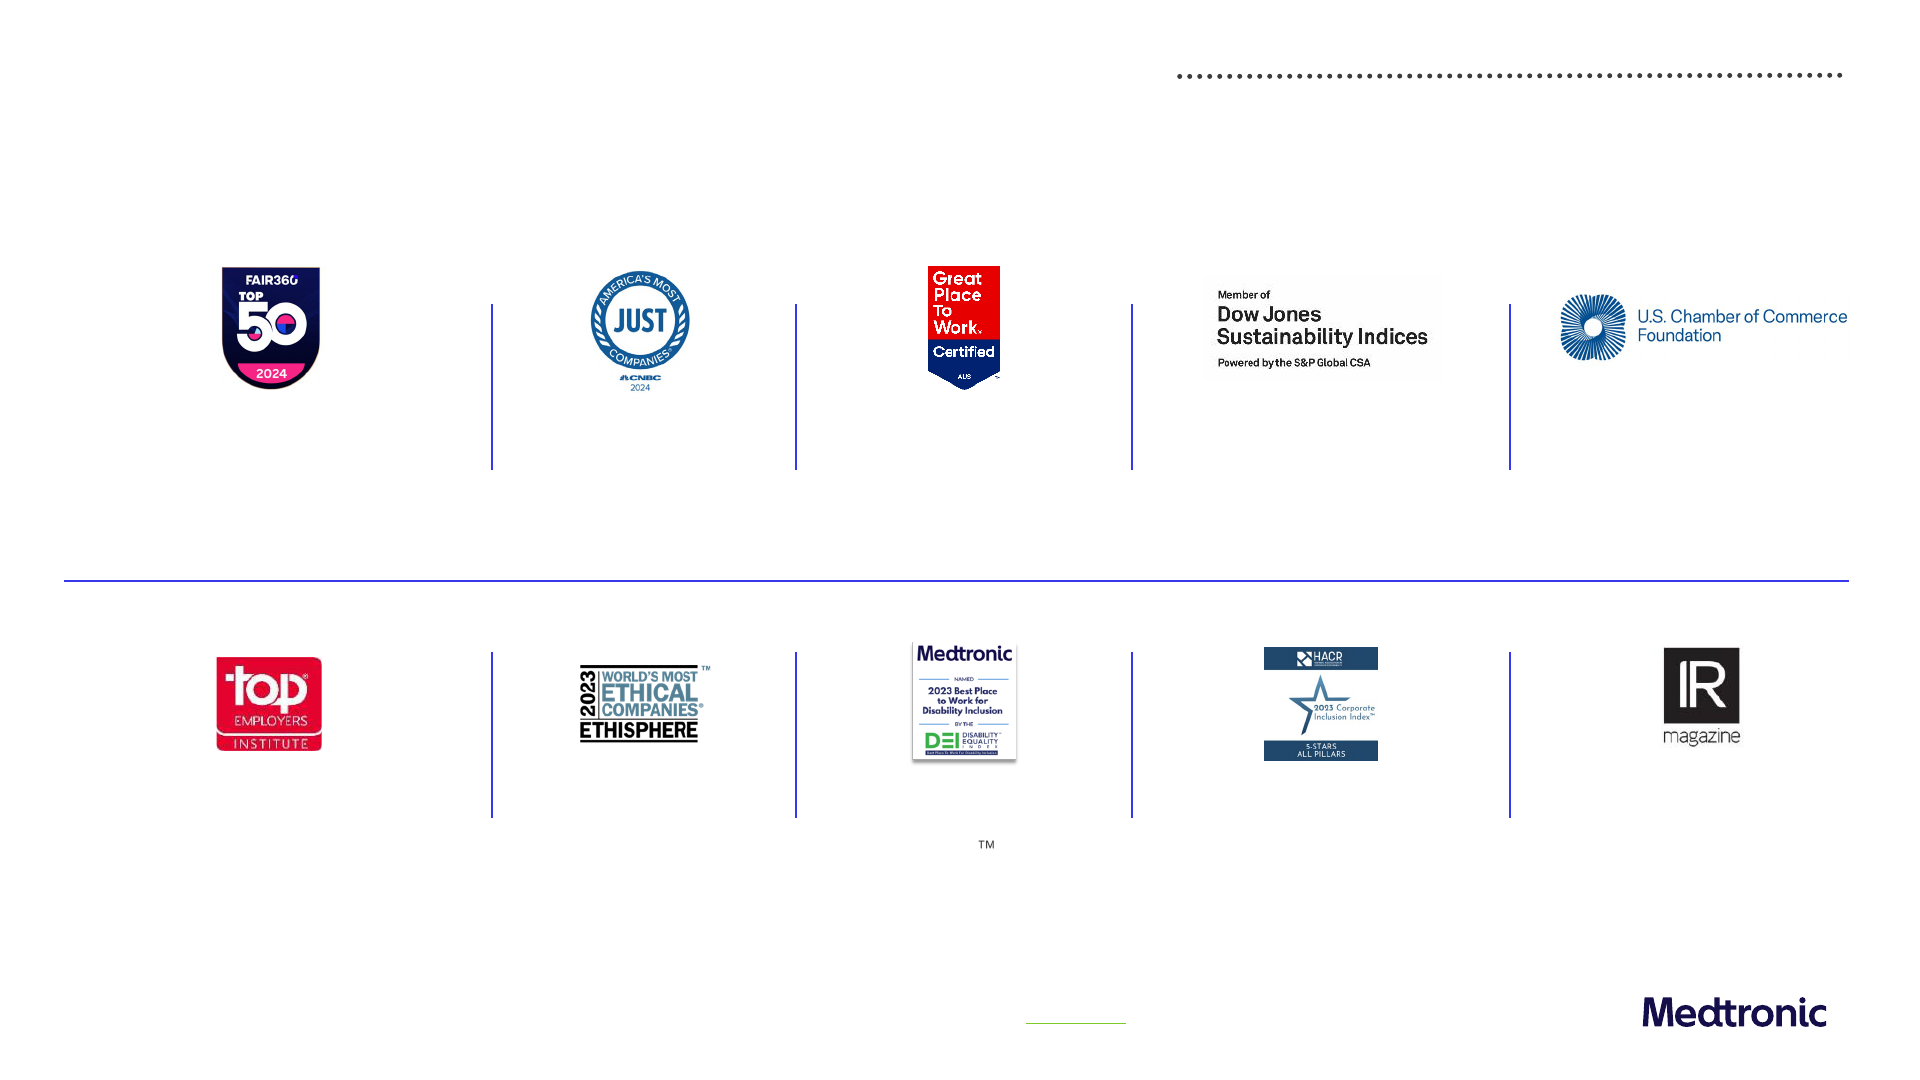
Leading in engagement, citizenship & innovation
To learn more, visit our awards page
2023 Hispanic Association on
Corporate Responsibility
5-star awards across all 4 pillars —
Employment, Philanthropy, Procurement,
& Governance — 2
nd
consecutive year
2023 Disability:IN and the American
Association of People with
Disabilities Disability Equality Index®
Best Places to Work — 100% Score
6
th
consecutive year with top score
Ethisphere
One of the 2023 Worlds Most
Ethical Companies®
Top Employers Institute certified
Awarded to Medtronic in the U.K., Egypt,
South Africa, and 6 other countries
IR Magazine
2024 Best Investor Targeting
strategy; Finalist for Best IR
in Healthcare
Great Place to Work ® certified
awarded to Medtronic in Australia,
Greater China, Spain, and 20 other
countries
Just Capital
One of America’s Most JUST
Companies in 2024
Fair360
#2 in Fair360 Top 50
for the 3
rd
consecutive year in the top 10
Dow Jones Sustainability Index
DJSI World Index for 2 consecutive years
DJSI North American Index for 15
consecutive years
US Chamber of Commerce Foundation
Best Corporate Citizens Awards
Named Best Corporate Steward
- Large Business
Table of
Contents
Executive
Summary
Portfolio
Highlights
Sustainability Appendix
Guidance &
Assumptions
Financial
Highlights
FY24
Recap
| Q4 FY24 Earnings Presentation | May 23, 202423
Near and long-term sustainability objectives
Robust governance structures and processes underpin our sustainability strategy
Sustainability targets and progress
Baseline End date FY23 status
Climate
stewardship
Reduce greenhouse gas emissions intensity by 50% FY20 FY25 35%
Reduce energy intensity by 20% FY20 FY25 6%
Source 50% of energy from renewable and alternative sources FY20 FY25 31%
1
Reduce water usage intensity by 15% FY20 FY25 9%
Reduce waste intensity by 15% FY20 FY25 17%
Become carbon neutral in our operations (scope 1 and 2) N/A FY30 On track
Reach net-zero emissions N/A FY45 On track
Product
stewardship
Reduce packaging waste by 25% for four
2
targeted high-volume product families
3
FY21 FY25 7%
Minimize impact of instructions for use (IFU) through a 35% paper reduction FY21 FY27 1%
Publish partial life cycle assessments (LCA) for 100% of products and full LCAs for 50% of products N/A FY30 New in FY23
Convert 50% of eligible product codes to electronic IFUs within applicable regions N/A FY30 New in FY23
Integrate circularity and eco-design criteria into the New Product Development process N/A FY30 New in FY23
Achieve one of the following for 95% of eligible plastic packaging: is industrially recyclable,
contains postindustrial recycled content, demonstrates optimized design
N/A FY30 New in FY23
Reduce packaging for 20 additional high-volume products for a total of 50% reduction N/A FY30 New in FY23
Access and
Innovation
Flow 20% of revenue from products released in the prior 36 months (vitality index) N/A FY25 16%
Serve 79 million patients annually through strategies that increase healthcare access
4
N/A FY25 74 million +
Product quality
Reduce aggregate product complaint rate by 10% for identified product families
5
FY20 FY25 39%
ID&E
Reach 45% representation of women in manager-and-above roles globally through focus on
effective practices
N/A FY26 43%
Reach 30% representation of ethnically diverse groups in manager-and-above roles in the US
through focus on effective practices
N/A FY26 28%
Increase spend with US diverse-owned suppliers by 5% Y/Y through FY26 through focus on effective
practices
FY22 FY23 37%
FY30
Carbon neutral
in Operations
(scope 1 and 2)
FY45
Net-zero
emissions
1) Annual progress is cumulative and represented as the growth in sourcing over the FY20 baseline year. Value includes purchases
renewable electricity credits.
2) Four product families include: Tri-staple, Polysorb, Absorbatack, Spinal Implants
3) High-volume product families identified based on weight, material selection, and sourcing
4) Target was adjusted in FY23 after announcement of plans to divest the PMRI businesses
5) For more information see page 17 of the FY23 Sustainability Report found on the Medtronic Investor Relations website
Table of
Contents
Executive
Summary
Portfolio
Highlights
Sustainability Appendix
Guidance &
Assumptions
Financial
Highlights
FY24
Recap
| Q4 FY24 Earnings Presentation | May 23, 202424


Q4 FY24 Revenue by portfolio and geography
Worldwide US Non-US Developed Emerging Markets
Revenue
($M)
1
As reported
Y/Y%
Organic
Y/Y%
Revenue
($M)
1
As reported
Y/Y%
Organic
Y/Y%
Revenue
($M)
1
As reported
Y/Y%
Organic
Y/Y%
Revenue
($M)
1
As reported
Y/Y%
Organic
Y/Y%
Cardiovascular
3,130 -5.2% 4.0% 1,448 -16.6% -1.6% 1,039 2.8% 4.1% 643 16.1% 18.8%
Cardiac Rhythm & Heart Failure
1,587 1.3% 2.2%
Structural Heart & Aortic
883 -20.1% 5.8%
Coronary & Peripheral Vascular
660 4.6% 5.7%
Neuroscience
2,545 5.6% 6.5% 1,692 7.0% 7.0% 482 2.8% 5.1% 371 3.1% 5.8%
Cranial & Spinal Technologies
1,291 7.8% 8.7%
Specialty Therapies
778 2.0% 3.1%
Neuromodulation
475 5.8% 6.0%
Medical Surgical
2,198 3.5% 4.5% 954 3.8% 3.8% 805 0.8% 2.9% 439 8.4% 9.6%
Surgical & Endoscopy
1,705 4.1% 5.0%
Acute Care & Monitoring
492 1.2% 2.5%
Diabetes
660 10.9% 11.1% 223 12.1% 12.1% 337 7.3% 7.0% 99 20.7% 23.2%
Other
57 -50.0% - 26 -33.3% - 11 -68.6% - 21 -46.2% -
Total Medtronic
8,589 0.5% 5.4% 4,343 -3.0% 3.5% 2,674 1.7% 4.2% 1,572 9.2% 13.1%
1) Data has been intentionally rounded to the nearest million and, therefore, may not sum
Table of
Contents
Executive
Summary
Portfolio
Highlights
Sustainability Appendix
Guidance &
Assumptions
Financial
Highlights
FY24
Recap
| Q4 FY24 Earnings Presentation | May 23, 202426
Q4 FY24 GAAP to non-GAAP reconciliations
E
Q4 FY24
GAAP
Amortization Restructuring
Acquisition and
Divestiture-
Related Items
Certain Litigation
(Gain) / Loss on
Minority
Investment
Medical Device
Regulations
Certain Tax
Adjustments
Q4 FY24
Non-GAAP
Q4 FY23
Non-GAAP
Y/Y Growth /
Change
Net Sales
8,589 - - - - - - - 8,589 8,544 0.5%
Cost of Products Sold
3,044 - (13) (76) - - (21) - 2,934 2,917 0.6%
Gross Margin
64.6% - 0.2% 0.9% - - 0.2% - 65.8% 65.9% (10 bps)
SG&A
2,765 - (28) (6) - - (1) - 2,731 2,535 7.7%
% of Sales
32.2% - (0.3%) (0.1%) - - - - 31.8% 29.7% 210 bps
R&D
675 - - - - - (9) - 666 622 7.1%
% of Sales
7.9% - - - - - (0.1%) - 7.8% 7.3% 50 bps
Other Operating Expense
(Income), Net
477 - - (530) - - - - (52) (42) 23.8%
% of Sales
5.6% - - (6.2%) - - - - (0.6%) (0.5%) 10 bps
Amortization of
Intangible Assets
419 (419) - - - - - - - -
-
Restructuring Charges, Net
112 - (112) - - - - - -
- -
Certain Litigation Charges
44 - - - (44) - - - -
- -
Operating Profit
1,053 419 152 611 44 - 31 -
2,311 2,512 (8.0%)
Operating Margin
12.3% 4.9% 1.8% 7.1% 0.5% - 0.4% - 26.9% 29.4% (250 bps)
Other Non-Operating Income,
Net
(4) - - - - (195) - - (200) (164) 22.0%
Net Income Attributable to
MDT ($M)
654 357 125 515 37 197 27 17 1,929 2,091 (7.7%)
Diluted EPS ($)
(1)
0.49 0.27 0.09 0.39 0.03 0.15 0.02 0.01 1.46 1.57 (7.0%)
1) Data has been intentionally rounded to the nearest million or $0.01 for EPS figures and, therefore, may not sum
Table of
Contents
Executive
Summary
Portfolio
Highlights
Sustainability Appendix
Guidance &
Assumptions
Financial
Highlights
FY24
Recap
| Q4 FY24 Earnings Presentation | May 23, 202427
FY24 Revenue by portfolio and geography
Worldwide US Non-US Developed Emerging Markets
Revenue
($M)
1
As reported
Y/Y%
Organic
Y/Y%
Revenue
($M)
1
As reported
Y/Y%
Organic
Y/Y%
Revenue
($M)
1
As reported
Y/Y%
Organic
Y/Y%
Revenue
($M)
1
As reported
Y/Y%
Organic
Y/Y%
Cardiovascular
11,831 2.7% 5.0% 5,597 -3.4% 1.2% 3,857 8.2% 6.5% 2,377 10.0% 12.3%
Cardiac Rhythm & Heart Failure
5,995 3.7% 3.5%
Structural Heart & Aortic
3,358 -0.1% 8.0%
Coronary & Peripheral Vascular
2,478 4.3% 4.8%
Neuroscience
9,406 5.0% 5.2% 6,305 4.8% 4.8% 1,739 4.9% 4.3% 1,362 6.2% 8.1%
Cranial & Spinal Technologies
4,756 6.9% 7.1%
Specialty Therapies
2,905 3.2% 3.6%
Neuromodulation
1,746 3.1% 2.7%
Medical Surgical
8,417 5.4% 4.7% 3,717 4.7% 4.3% 3,049 4.5% 3.8% 1,650 8.4% 7.5%
Surgical & Endoscopy
6,508 5.8% 5.5%
Acute Care & Monitoring
1,908 3.9% 2.5%
Diabetes
2,488 10.0% 8.6% 852 0.4% 0.4% 1,284 16.1% 12.7% 352 14.7% 16.6%
Other
221 -55.4% - 91 -43.1% - 50 -69.3% - 81 -52.9% -
Total Medtronic
32,364 3.6% 5.2% 16,562 1.2% 3.2% 9,979 6.1% 6.0% 5,823 6.9% 10.1%
1) Data has been intentionally rounded to the nearest million and, therefore, may not sum
Table of
Contents
Executive
Summary
Portfolio
Highlights
Sustainability Appendix
Guidance &
Assumptions
Financial
Highlights
FY24
Recap
| Q4 FY24 Earnings Presentation | May 23, 202428

FY24 GAAP to non-GAAP reconciliations
E
FY24
GAAP
Amortization Restructuring
Acquisition and
Divestiture-
Related Items
Certain Litigation
(Gain) / Loss on
Minority
Investment
Medical Device
Regulations
Certain Tax
Adjustments
FY24
Non-GAAP
FY23
Non-GAAP
Y/Y Growth /
Change
Net Sales
32,364 - - - - - - - 32,364 31,277 3.6%
Cost of Products Sold
11,216 - (55) (100) - - (81) - 10,980 10,469 4.9%
Gross Margin
65.3% - 0.2% 0.3% - - 0.3% - 66.1% 66.5% (40 bps)
SG&A
10,736 - (108) (71) - - (2) - 10,555 10,175 3.7%
% of Sales
33.2% - (0.3%) (0.2%) - - - - 32.6% 32.6% Flat
R&D
2,735 - - - - - (36) - 2,698 2,632 2.5%
% of Sales
8.5% - - - - - (0.1%) - 8.3% 8.4% (10 bps)
Other Operating Expense
(Income), Net
464 - - (606) - - - - (141) (344) (59.0%)
% of Sales
1.4% - - (1.9%) - - - - (0.4%) (1.1%) (70 bps)
Amortization of
Intangible Assets
1,693 (1,693) - - - - - - - -
-
Restructuring Charges, Net
226 - (226) - - - - - -
- -
Certain Litigation Charges
149 - - - (149) - - - -
- -
Operating Profit
5,144 1,693 389 777 149 - 119 -
8,272 8,295 (0.3%)
Operating Margin
15.9% 5.2% 1.2% 2.4% 0.5% - 0.4% - 25.6% 26.6% (100 bps)
Other Non-Operating Income,
Net
(412) - - - - (308) - - (720) (482) 49.4%
Net Income Attributable to
MDT ($M)
3,676 1,435 323 664 118 305 97 299 6,918 7,045 (1.8%)
Diluted EPS ($)
(1)
2.76 1.08 0.24 0.50 0.09 0.23 0.07 0.22 5.20 5.29 (1.7%)
1) Data has been intentionally rounded to the nearest million or $0.01 for EPS figures and, therefore, may not sum
Table of
Contents
Executive
Summary
Portfolio
Highlights
Sustainability Appendix
Guidance &
Assumptions
Financial
Highlights
FY24
Recap
| Q4 FY24 Earnings Presentation | May 23, 202429

Medtronic business structure
Surgical & Endoscopy
• Surgical
• Endoscopy
Acute Care & Monitoring
Cardiovascular Neuroscience Medical Surgical Diabetes
Learn more Learn moreLearn more Learn more
Cardiac Rhythm & Heart Failure
• Cardiac Rhythm Management
• Cardiac Ablation Solutions
Structural Heart & Aortic
• Structural Heart & Aortic
• Cardiac Surgery
Coronary & Peripheral Vascular
• Coronary & Renal Denervation
• Peripheral Vascular Health
Therapies and services for
insulin-dependent people
who have Type 1 and Type 2
Cranial & Spinal Technologies
Specialty Therapies
• Neurovascular
• Ears, Nose & Throat (ENT)
• Pelvic Health
Neuromodulation
Other
Learn more
• Cardinal Health Manufacturing
Agreements
• Mozarc Medical Manufacturing
& Servicing Agreements
• Ventilation Service Solutions
Table of
Contents
Executive
Summary
Portfolio
Highlights
Sustainability Appendix
Guidance &
Assumptions
Financial
Highlights
FY24
Recap
| Q4 FY24 Earnings Presentation | May 23, 202430

Growth Business specific Business specific Other
Revenue Decreased Y/Y
Organic
AID
Automated Insulin Delivery
ICD
Implantable Cardioverter Defibrillator
ACC
American College of Cardiology
Revenue flat Y/Y Organic
CAS
Cardiac Ablation Solutions
LAA
Left Atrial Appendage
EM
Emerging Markets
Revenue Increased Y/Y
Organic
CGM
Continuous Glucose Monitoring
MDI
Multiple Daily Injections
FIH
First-In-Human
WAMGR
Weighted Average Market
Growth Rate
CRM
Cardiac Rhythm Management
PFA
Pulse Field Ablation
HCP
Health Care Provider
DBS
Deep Brain Stimulation
RAS
Robot
-Assisted Surgery
IDE
Investigational Device Exemption
DCB
Drug Coated Balloon
RDN
Renal Denervation
ID&E
Inclusion, Diversity and Equity
DES
Drug Eluting Stent
SCS
Spinal Cord Stimulation
LMR
Limited Market Release
DTM
Differential Target Multiplexed Waveform
TAR
Time Above Range
NEJM
New England Journal of Medicine
ENT Ear, Nose, & Throat TAA
Thoracic Aortic Aneurysm
NMPA
National Medical Products Admin.
EV-ICD
Extravascular Implantable Cardioverter
Defibrillator
TAVR
Transcatheter Aortic Valve Replacement
OU
Operating Unit
GI
Gastrointestinal
TIR
Time In Range
VBP
Volume-Based Procurement
GYN
Gynecology
URO
Urology
WE
Western Europe
WW
World Wide
Abbreviations & acronyms
Table of
Contents
Executive
Summary
Portfolio
Highlights
Sustainability Appendix
Guidance &
Assumptions
Financial
Highlights
FY24
Recap
| Q4 FY24 Earnings Presentation | May 23, 202431
Ryan Weispfenning
Vice President,
Head of Investor Relations
Brad Welnick
Vice President,
Investor Relations
Investor Relations
contact information
investor.relations@medtronic.com
