Investor
Presentation
March 2024
The Baylor Scott & White Charles A Sammons Cancer Center
Dallas, Texas

Disclaimers
This Healthpeak Properties, Inc. (the presentation is solely for your information,
is subject to change and speaks only as of the date hereof. This presentation is not complete
and is only a summary of the more detailed information included elsewhere, including in our
Securities and Exchange Commission filings. No representation or warranty,
express or implied, is made and you should not place undue reliance on the accuracy,
fairness or completeness of the information presented.
Forward-Looking Statements
Statements contained in this presentation that are not historical facts are "forward-looking
statements" within the meaning of Section 27A of the Securities Act of 1933, as amended,
and Section 21E of the Securities Exchange Act of 1934, as amended. Forward-looking
statements include, among other things, statements regarding our and our intent,
belief or expectation as identified by the use of words such as
and other comparable and derivative terms or the
negatives thereof.
Examples of forward-looking statements include, among other things, (i) statements
regarding timing, outcomes and other details relating to current, pending or contemplated
acquisitions, dispositions, transitions, developments, redevelopments, densifications, joint
venture transactions, leasing activity and commitments, capital recycling plans, financing
activities, or other transactions; (ii) development and densification opportunities; (iii) outlooks
related to outpatient medical, lab, and CCRCs; and (iv) potential capital sources and uses.
You should not place undue reliance on these forward-looking statements. Pending
acquisitions, dispositions, joint venture transactions, leasing activity, and financing activity,
including those that are subject to binding agreements, remain subject to closing conditions
and may not be completed within the anticipated timeframes or at all. Forward-looking
statements reflect our current expectations and views about future events and are subject to
risks and uncertainties that could significantly affect our future financial condition and results
of operations. While forward-looking statements reflect our good faith belief and assumptions
we believe to be reasonable based upon current information, we can give no assurance that
our expectations or forecasts will be attained. Further, we cannot guarantee the accuracy of
any such forward-looking statement contained in this presentation, and such forward-looking
statements are subject to known and unknown risks and uncertainties that are difficult to
predict. These risks and uncertainties include, but are not limited to: macroeconomic trends,
including inflation, interest rates, labor costs, and unemployment; risks associated with the
merger transactions with Physicians Realty Trust (the including, but not limited
to, potential loss or disruption of current and prospective commercial relationships due to the
uncertainties about the Mergers, and the outcome of legal proceedings instituted against us,
our Board of Directors, and others related to the Mergers; our ability to integrate the
operations of the Company and Physicians Realty Trust successfully and realize the
anticipated synergies and other benefits of the Mergers or do so within the anticipated time
frame; changes within the industries in which we operate; significant regulation, funding
requirements, and uncertainty faced by our lab tenants; factors adversely affecting our
or ability to meet their financial and other contractual
obligations to us; the insolvency or bankruptcy of one or more of our major tenants,
operators, or borrowers; our concentration of real estate investments in the healthcare
property sector, which makes us more vulnerable to a downturn in a specific sector than if
we invested across multiple sectors; the illiquidity of real estate investments; our ability to
identify and secure new or replacement tenants and operators; our property development,
redevelopment, and tenant improvement risks, including project abandonments, project
delays, and lower profits than expected; the ability of the hospitals on whose campuses our
outpatient medical buildings are located and their affiliated healthcare systems to remain
competitive or financially viable; our ability to develop, maintain, or expand hospital and
health system client relationships; operational risks associated with third party management
contracts, including the additional regulation and liabilities of our properties operated through
RIDEA structures; economic conditions, natural disasters, weather, and other conditions that
negatively affect geographic areas where we have concentrated investments; uninsured or
underinsured losses, which could result in significant losses and/or performance declines by
us or our tenants and operators; our investments in joint ventures and unconsolidated
entities, including our lack of sole decision making authority and our reliance on our
financial condition and continued cooperation; our use of fixed rent escalators, contingent
rent provisions, and/or rent escalators based on the Consumer Price Index; competition for
suitable healthcare properties to grow our investment portfolio; our ability to foreclose or
exercise rights on collateral securing our real estate-related loans; any requirement that we
recognize reserves, allowances, credit losses, or impairment charges; investment of
substantial resources and time in transactions that are not consummated; our ability to
successfully integrate or operate acquisitions; the potential impact on us and our tenants,
operators, and borrowers from litigation matters, including rising liability and insurance costs;
environmental compliance costs and liabilities associated with our real estate investments;
ESG and sustainability commitments and requirements, as well as stakeholder expectations;
epidemics, pandemics, or other infectious diseases, including Covid, and health and safety
measures intended to reduce their spread; human capital risks, including the loss or limited
availability of our key personnel; our reliance on information technology systems and the
possibility of a cybersecurity incident or cybersecurity threat affect our information systems
or the information systems of our tenants, operators or borrowers; volatility, disruption, or
uncertainty in the financial markets; increased borrowing costs, including due to rising
interest rates; cash available for distribution to stockholders and our ability to make dividend
distributions at expected levels; the availability of external capital on acceptable terms or at
all, including due to rising interest rates, changes in our credit ratings and the value of our
common stock, bank failures or other events affecting financial institutions; our ability to
manage our indebtedness level and covenants in and changes to the terms of such
indebtedness; the failure of our tenants, operators, and borrowers to comply with federal,
state, and local laws and regulations, including resident health and safety requirements, as
well as licensure, certification, and inspection requirements; required regulatory approvals to
transfer our senior housing properties; compliance with the Americans with Disabilities Act
and fire, safety, and other regulations; laws or regulations prohibiting eviction of our tenants;
the requirements of, or changes to, governmental reimbursement programs such as
Medicare or Medicaid; legislation to address federal government operations and
administrative decisions affecting the Centers for Medicare and Medicaid Services; our
participation in the CARES Act Provider Relief Fund and other Covid-related stimulus and
relief programs; our ability to maintain our qualification as a REIT; our taxable REIT
subsidiaries being subject to corporate level tax; tax imposed on any net income from
; changes to U.S. federal income tax laws, and potential deferred
and contingent tax liabilities from corporate acquisitions; calculating non-REIT tax earnings
and profits distributions; ownership limits in our charter that restrict ownership in our stock;
provisions of Maryland law and our charter that could prevent a transaction that may
otherwise be in the interest of our stockholders; conflicts of interest between the interests of
our stockholders and the interests of holders of Healthpeak OP common units; provisions in
the operating agreement of Healthpeak OP and other agreements that may delay or prevent
unsolicited acquisitions and other transactions; our status as a holding company of
Healthpeak OP; and other risks and uncertainties described from time to time in our
Securities and Exchange Commission filings. Except as required by law, we do not
undertake, and hereby disclaim, any obligation to update any forward-looking statements,
which speak only as of the date on which they are made.
Market and Industry Data
This presentation also includes market and industry data that the Company has obtained
from market research, publicly available information and industry publications. The accuracy
and completeness of such information are not guaranteed. Such data is often based on
industry surveys and experience in the industry. Similarly, although Healthpeak
believes that the surveys and market research that others have performed are reliable, such
surveys and market research are subject to assumptions, estimates and other uncertainties
and Healthpeak has not independently verified this information.
Non-GAAP Financial Measures
This presentation contains certain supplemental non-GAAP financial measures. While the
Company believes that non-GAAP financial measures are helpful in evaluating its operating
performance, the use of non-GAAP financial measures in this presentation should not be
considered in isolation from, or as an alternative for, a measure of financial or operating
performance as defined by GAAP. We caution you that there are inherent limitations
associated with the use of each of these supplemental non-GAAP financial measures as an
analytical tool. Additionally, the computation of non-GAAP financial measures
may not be comparable to those reported by other REITs. You can find reconciliations of the
non-GAAP financial measures to the most directly comparable GAAP financial measures in
the fourth quarter 2023 Discussion and Reconciliation of Non-GAAP Financial Measures
available on our website at http://ir.healthpeak.com/quarterly-results.
2Investor Presentation March 2024
Executive Summary – Continued Strong Execution
3
▪ AFFO of $1.53 per share; +5 pennies better than original guidance
▪ FFO as Adjusted of $1.78 per share; +5 pennies better than original guidance
▪ Same-store growth of 4.8%; +130 basis points better than original guidance
▪ Near-record leasing volume with ~5.1 million square feet of executions across Outpatient Medical and Lab
Fortress
Balance Sheet
2024
Outlook
(1)
▪ 5.2x Net Debt to EBITDA
(1)
and ~$3 billion of liquidity
▪ New 5-year, $750 million term loan swapped to a fixed rate of 4.5%
Recent
Updates
2023
Performance
(1)
▪ Merger with Physicians Realty Trust closed on March 1
st
th
o $40 million of year-one merger synergies included in 2024 Outlook
o Completed property management internalization in four markets to date with an additional five markets scheduled by the end of the second quarter
▪ Received $69 million of proceeds from repayment of seller financing loans in mid-February and under contract on ~$40 million of outpatient dispositions;
continue to pursue less-core property dispositions
▪ AFFO of $1.50 - $1.56 per share; in-line with consensus estimates
▪ FFO as Adjusted of $1.73 - $1.79 per share; includes 3 penny headwind from non-cash merger-related debt mark-to-market
▪ Same-store growth of 2.25% - 3.75%
Investor Presentation March 2024
2025+
Upside
▪ ~$60 million cash NOI
(1)
upside opportunity from temporary downtime at trophy Lab campuses (Vantage, Portside, and Gateway / Directors) and
additional ~$20 million of incremental merger synergies above the $40 million year-one target
▪ Accretive stock buybacks with excess cash including proceeds from less-core property sales and / or seller-financing loan repayments
1) Reconciliations, definitions, and important discussions regarding the usefulness and limitations of the non-GAAP financial measu-
in this presentation can be found in the fourth quarter 2023 Discussion and Reconciliation of Non-GAAP Financial Measures at http://ir.healthpeak.com/quarterly-results-
Total Portfolio Same-of 12/31/23; there is no material change expected in Net Debt to
Adjusted EBITDAre following the merger with Physicians Realty Trust completed on 3/1/2024. The 2024 Outlook ranges provide a framework for metrics of Healthpeak following the merger with
Physicians Realty Trust. We expect to finalize 2024 guidance in late April once 1Q books are closed and GAAP merger adjustments are finalized.

Why Healthpeak
4
Compelling Total Return
Opportunity
3% cash same
-store NOI growth, opportunity for ~$60 million of cash NOI upside across three lab campuses
and $20 million of additional merger synergies, a well
-covered dividend currently yielding ~7.2%, and a stock
price currently trading ~30% below consensus NAV creates a compelling total return opportunity
(1)
Structural Demand
Drivers
Portfolio benefits from continued scientific discovery, an aging population, and the trend toward lower
-cost
outpatient care delivery
Portfolio Quality
Critical mass of purpose
-built lab campuses in the three most important clusters and a high-quality outpatient
medical portfolio leased to leading health systems and specialty physicians
Competitive Advantage
Decades of operational expertise and relationships drive internal and external growth opportunities
Fortress Balance Sheet
5.2x
Net Debt to EBITDA
(2)
, limited floating rate debt, and no material 2024 debt maturities
Sustainable and
Responsible Business
Sustainability embedded into our business model and operating plan; committed to strong governance
1) 3% same-store growth represents the mid--store Outlook, See page 9 for details on estimated NOI u
and a share price of $16.75 as of 2/29/24. Consensus NAV per share of $24.77 as of 2/29/24 per CapIQ. Reconciliations, definitions, and important discussions regarding the usefulness and limitations of
the non--nd in the fourth quarter 2023 Discussion and Reconciliation of Non-
GAAP Financial Measures located at http://ir.healthpeak.com/quarterly---Store Cash (Adjusted) NOI growth.
2) Net Debt to Adjusted EBITDAre following the merger with Physicians
Realty Trust completed on 3/1/24.
Investor Presentation March 2024

Strategic Merger Benefits
The combination of Healthpeak and Physicians Realty Trust accelerates key strategic goals
5
Create Best
-In-Class Platform
Combined senior team has 200+ years of outpatient medical operating experience
Drive Internal Growth
Favorable supply / demand fundamentals are producing at or near all
-time highs for outpatient
medical same
-store, retention, and releasing spreads
Grow Earnings
Increases 2024 AFFO by 5 pennies per share (+3.4% versus stand
-alone Healthpeak)
Lower Cap
-Ex
Legacy Physicians Realty Trust portfolio comprised of younger assets with longer WALT and higher
percentage of investment grade tenants, resulting in lower cap
-ex than industry averages; earnings
and same
-store are important metrics, but cash flow drives IRR
Maintain Strong Balance Sheet
Improves leverage and extends weighted average maturity
Improve G&A Efficiency
Healthpeak G&A essentially flat despite adding ~$5 billion of assets
Expand Growth Relationships
No company better networked in the outpatient medical sector; relationships create outsized internal
and external growth opportunities
Investor Presentation March 2024
Strategic Goal
Merger Benefit

Delivering Earnings Results & Exceeding Expectations
6
FFO as Adjusted
Same-Store
Growth
Original 2023 Guidance
(1)
Actual 2023 Results
(1)
Midpoint Variance
$1.73 $1.78 + $0.05
$1.48 $1.53 + $0.05
3.5% 4.8% + 130 bps
1) -GAAP financial measures can be found in the Discussion and
Reconciliation of Non-GAAP Financial Measures for the fourth quarter 2022 (for Original 2023 Guidance) and the fourth quarter 2023 (for Actual 2023 Results), in each case at
http://ir.healthpeak.com/quarterly-results.
AFFO
Investor Presentation March 2024
Strong track record for exceeding guidance
2020-2022 Avg. 2023
Note: Lease executions for legacy Healthpeak portfolio only.
2023 Lease Executions Above the 3-Year Average
7Investor Presentation March 2024
+6%
4.8M SF
5.1M SF
Record or near-record lease executions,
tenant retention, and lease spreads led to
year-end same-store occupancy of ~92%,
with +4% cash renewal spreads
Outpatient Medical
Lab
~90% of lease executions in our three core
markets were with existing tenants,
demonstrating the importance of scale and
relationships to drive leasing success
Continued growth in outpatient demand and strong lab relationships drove above-trend leasing volumes
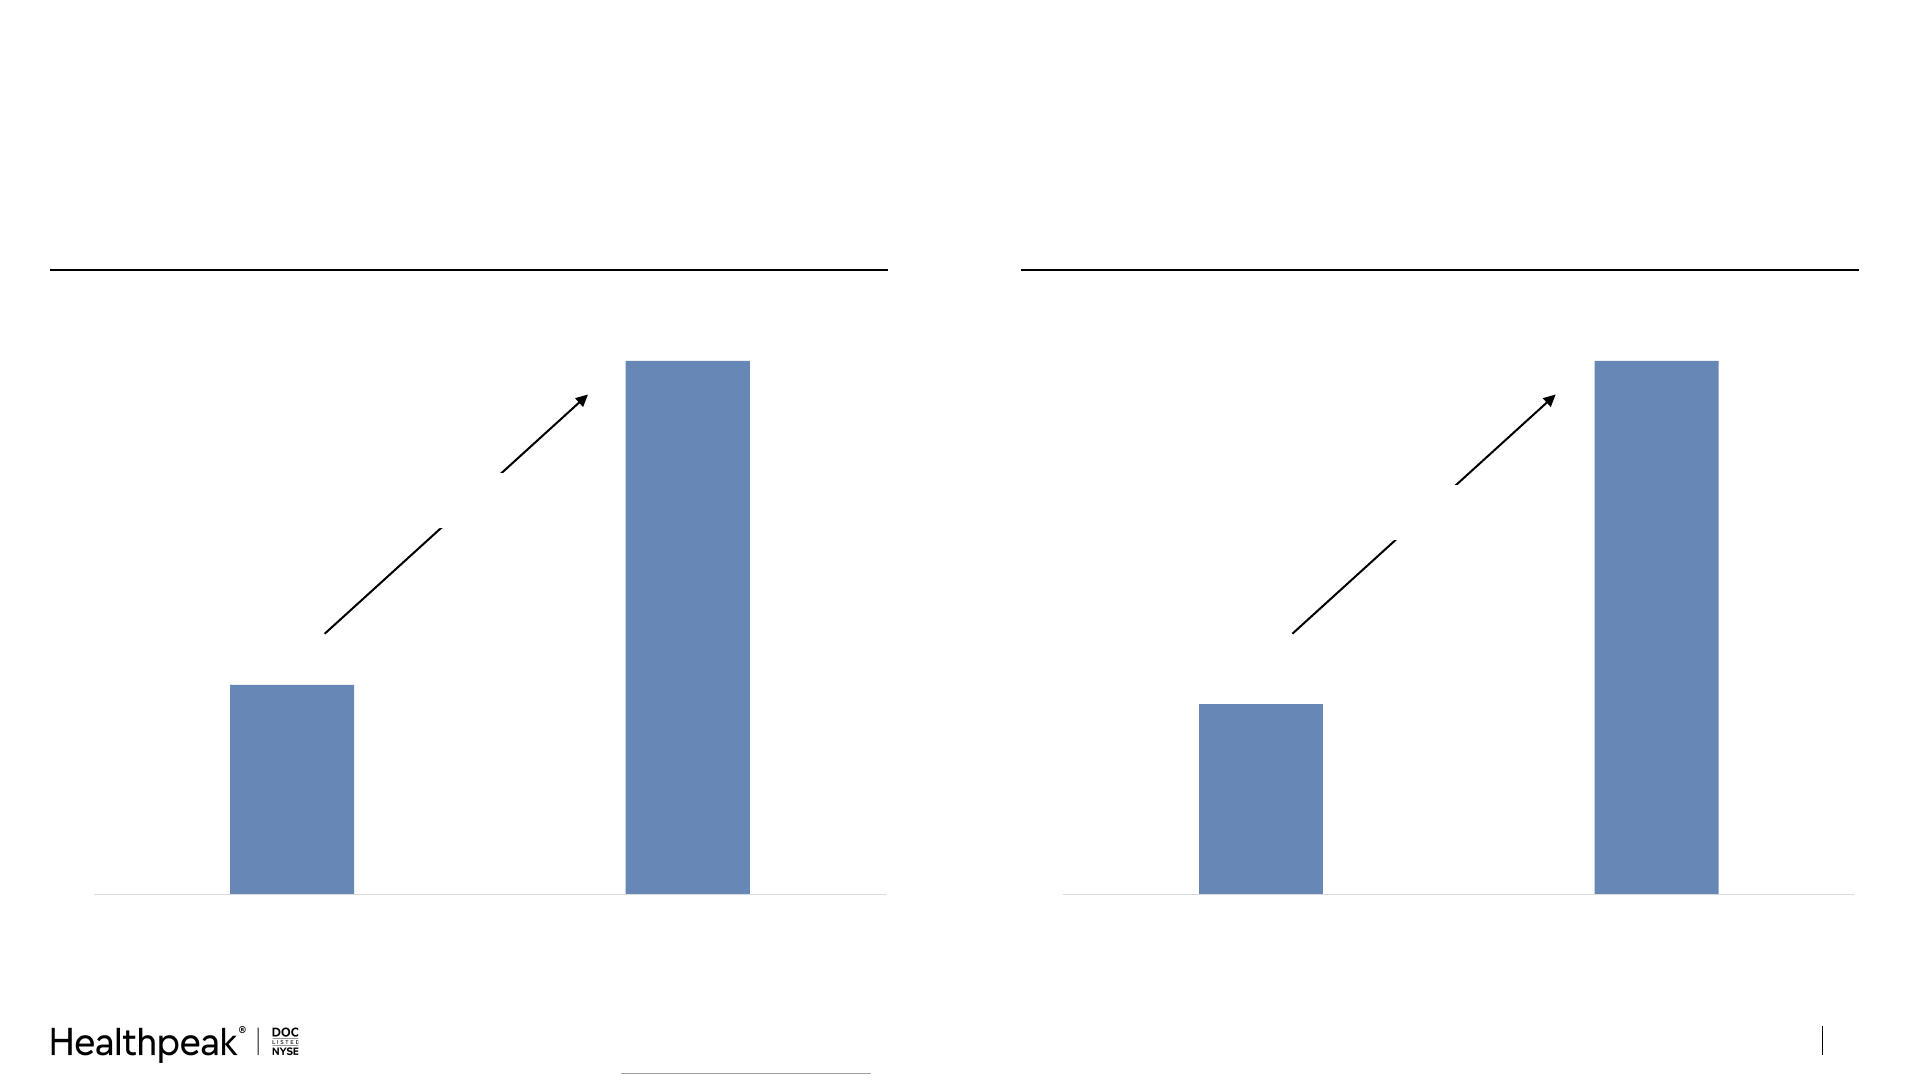
Double Digit Earnings Growth Over the Past Two Years
8
FFO as Adjusted per Share
(1)
AFFO per Share
(1)
$1.61
$1.78
2021 2023
$1.35
$1.53
2021 2023
+11%
+13%
Investor Presentation March 2024
Earnings growth driven by development earn-in, property performance, and a more efficient G&A structure
Note: Represents earnings growth for legacy Healthpeak only.
1) Reconciliations, definitions, and important discussions regarding the usefulness and limitations of the non-GAAP financial measures can be found in the fourth quarter 2023 Discussion and Reconciliation
of Non-GAAP Financial Measures located at http://ir.healthpeak.com/quarterly-results.
.
Significant Potential Growth Opportunity
9
Vantage Phase I
Development
(1)
Gateway / Directors
Dev & Redev
(1)
Portside
Redevelopment
(1)
Additional Merger
Synergies
(2)
+$15M
+$20M
+$25M
+$20M
2025+ Upside Opportunity
+$80M
1) Estimated stabilized cash NOI is based on a mid-point of current market rents. Subject to change based on market conditions.
2) Represents incremental merger-
Investor Presentation March 2024
~$60 million of cash NOI upside and ~$20 million of additional merger synergies that are not included in our 2024
earnings Outlook; majority of capital needed to achieve upside already incurred or included in 2024 forecast
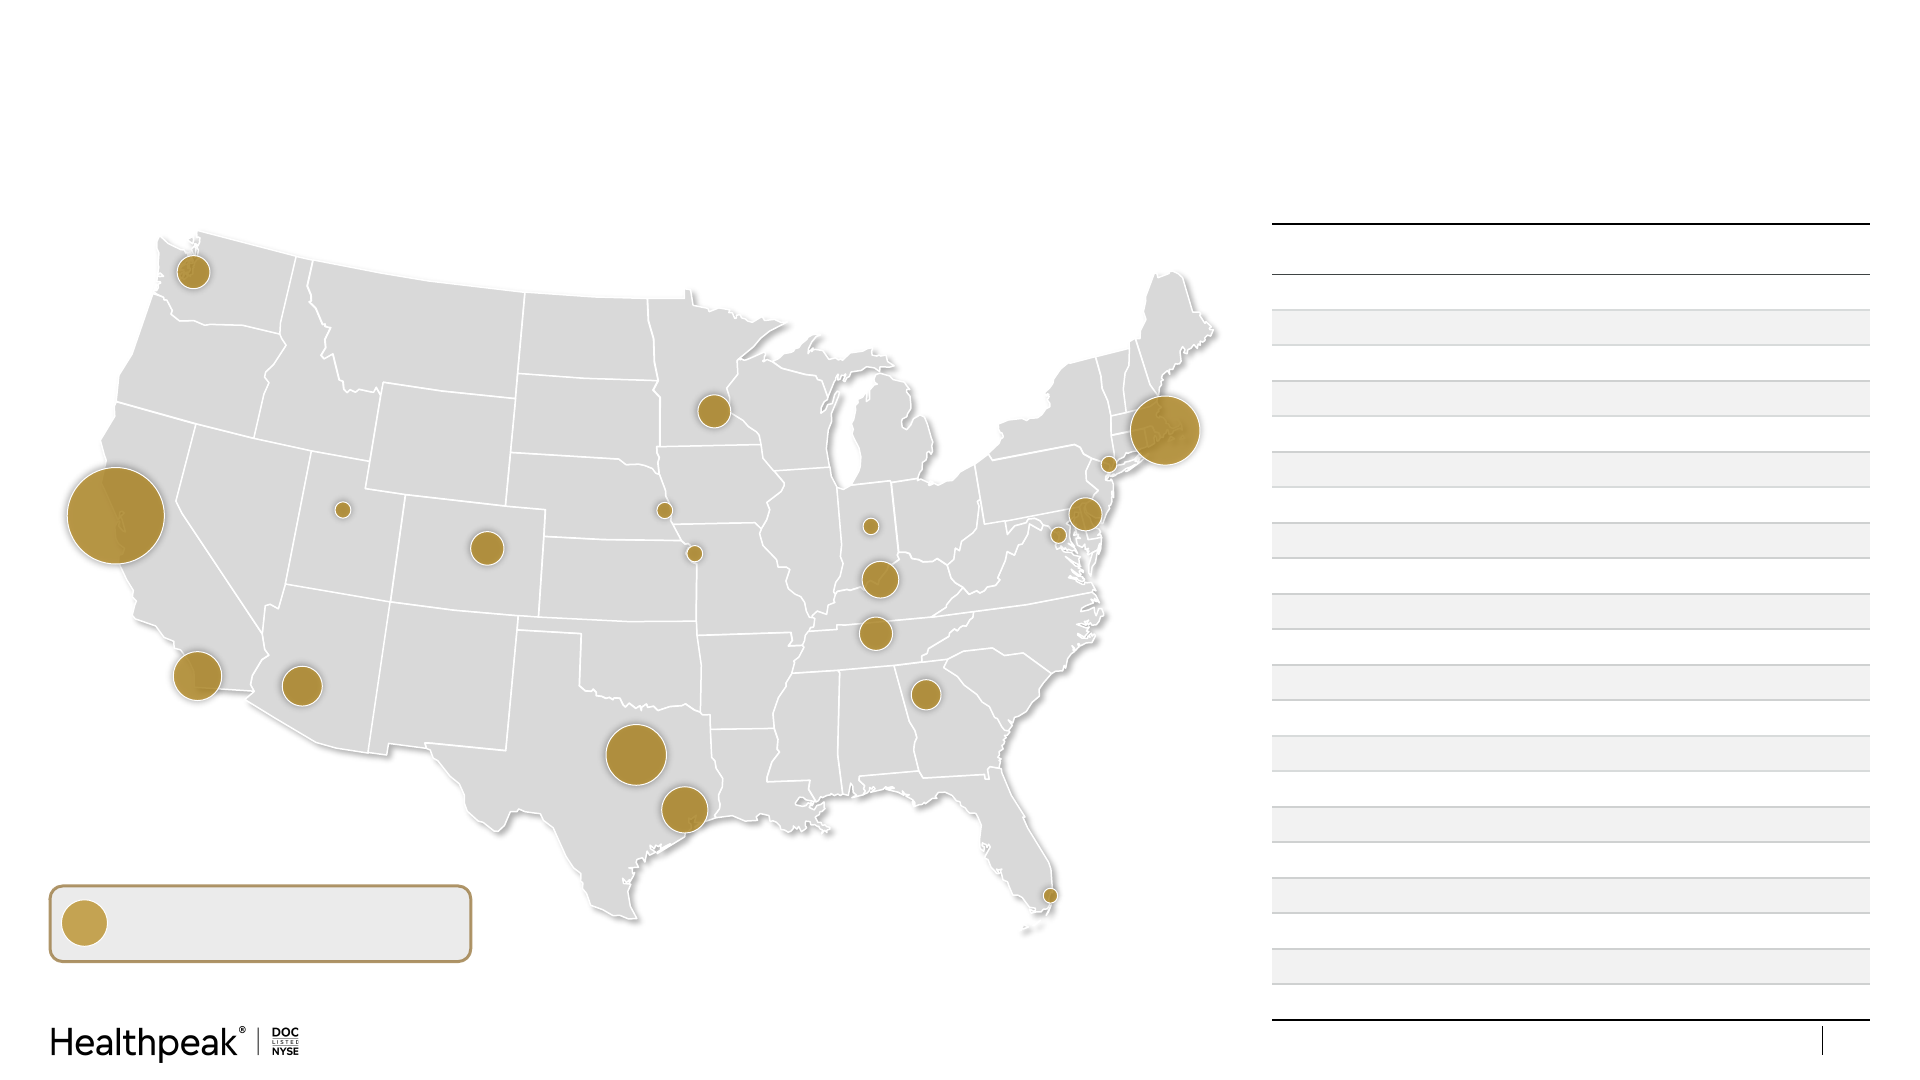
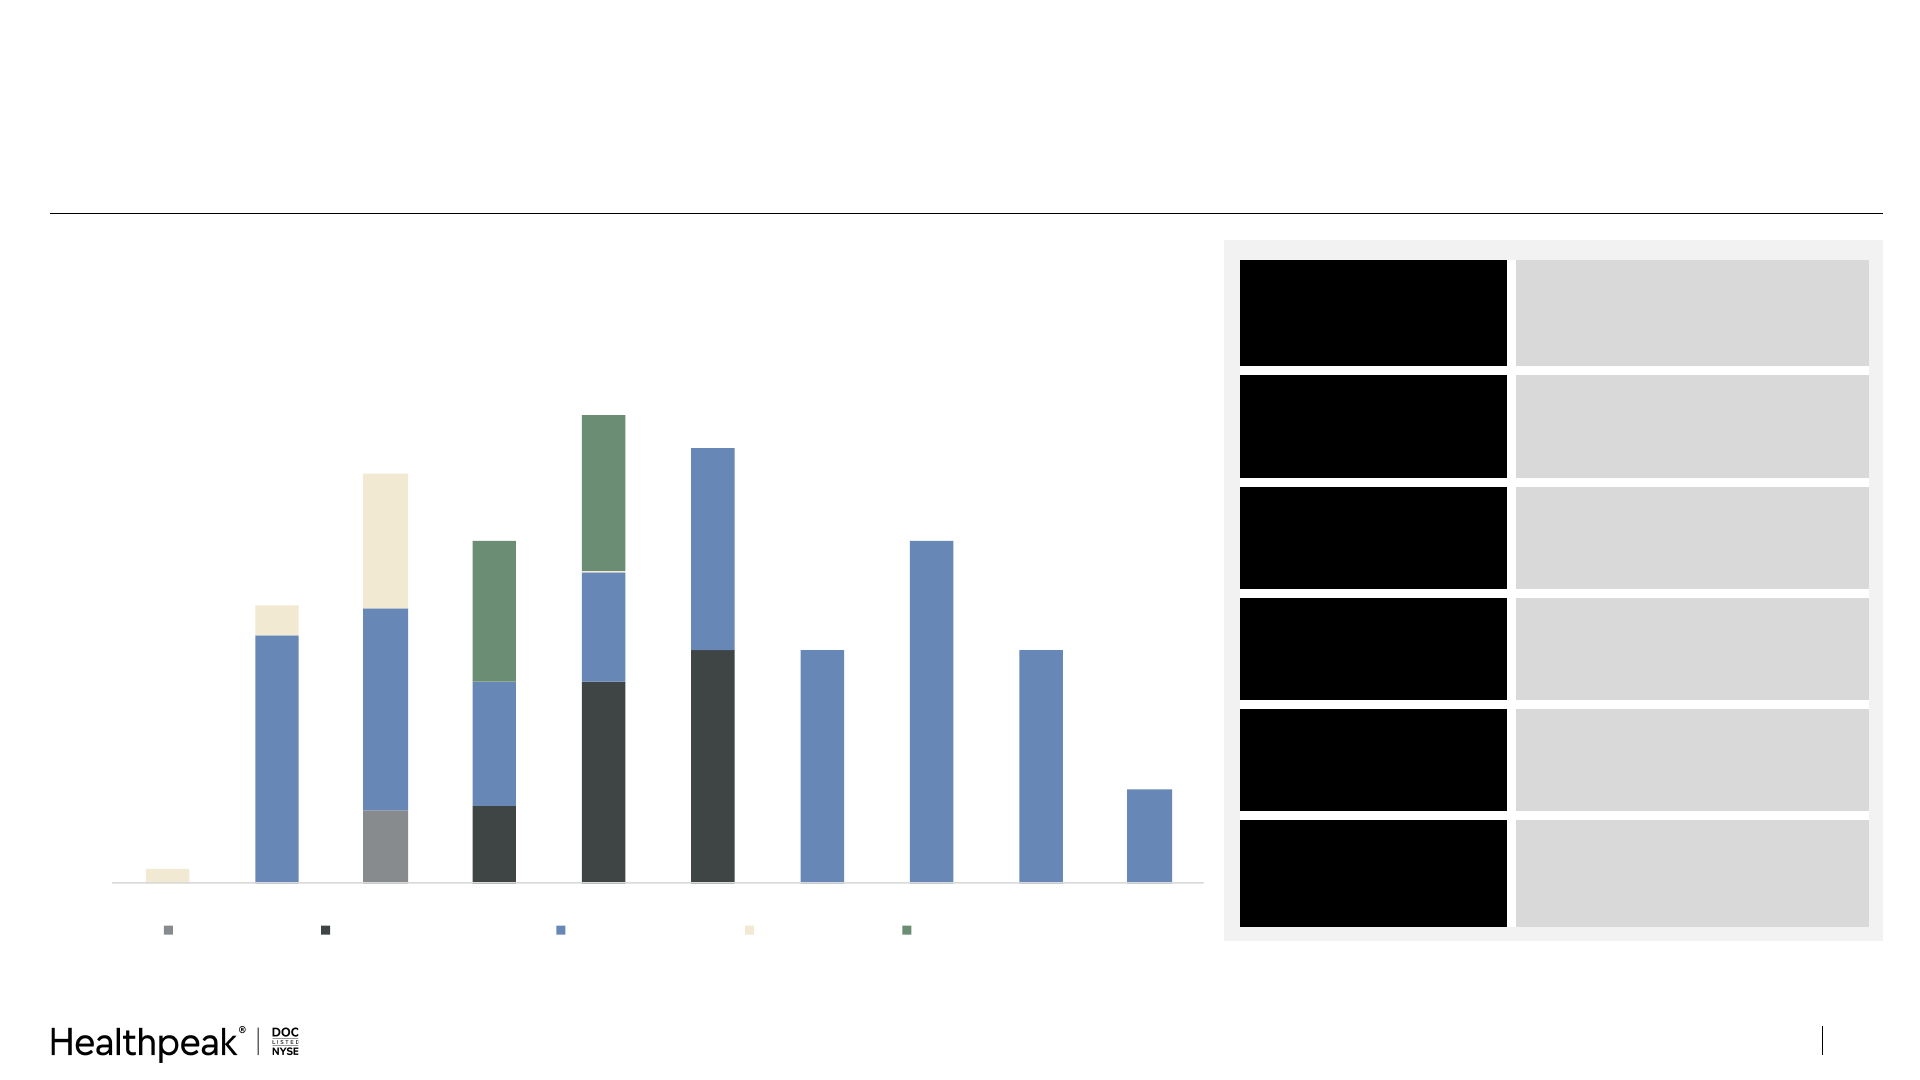
National Scale, Local Competitive Advantage, Attractive Diversification
10
13 markets with footprints of 1 million square feet or more to help drive local competitive advantage
Bay Area /
South San Francisco
25%
Boston
10%
Dallas
8%
San Diego
6%
Houston
4%
Phoenix
3%
Louisville
3%
Nashville
3%
Seattle
2%
Atlanta
2%
Denver
2%
Minneapolis
2%
Indianapolis
1%
Philadelphia
2%
New York
1%
Salt Lake City
1%
Miami
1%
Washington, DC
1%
Omaha
1%
Kansa City
1%
Rank
Market
Square Feet
(M)
% of ABR
(1)
1
Bay Area (S. SF), CA
(2)
6.3 25%
2
Boston, MA 2.8 10%
3
Dallas, TX 4.6 8%
4
San Diego, CA 3.0 6%
5
Houston, TX 3.6 4%
6
Nashville, TN 1.8 3%
7
Phoenix, AZ 1.8 3%
8
Louisville, KY 1.9 3%
9
Denver, CO 1.2 2%
10
Seattle, WA 1.1 2%
11
Atlanta, GA 1.2 2%
12
Minneapolis, MN 1.0 2%
13
Philadelphia, PA 1.3 2%
14
New York, NY 0.8 1%
15
Indianapolis, IN 0.8 1%
16
Salt Lake City, UT 0.8 1%
17
Miami, FL 0.6 1%
18
Washington, DC 0.5 1%
19
Kansas City, MO 0.5 1%
20
Omaha, NE 0.7 1%
Remainder 15.0 21%
Top 20 Outpatient and Lab Markets
Sized in proportion to % of ABR
Investor Presentation March 2024
1) CRC / Senior Housing JV portfolio.
2) Primarily consists of the city of South San Francisco, located 10+ miles south of the central business district of San Francisco, in San Mateo County. Healhpeak does not own any assets in the city or county of San Francisco.
34%
16%
11%
8%
7%
7%
7%
6%
4%
Diversified Tenant Base and Leading Relationships
11
Unmatched roster of leading biopharma, health systems, and physician groups to drive internal and external growth;
only two tenants represent more than 1% of ABR
1) Specialty outpatient services includes tenant types such as non-health system ambulatory surgical centers, cancer treatment and dialysis centers, imaging and radiology, urgent care and sleep labs. Large Cap Biopharma represents companies
with a market cap (as of 12/31/2023) as follows: >$10B; Mid Cap between $10B and $500M; and Small Cap: <$500M.
2) Top 20 Tenants excludes Amgen due to recent lease expirations.
3) urt
portfolio.
Rank
Parent Name Classification
% of ABR
(3)
1
HCA Healthcare Health System 9%
2
CommonSpirit Health Health System 3%
3
Astellas Pharma Large Cap Biopharma 1%
4
McKesson Corporation Health System 1%
5
University of Louisville Health System 1%
6
Ascension Health Health System 1%
7
Tenet Healthcare Health System 1%
8
Northside Hospital Health System 1%
9
Bristol-Myers Squibb Large Cap Biopharma 1%
10
Arcus Biosciences Mid Cap Biopharma 1%
11
Johnson & Johnson Large Cap Biopharma 1%
12
Community Health Systems Health System 1%
13
Memorial Hermann Health System 1%
14
Myriad Genetics Mid Cap Biopharma 1%
15
Norton Healthcare Health System 1%
16
HonorHealth Health System 1%
17
Novo Nordisk Large Cap Biopharma 1%
18
Pfizer Large Cap Biopharma 1%
19
Nkarta Small Cap Biopharma 1%
20
Alphabet (Calico subsidiary) Large Cap Biopharma 1%
Physician Group Practices
Large Cap Biopharma
CCRC / SH
Mid Cap
Biopharma
Small Cap
Biopharma
Private
Biopharma
Other
Tenant Diversification
(1)
Health System
Top 20 Tenants
(2)
Med Device / R&D / University &
Specialty Outpatient Services
$1.7B
Annualized
Base Rent
(3)
Investor Presentation March 2024
Fortress Balance Sheet
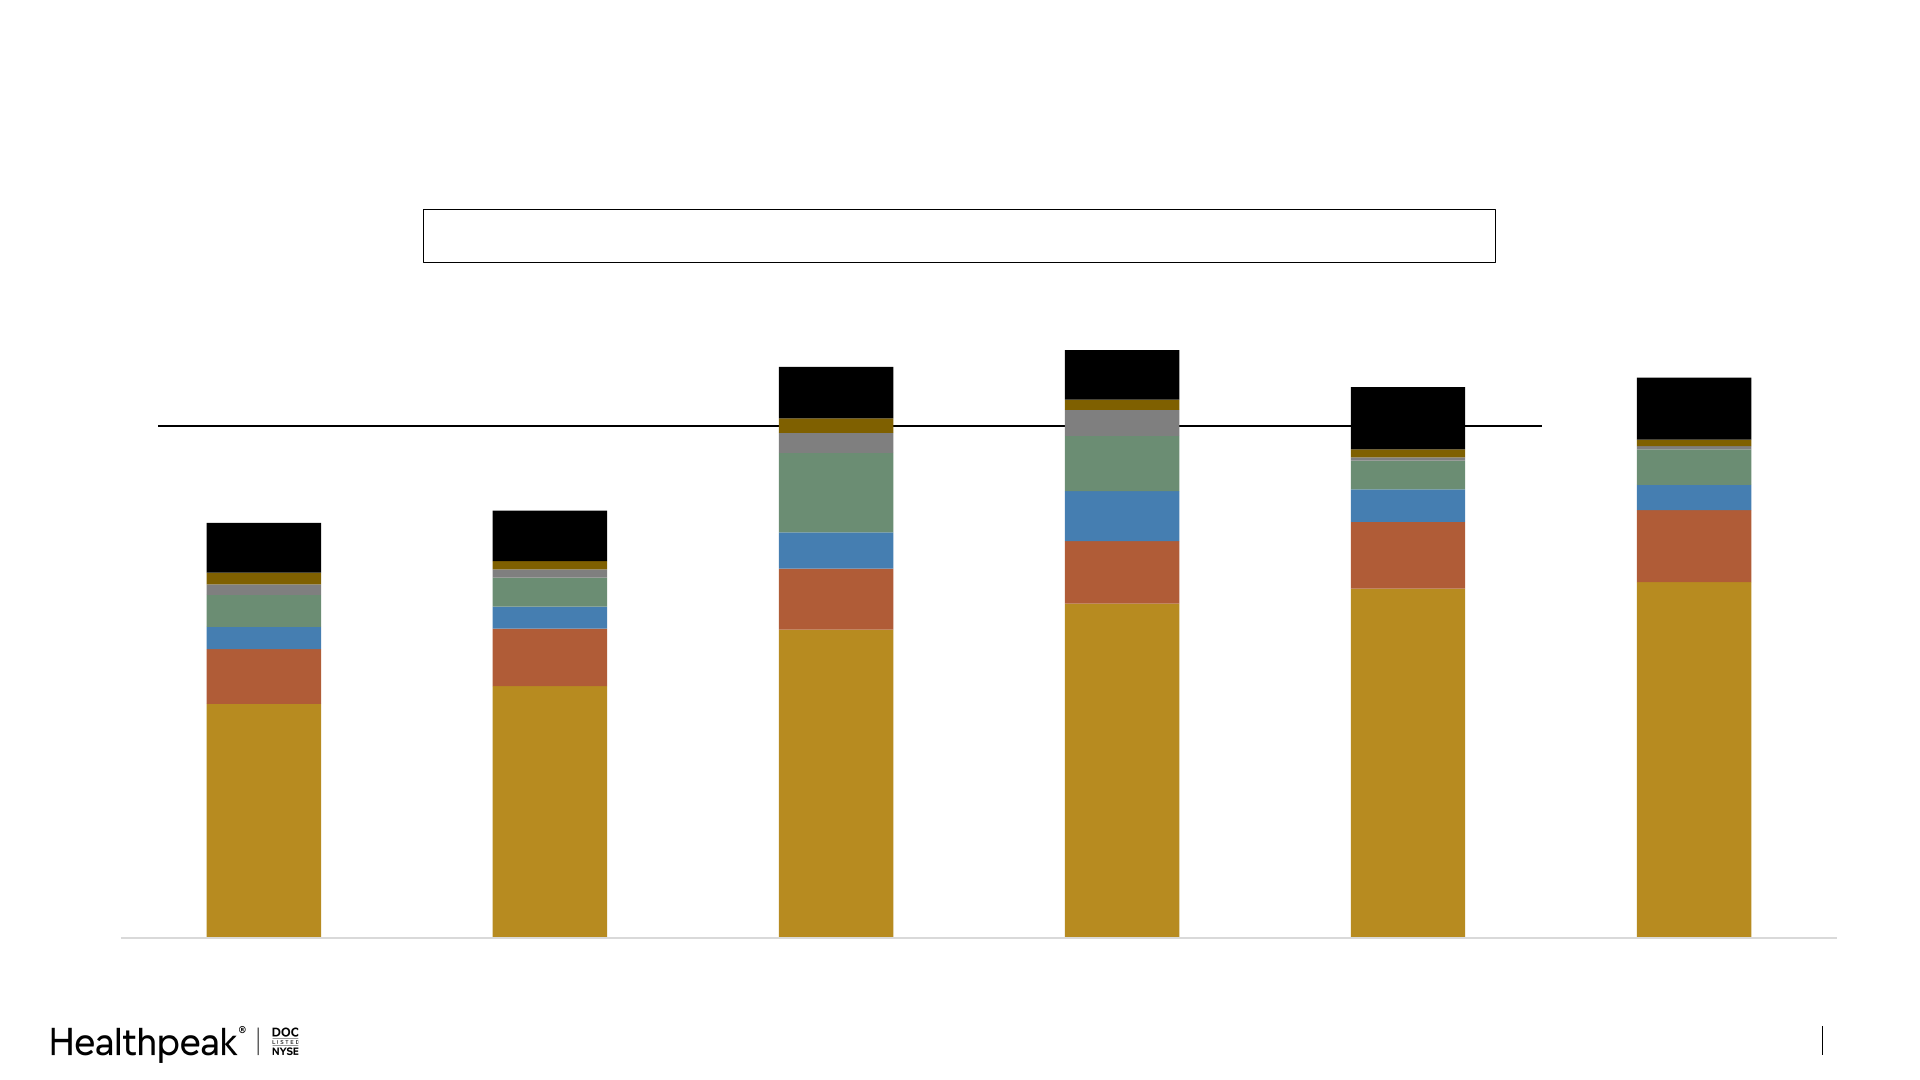
Debt Maturities and Credit Metrics
(1)(2)
($ in billions)
12
1) As of 12/31/23 adjusted to reflect the merger with Physicians Realty Trust, a new $750M unsecured term loan maturing in 2029, re
ing unsecured term loan, unsecured bonds, and mortgage debt.
2) Assumes one-
3) Based on coupon rate and excludes amortization of any discount / premium and deferred financing costs.
4) Includes variable rate loans receivable of $110M.
5) Net Debt to Adjusted EBITDAre following the merger with
Physicians Realty Trust completed on 3/1/2024.
6) ty.
Weighted Average
Interest Rate
(3)
3.8%
Weighted Average
Debt Maturity
(2)
4.9 years
Secured Debt
Percentage
2.3%
Net Floating Rate
Debt Exposure
(4)
2.3%
Net Debt / Adjusted
EBITDA
(5)
5.2x
Liquidity
(6)
~$3B
Strong balance sheet with well-laddered maturities and low floating rate debt exposure
$0.2
$0.3
$0.7
$0.8
$0.8
$0.7
$0.4
$0.4
$0.7
$0.1
$0.4
$0.5
$0.5
$0.0
$0.9
$1.3
$1.2
$1.6
$1.5
$0.8
$1.1
$0.8
$0.3
$-
$0.5
$1.0
$1.5
$2.0
2024 2025 2026 2027 2028 2029 2030 2031 2032 Thereafter
Revolver / CP Unsecured Term Loans Unsecured Bonds Secured Debt Unsecured Green Bonds
Investor Presentation March 2024

Outpatient Medical
Overview
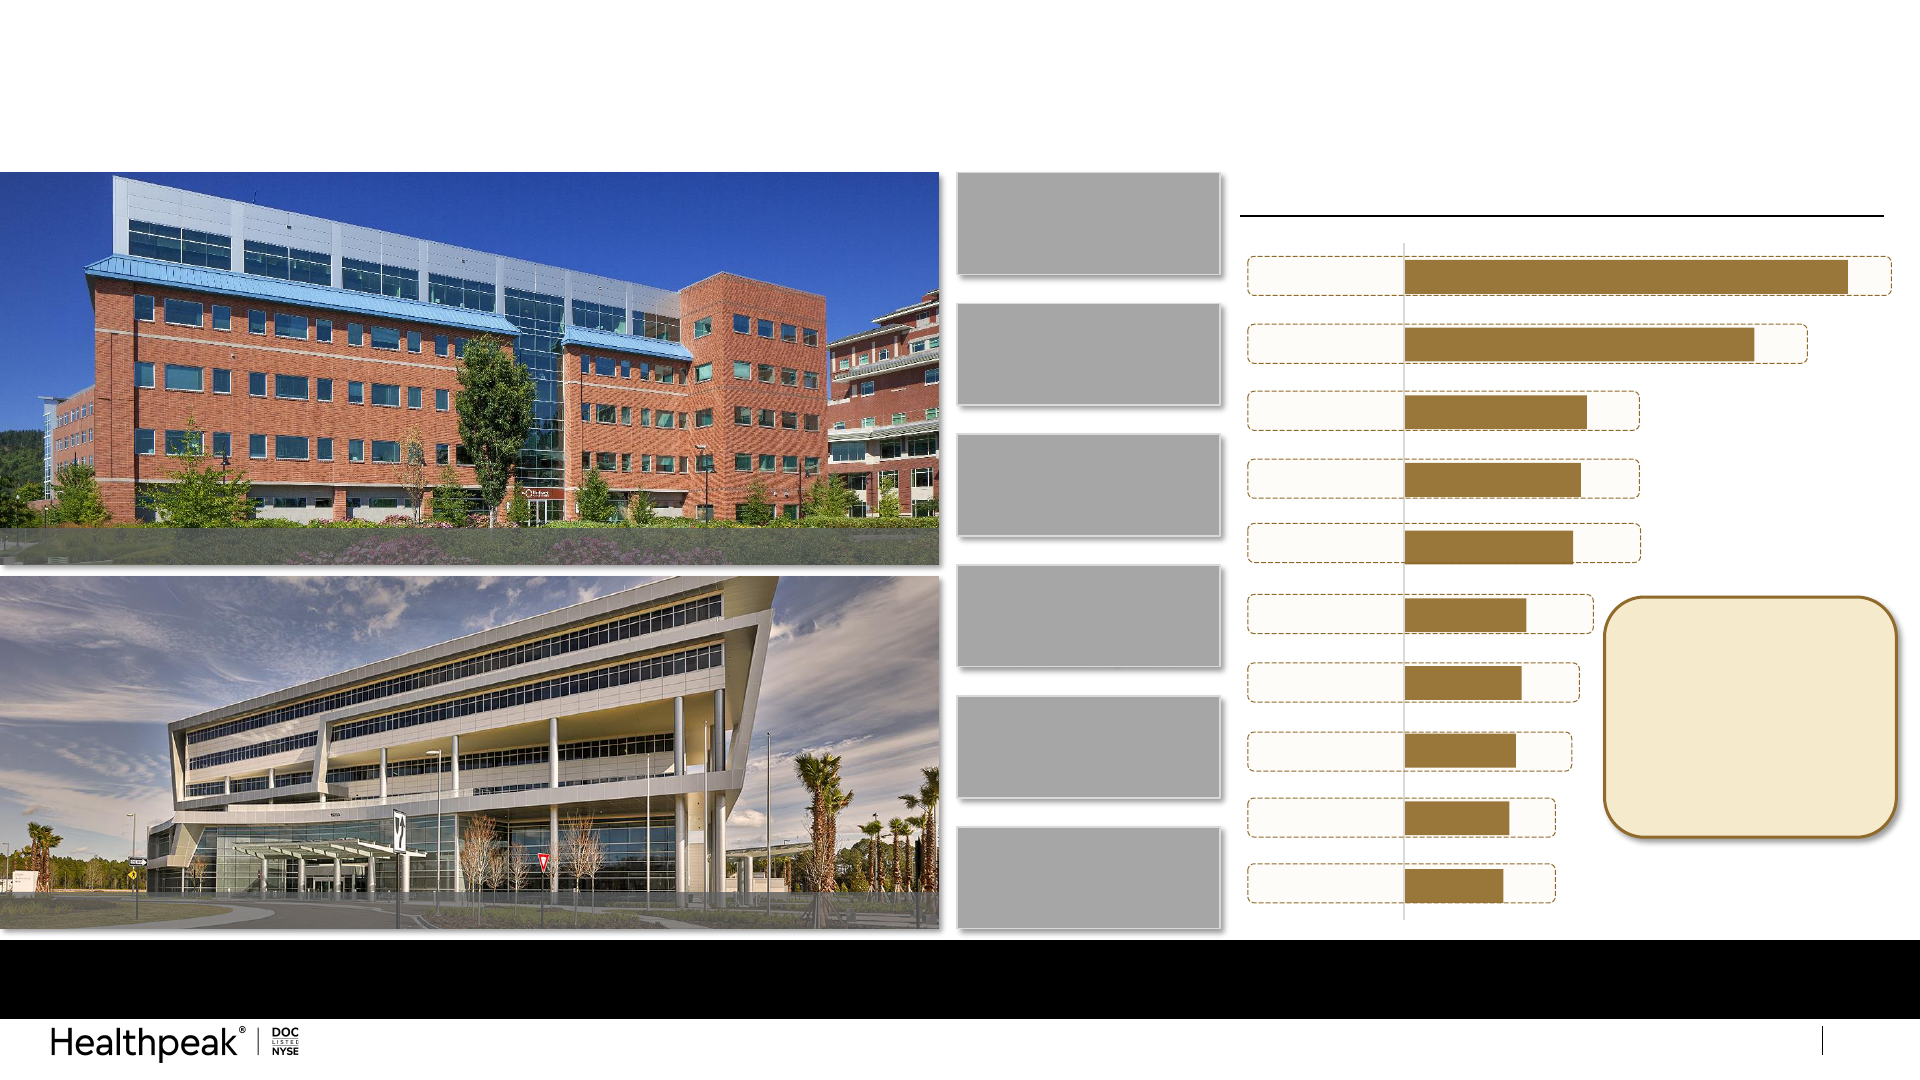
4.6
3.6
1.9
1.8
1.8
1.3
1.2
1.2
1.1
1.0
Dallas, TX
Houston, TX
Louisville, KY
Nashville, TN
Phoenix, AZ
Philadelphia, PA
Denver, CO
Atlanta, GA
Seattle, WA
Minneapolis, MN
Unmatched Outpatient Medical Platform and Portfolio
14
40M sq. ft. Outpatient Medical portfolio with concentration in high-growth markets and local competitive advantage
UF Health North Medical Building | Jacksonville, FL
Top 10 Healthpeak Outpatient Medical MSAs
(Based on square footage in millions)
95%
On-Campus or Affiliated
~30M+
Annual Patient Visits
10/10
Relationships With Top
10 Health Systems
575
Properties
40M
Sq. Ft.
~60%
Investment Grade
(1)
Considerable opportunity to internalize property management and generate earnings upside
1) Calculated as leased investment grade square footage over total leased square footage. Represents companies with a credit rating -, and Fitch: BBB- or higher. Also includes investment grade quality
tenants without public debt outstanding. Investment grade quality tenants without public debt outstanding represents ~2%.
Northwest Specialty Center | Springfield, OR
Internalized property
management in Phoenix
and Dallas in Q1; targeting
Louisville, Nashville,
Seattle, Chicago, and
Indianapolis during Q2
with additional markets
over time
Investor Presentation March 2024
3.5%
4.7%
2010 - 2019 average 2022 - 2030E average
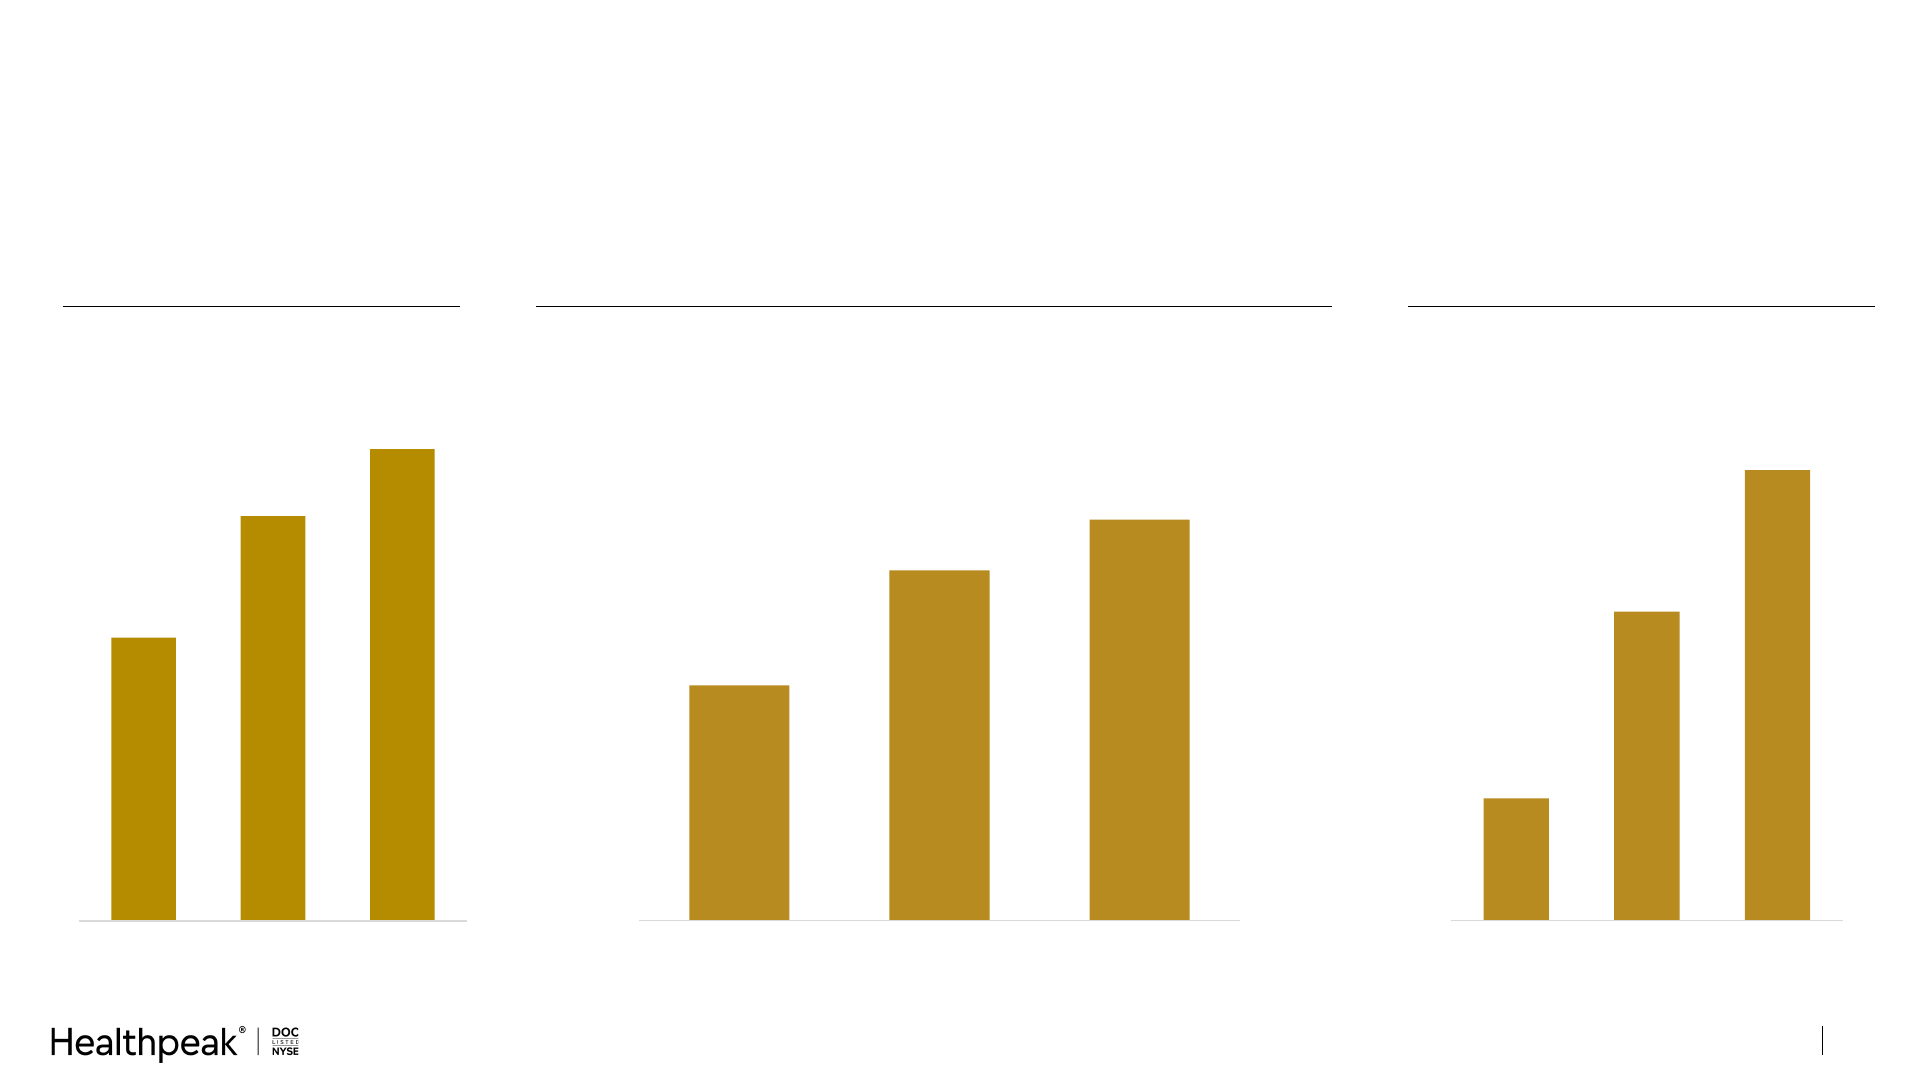
Outpatient Medical Demand Drivers are Stronger Than Ever
15
Aging Senior Population
(US age 65+ in millions)
Average Annual Growth in Health Expenditures
(per capita
(1)
)
Outpatient Visits Growing
(per 1,000 population)
Investor Presentation March 2024
41
59
69
2011 2023 2031E
2,100
2,400
2,850
2010 2022 2032E
The structural trends of an aging population and the growth in healthcare spending support continued growth in lower-
cost outpatient care settings, which should generate long-term demand for our real estate
Sources: Stratodem, CDC, KFF, and Advisory Board estimates.
1) 2020 and 2021 excluded from the averages due to the one-time impact on health expenditures related to COVID.
Average growth in annual spending expected to
accelerate compared to the prior decade
10.4
13.7
2019 2023
14.0
7.9
2019 2023
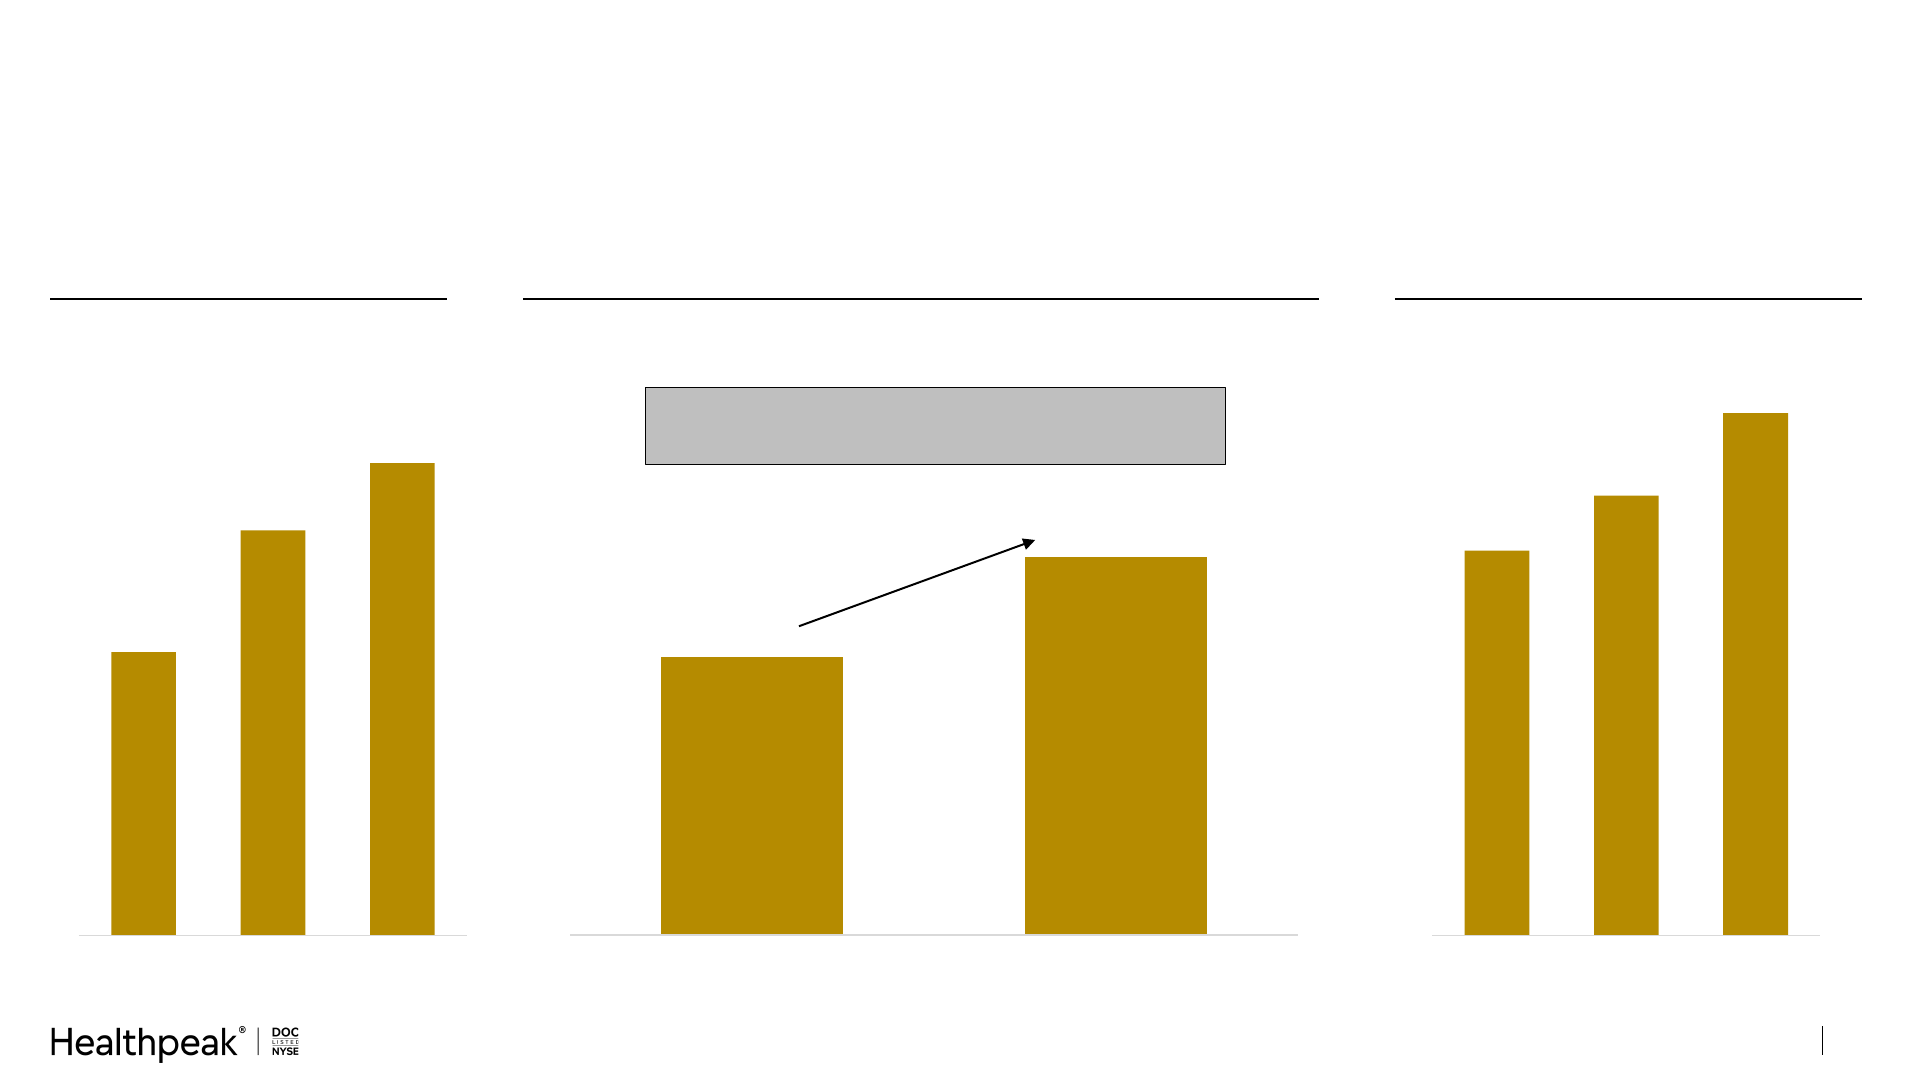
Outpatient Medical Fundamentals Driving Improved Growth
16
Increasing Absorption
(TTM absorption in sq. ft. millions)
Declining Development Starts
(TTM starts in sq. ft. millions)
Sector Occupancy Trending Higher
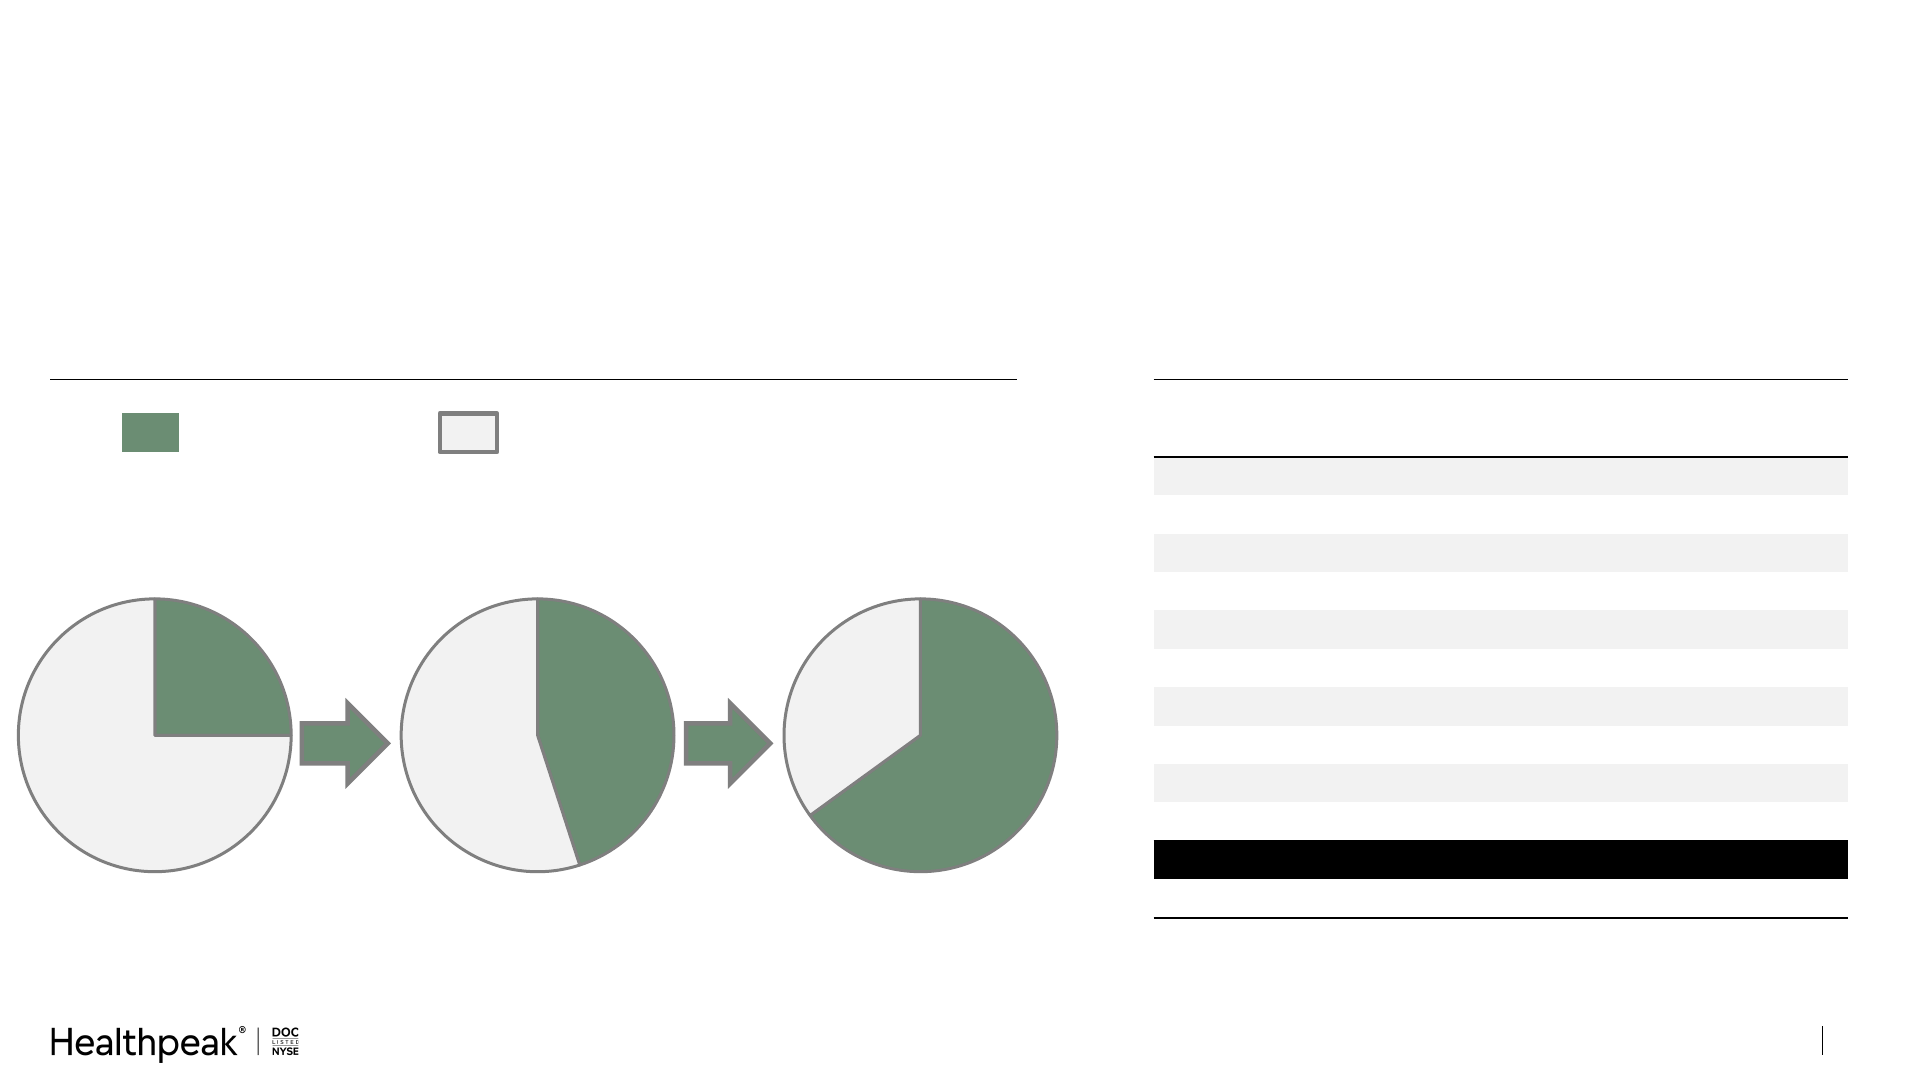
91.3%
92.6%
2019 2023
Healthpeak’s Rent Mark
-to-Market Increasing
(1)
(Cash lease spreads on renewals)
Sources: Absorption, development start and occupancy data from Revista.
1) Includes both Healthpeak and Physicians Realty Trust combined outpatient portfolios.
2) Average same-
Investor Presentation March 2024
Up ~30%
Down ~40%
Up 130 bps
Up 200 bps
Demand exceeds supply and is generating increased occupancy and rent growth, which we expect to continue
Healthpeak’s Outpatient Same-Store Growth
(2)
2.5%
3.5%
2013 - 2020 Average 2021 - 2023 Average
Up 100 bps
2%
4%
2018 - 2022 Average 2023
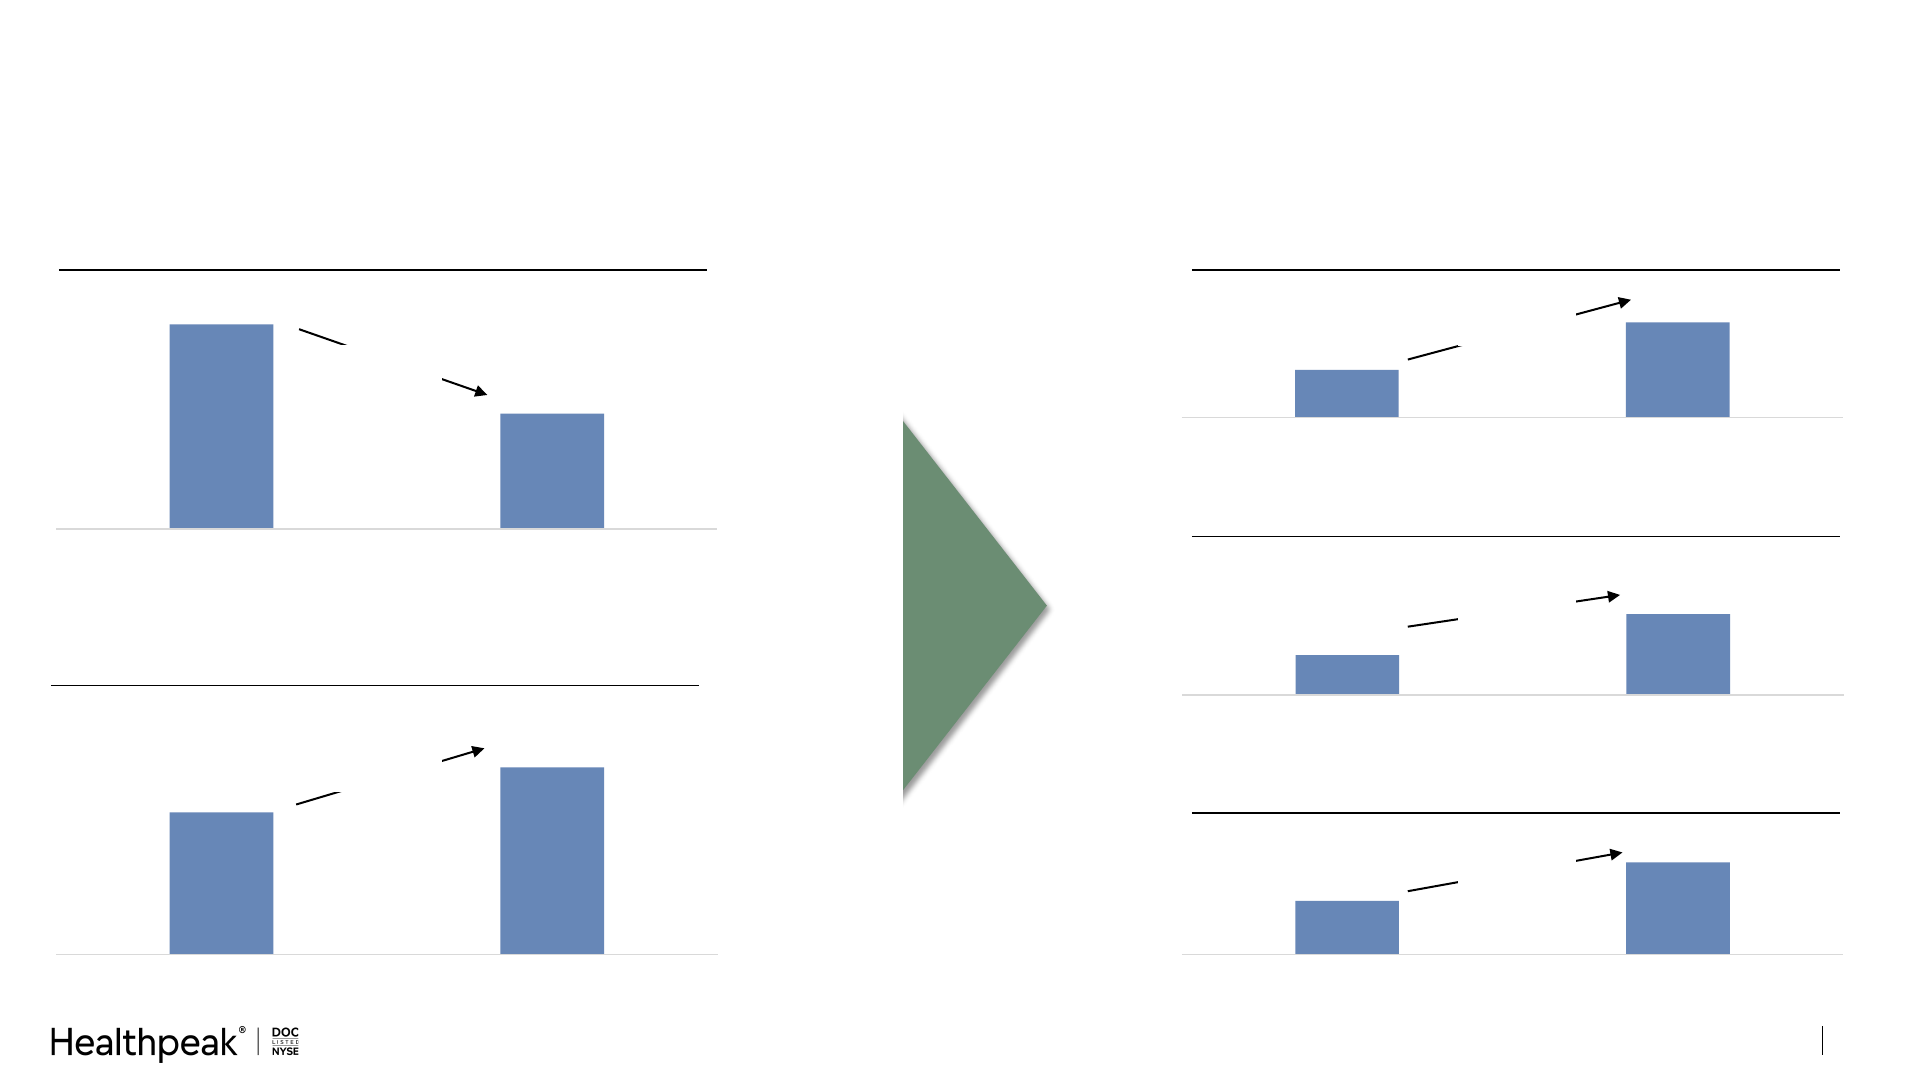
Strong Tenant Credit and Importance of Relationships
17
Space in Our Portfolio Leased by Health Systems Has More Than
Doubled
1) 2023 is based on Healthpeak and Physicians Realty Trust combined outpatient portfolio.
2) Healthpeak and Physicians Realty Trust combined outpatient portfolio.
3) U.S. physician breakdown from AAMC, 2022 Physician Specialty Data Book.
Focus on Specialty Physicians and Services Limits
Competition from Retail Clinics or Telemedicine
Types of Specialties
Healthpeak
(2)
National
Benchmark
(3)
Orthopedics 11% 4%
Oncology 10% 3%
Ambulatory Surgery Center 9% N/A
Obstetrics / Gynecology 7% 5%
Cardiovascular 6% 4%
General / Specialty Surgery 6% 4%
Imaging / Radiology 6% 3%
Ophthalmology 3% 2%
Neurology 3% 2%
Other 23% 40%
Total Specialties
84% 67%
Primary Care
16% 33%
2003 2023
(1)
25% 66%
Health Systems Other Physicians & Outpatient Services
Investor Presentation March 2024
Health systems have significantly expanded their outpatient footprint as healthcare delivery has shifted to an
outpatient model; the growth in outpatient is likely to continue and no company is better positioned to support this
growth than Healthpeak
2013
45% 65%25%

Lab
Overview
Concentrated Lab Clusters Across the Leading Markets
19
Well-located portfolio of amenity-rich spaces for R&D and collaboration
Embedded long-term growth opportunities from well-located, developable land sites across leading lab submarkets
97%
Occupied
Operating Portfolio
~5M+ Sq. Ft.
Future Development
Densification Potential
85%
ABR from Campuses
over 400,000 Sq. Ft.
146
Properties
12M
Lab Sq. Ft.
Investor Presentation March 2024
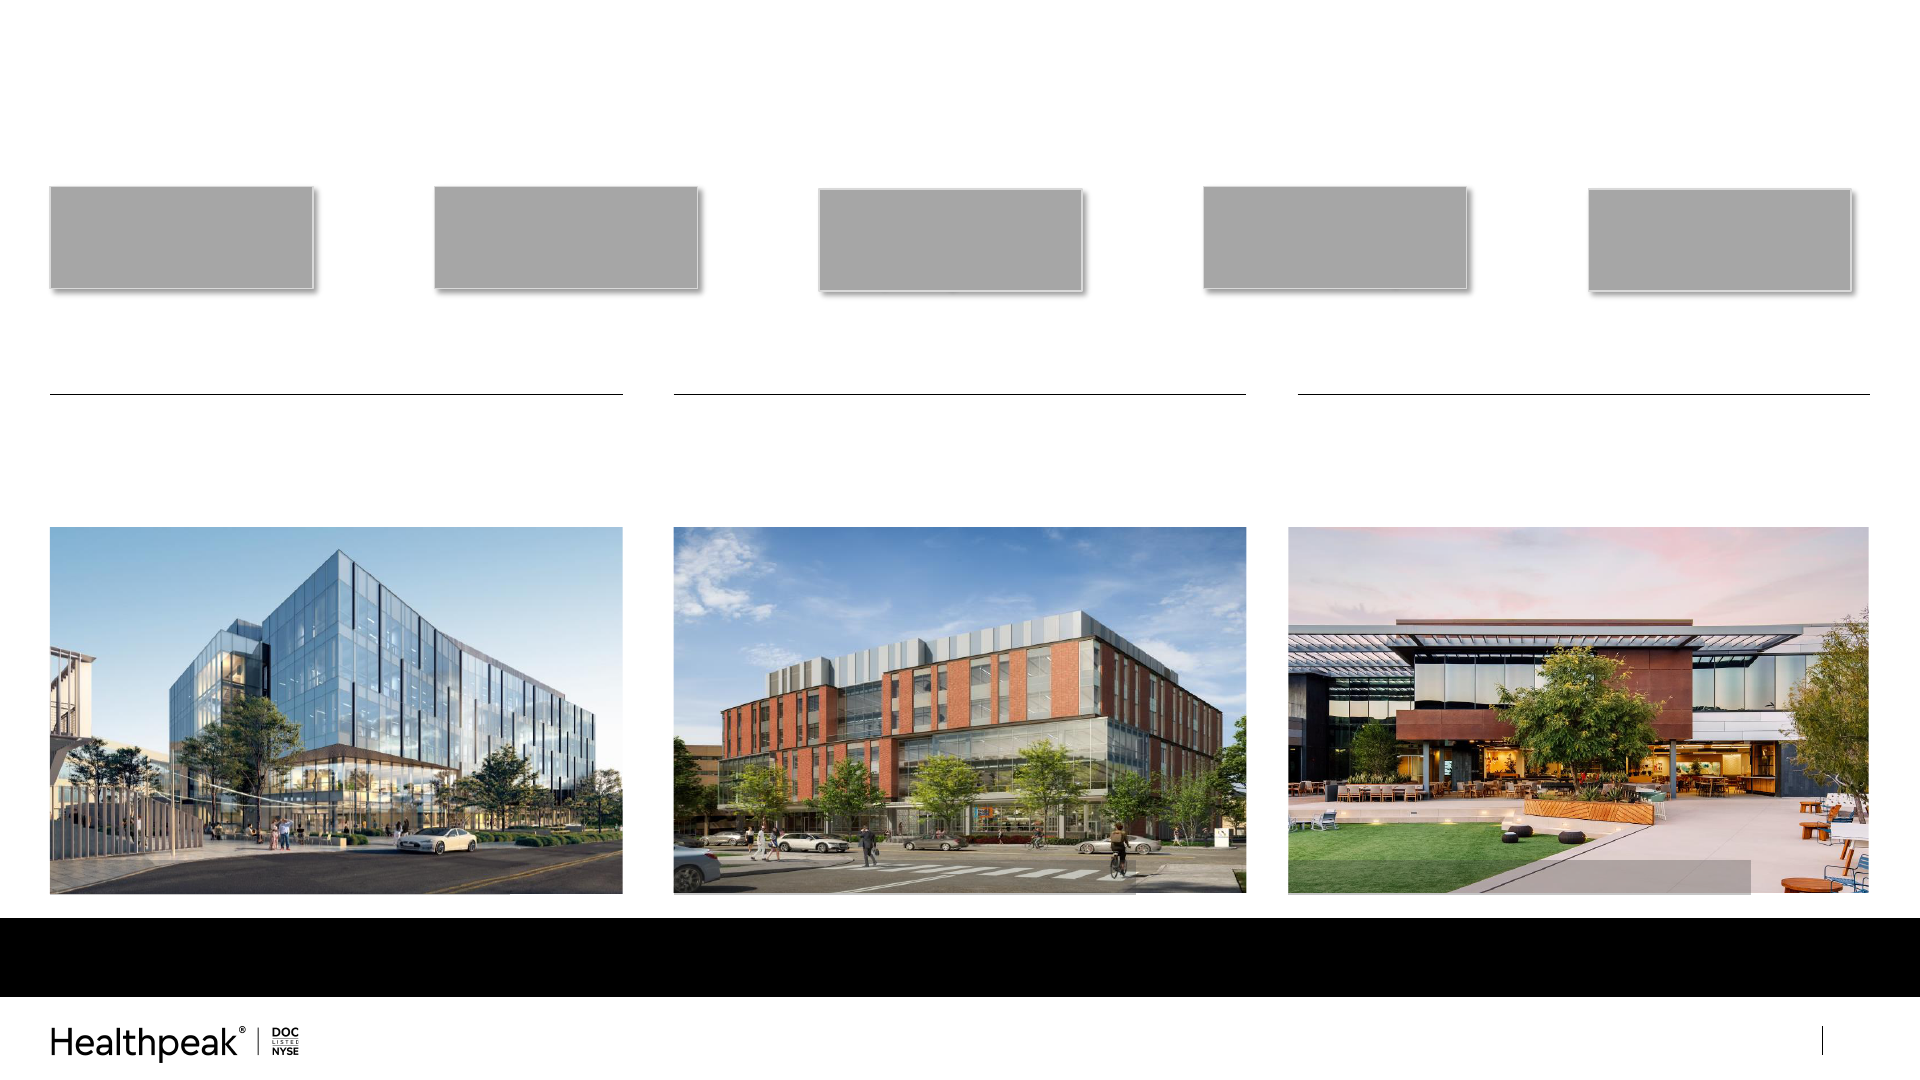
Nexus on Grand | South San Francisco, CA 101 CambridgePark Drive | Cambridge, MA
Bay Area
Preeminent lab real estate owner in
South San Francisco
Boston
Cambridge and Lexington focused portfolio
with a pathway to significant future growth
San Diego
Strategically positioned in Torrey Pines and
Sorrento Mesa
The Boardwalk | Torrey Pines, CA
Aging Senior Population
(US age 65+ in millions)
Positive Long-Term Demand Drivers for Lab
Sources: Stratodem, Evaluate Pharma, Precedence Research, BLS, CMS.gov, Healthpayer Intelligence.
20
Increasing Drugs Approvals
(New Drugs Approved by the FDA)
Growing Global Drug Demand
(Global Pharmaceutical Drug Sales in $B)
Investor Presentation March 2024
41
59
69
2011 2023 2031E
$741
$1,880
$2,740
2011 2023 2031E
143
213
244
2009-2013 2014-2018 2019-2023
With an aging population and accelerating scientific discovery and drug approvals, we expect a long-term virtuous
cycle that will support ongoing demand for our real estate
192
207
254
275
287
293
45
47
50
51
55
59
18
18
30
41
26
22
26
24
65
46
24
29
16
21
41
41
42
41
51
51
$341B
$351B
$469B
$483B
$453B
$461B
$0B
$100B
$200B
$300B
$400B
$500B
$600B
2018 2019 2020 2021 2022 2023
2018 – 2022 Average: ~$420B
Supportive Biopharma Capital Raising and R&D Trends
Source: DealForma, S&P Global, NIH.gov, Giving USA
1) Only includes partnership funding with disclosed financial details; majority of partnership financial commitment details are not publicly available.
2) 2023 reflects 2022 data as 2023 data is still pending.
3) 2023 Global Biopharma R&D represents annualized 3Q23 YTD data due to 4Q23 data pending.
21
Global Biopharma R&D NIH/NSF VC SEO IPO Partnerships
(1)
Healthcare Philanthropy
Investor Presentation March 2024
The lab industry benefits from diversified funding sources; 2023 funding was above the 2018-2022 average
(2)
(3)
Biotech Public Equity Funding Up Significantly YoY
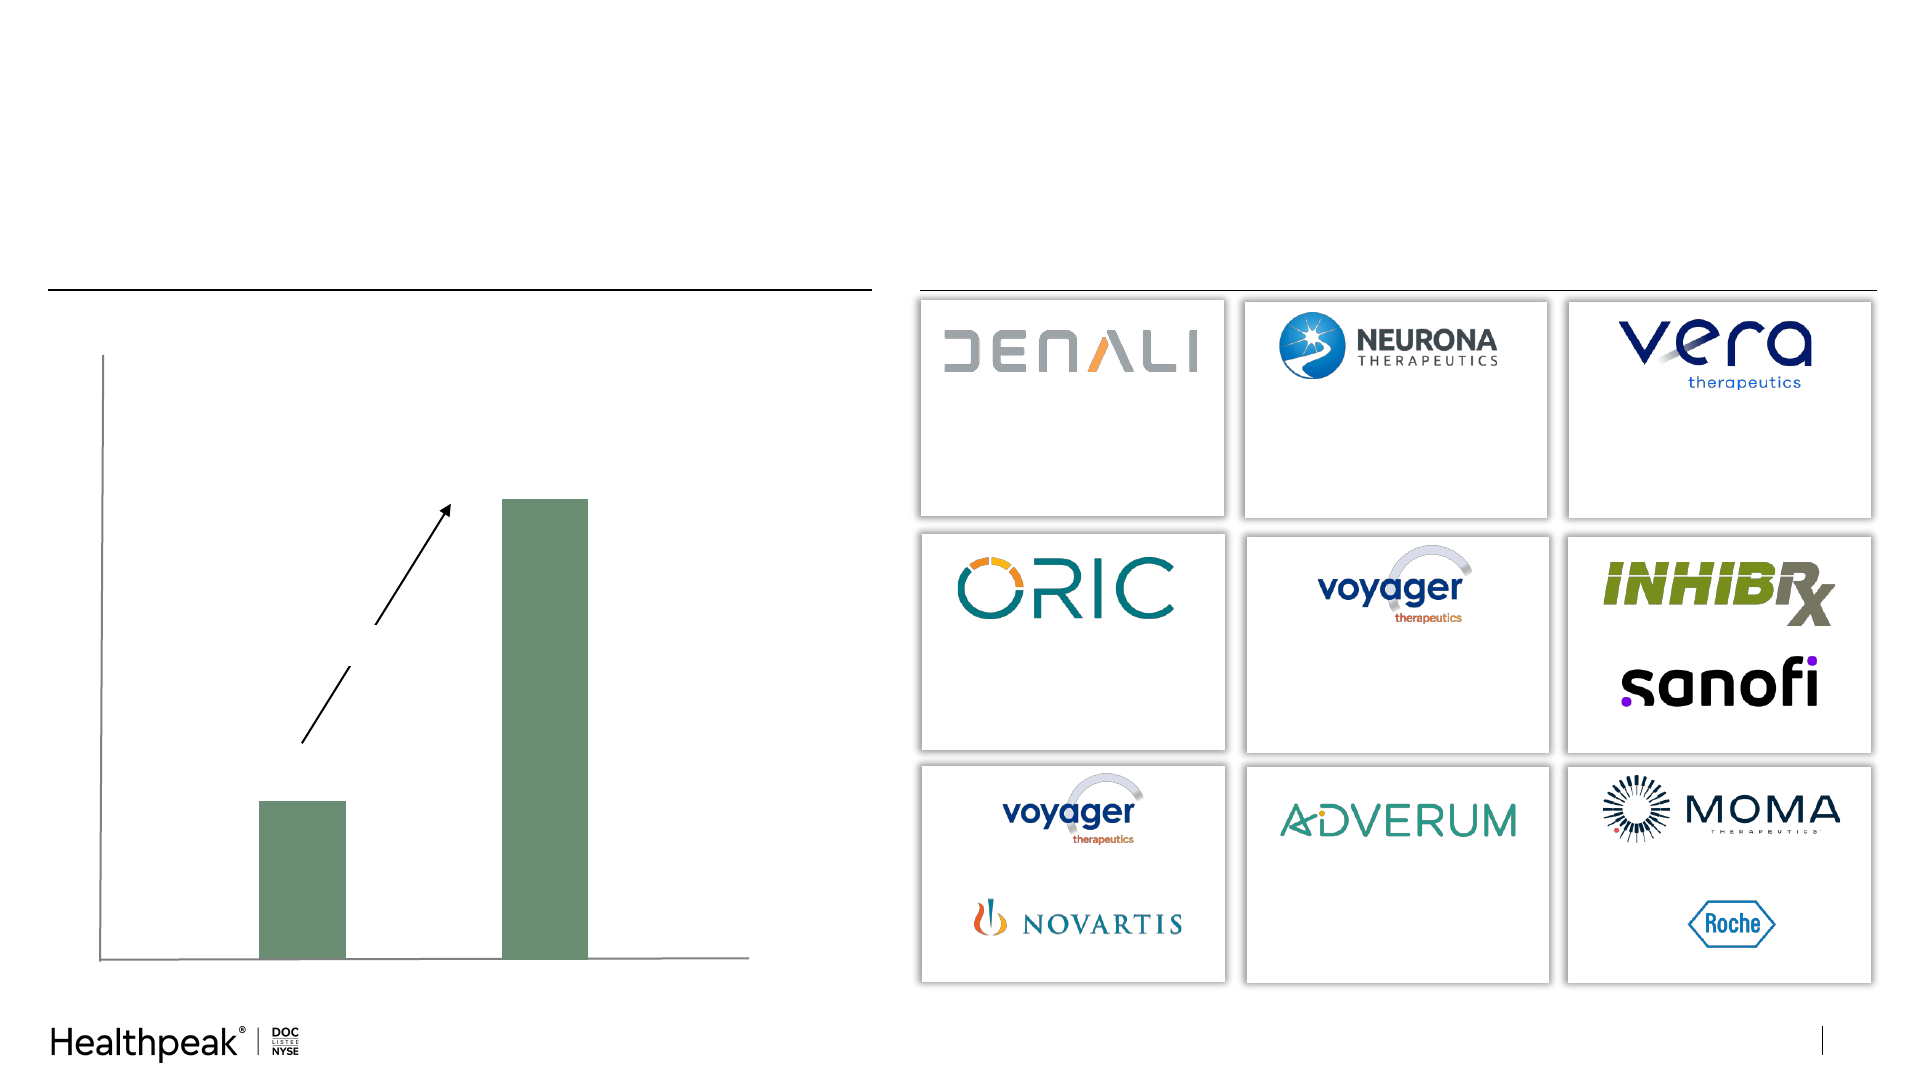
Select Healthpeak Tenant Capital Raise
Activity
Recent Lab Capital Raising Trends Improving Tenant Credit
22
$0
$15
$12B | 68 deals
Sources: Baird Weekly Biotech Update as of 2/26/24 and public disclosures.
February 2024
VC Funding
$120M
January 2024
$66M upfront
partnership with
January 2024
$125M
Follow-On
Equity Offering
January 2024
$100M
Follow-On
Equity Offering
January 2024
$2.2B acquisition by
February 2024
$287.5M
Follow-On
Equity Offering
Jan to Feb 2023
$4B | 36 deals
January 2024
$100M upfront
partnership with
February 2024
$127.5M
Follow-On
Equity Offering
Investor Presentation March 2024
The positive momentum in biotech valuations has led to an active funding market to start 2024; expected to contribute
towards improved levels of space demand over next 6-12 months
February 2024
$500M
Follow-On
Equity Offering
Jan to Feb 2024
Up 200%
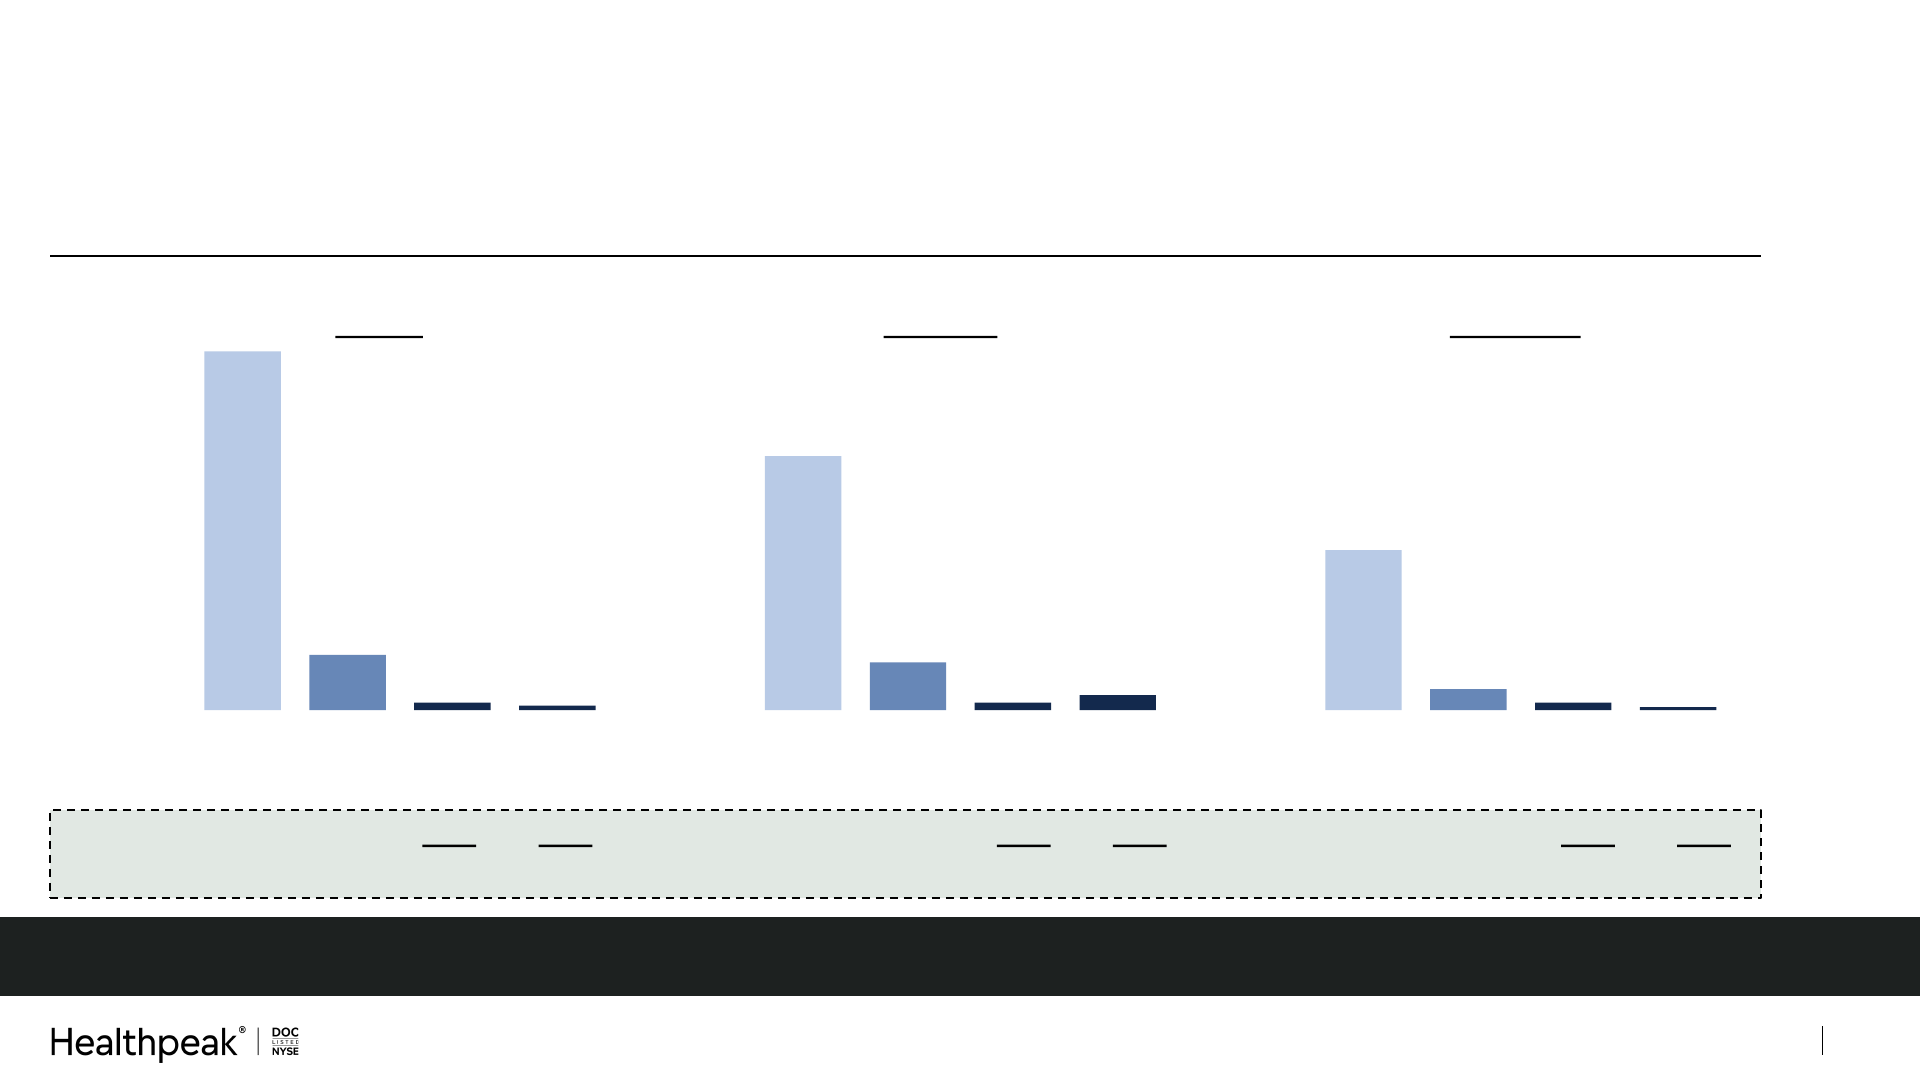
Competitive New Supply
Healthpeak’s near-term lease roll is modest; speculative development starts have fallen to near zero which should
provide a multi-year window beyond ’25 of limited deliveries allowing for further market stabilization and recovery
2024
2025
0.0%
1.0%
23
Boston Bay Area San Diego
Healthpeak Expirations
(% of total lab sq. ft.)
2024
2025
3.0%
(2)
4.3%
2024
2025
0.4%
4.9%
Lab Inventory and
New Supply by Market
(1)
Sorted by market inventory (sq.
ft. in millions)
1) -Cambridge, San Francisco Bay Area, and San Diego. Under Construction includes new development, conversions,
speculative and build-to-suit projects. 2024 & 2025 Unleased Competitive Supply based on Healthpeak assessment of submarket, building quality, sponsorship and other qualitative factors to determine the
relative competitive profile of each development. A portion of the Under Construction pipeline could be partially competitive, but not directly competitive, based on the factors mentioned above.
2) Excludes 250,000 sq. ft. planned to enter redevelopment upon lease expiration on the Portside and Pointe Grand campuses.
Headline new supply numbers include projects that we believe are not directly competitive due to a combination of submarket locations,
inferior building design & capability, and / or sponsorship by developers with limited credibility and footprint
Total
Market
Inventory
Total
Under
Construction
Unleased Competitive
Supply
2024 2025
Total
Market
Inventory
Total
Under
Construction
Unleased Competitive
Supply
2024 2025
Total
Market
Inventory
Total
Under
Construction
Unleased Competitive
Supply
2024 2025
Investor Presentation March 2024

Sustainable
and
Responsible Business
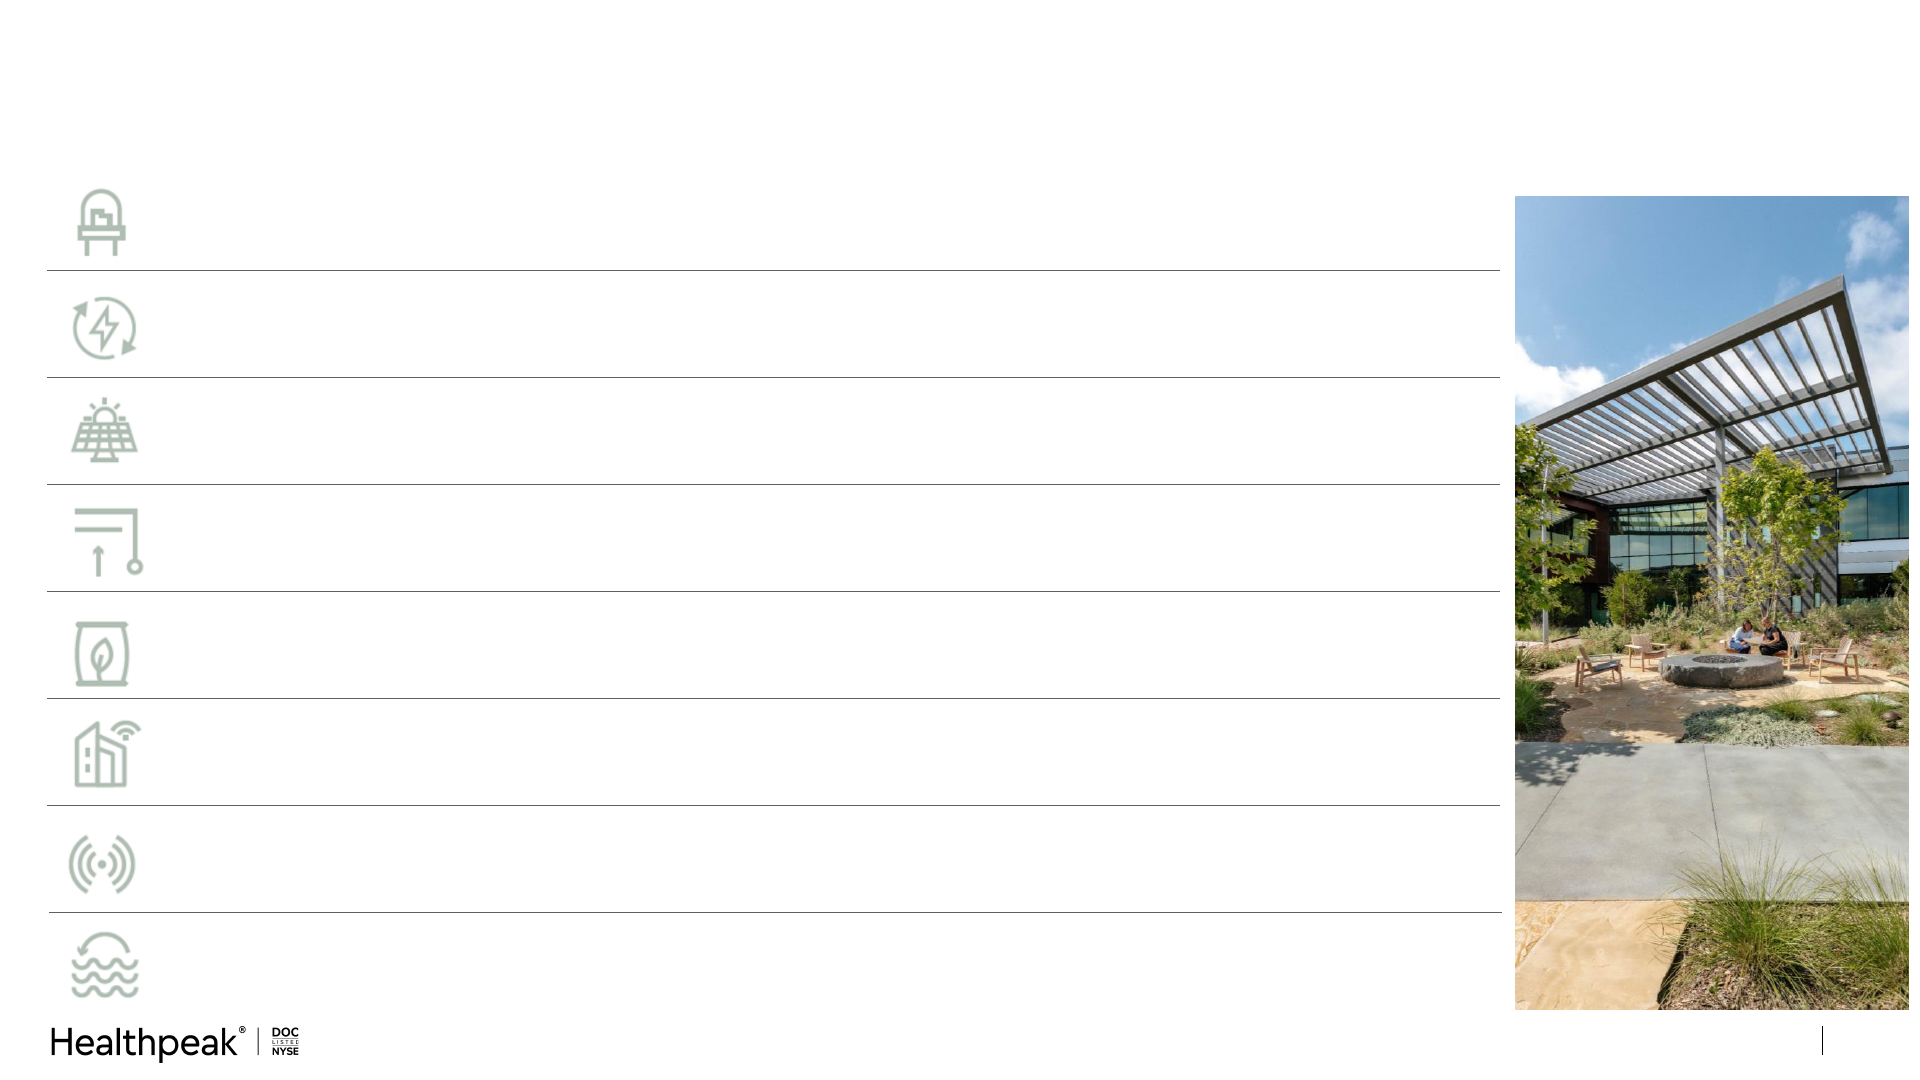
Sustainability in Action
Improving our portfolio through sustainability initiatives
25
LED Lighting
Energy-Efficient
HVAC Systems
Renewable
Energy
Window Film &
Smart Windows
Recycling &
Composting
Occupancy
Sensors
Smart Building
Technology
Water
Conservation
Optimize energy efficiency by using LED lighting in new construction and through retrofits
Implement upgrades and replacements to help drive energy savings, including boiler retrofits,
compressor replacements, adding variable frequency drives and whole system replacements
Utilize on-site renewables such as solar and off-site renewables such as wind power when
feasible and procure offsite renewable energy through renewable energy certificates
Install energy-saving window films and use "smart" view glass windows to automatically control
temperature and glare
Work with property managers and tenants to implement best practices for waste management
and landfill diversion, including recycling and composting
Install occupancy sensors in our properties to reduce energy usage
Use self-regulating electrical systems that adjust automatically based on feedback from the
surrounding environment, increasing power grid efficiency and cost-effectiveness
Maximize water savings through drought-tolerant landscaping, drip irrigation, smart controllers,
low-flow sprinkler heads, efficient plumbing fixtures and condensate recovery systems
Investor Presentation March 2024

Environmental
Social
Governance
Governance Intelligence and
IR Magazine
Winner – Best Proxy
Statement (Mid Cap)
Finalist – Best ESG
Reporting (Mid Cap)
Fortune Best Workplaces in Real Estate
2 Consecutive Years
CDP Leadership Band
11 Consecutive Years
S&P Global
Dow Jones Sustainability World Index
4 Times
Dow Jones Sustainability N. America Index
11 Consecutive Years
Sustainability Yearbook
9 Consecutive Years
Newsweek
Responsible Companies
5 Times
Bloomberg Gender-Equality Index
4 Consecutive Years
20/20 Women on Boards
Board Diversity Recognition
5 Times
MSCI Rating
AA
Recognized Leader in Corporate Responsibility
GRESB Green Star Rating
12
Consecutive Years
FTSE4Good Index Series
12
Consecutive Years
Top / Best Place to Work Recognitions
Orange County, Milwaukee and Tennessee
Great Place to Work Certified
4 Consecutive Years
ISS ESG Corporate Rating
Prime
Top 10% QualityScore
Score of “1”
ENERGY STAR Partner of the Year
3 Times
Green Lease Leader
Platinum
Modern Healthcare Best Places to Work
3 Times
Reflects recognitions of each legacy company prior to the completion of the merger.
26Investor Presentation March 2024