
June 6, 2024
Q1 FY2025
Investor Presentation

© Samsara Inc.
The trademarks included herein are the property of the owners thereof and are used for reference purposes only. Such use should
not be construed as an endorsement of the platform and products of Samsara.
This presentation also includes certain non-GAAP financial measures, which have not been prepared in accordance with
generally accepted accounting principles in the United States (“GAAP”). These non-GAAP financial measures are in addition to,
and not as a substitute for, or superior to, financial measures calculated in accordance with GAAP. There are a number of
limitations related to the use of these non-GAAP financial measures versus their nearest GAAP equivalents. For example, other
companies may calculate non-GAAP financial measures differently or may use other measures to evaluate their performance, all
of which could reduce the usefulness of our non-GAAP financial measures as tools for comparison. Please see the Appendix for
reconciliations of these non-GAAP financial measures to their nearest GAAP equivalents.
Our adjusted revenue is defined as revenue excluding the impact of an additional week of revenue in Q4 FY24 by multiplying Q4
FY24 revenue by 13/14. Since our Q4 FY24 was a 14-week fiscal quarter instead of a typical 13-week fiscal quarter, we believe
that adjusted revenue and adjusted revenue growth rate enable comparability across periods. Our non-GAAP gross profit is
defined as gross profit excluding the effect of stock-based compensation expense-related charges, including the amortization of
deferred stock-based compensation expense for capitalized software and employer taxes on employee equity transactions,
included in cost of revenue and non-GAAP gross margin is defined as non-GAAP gross profit as a percentage of total revenue.
We believe that non-GAAP gross profit and non-GAAP gross margin provide useful information to our management and investors
and comparability with our past financial performance and facilitate period-to-period comparisons of operations. We define
non-GAAP sales and marketing expense, non-GAAP research and development expense, and non-GAAP general and
administrative expense as sales and marketing expense, research and development expense, and general and administrative
expense, respectively, excluding the effect of stock-based compensation expense-related charges, including employer taxes on
employee equity transactions. Non-GAAP sales and marketing margin, non-GAAP research and development margin, and
non-GAAP general and administrative margin are defined as non-GAAP sales and marketing expense, non-GAAP research and
development expense, and non-GAAP general and administrative expense, respectively, as a percentage of total revenue.
Non-GAAP operating income (loss) is defined as income (loss) from operations excluding the effect of stock-based
compensation expense-related charges, including the amortization of deferred stock-based compensation expense for
capitalized software and employer taxes on employee equity transactions, lease modification, impairment, and related charges,
and legal settlements. Non-GAAP operating margin is defined as non-GAAP operating income (loss) as a percentage of total
revenue. We believe that non-GAAP operating expenses and non-GAAP operating income (loss) provide our management and
investors consistency and comparability with our past financial performance and facilitate period-to-period comparisons of
operations. Free cash flow is defined as net cash provided by (used in) operating activities reduced by cash used for purchases
of property and equipment. Free cash flow margin is calculated as free cash flow as a percentage of total revenue. Adjusted free
cash flow is defined as free cash flow excluding the cash impact of non-recurring capital expenditures associated with the
build-out of our corporate office facilities in San Francisco, California, net of tenant allowances, and legal settlements. Adjusted
free cash flow margin is calculated as adjusted free cash flow as a percentage of total revenue. We believe that these measures
are useful in evaluating liquidity and provide information to management and investors about our ability to fund future operating
needs and strategic initiatives by excluding the impact of non-recurring events.
A reconciliation of non-GAAP guidance financial measures to corresponding GAAP guidance financial measures is not available
on a forward-looking basis without unreasonable effort due to the uncertainty and potential variability of expenses, such as
stock-based compensation expense-related charges and timing of capital expenditures, that may be incurred in the future and
cannot be reasonably determined or predicted at this time. It is important to note that these factors could be material to our
results of operations computed in accordance with GAAP.
Disclaimer and Statement Regarding Use of Non-GAAP Measures
This presentation contains forward-looking statements within the meaning of Section 27A of the Securities Act of 1933 and
Section 21E of the Securities Exchange Act of 1934. These statements may relate to, but are not limited to, expectations of
future operating results or financial performance, market size and growth, industry developments and trends, the calculation of
certain of our financial and operating metrics, capital expenditures, plans for future operations, including expansion into new
geographies and products, headcount and productivity growth, macroeconomic conditions, competitive position, technological
capabilities, including AI, inventory capacity and supply chain conditions, customer adoption of and expected results from our
Connected Operations Cloud, including cost-savings and return on investment, and strategic relationships, as well as
assumptions relating to the foregoing. Forward-looking statements are inherently subject to risks and uncertainties, some of
which cannot be predicted or quantified and could cause actual results and events to differ. In some cases, you can identify
forward-looking statements by terminology such as “may,” “will,” “should,” “could,” “expect,” “plan,” anticipate,” “believe,”
“estimate,” “predict,” “intend,” “potential,” “would,” “continue,” “ongoing”, “guidance” or the negative of these terms or other
comparable terminology. You should not put undue reliance on any forward-looking statements. Forward-looking statements
should not be read as a guarantee of future performance or results and will not necessarily be accurate indications of the
times at, or by, which such performance or results will be achieved, if at all. Forward-looking statements are based on
information available at the time those statements are made, including information furnished to us by third parties that we
have not independently verified, and/or management’s good faith beliefs and assumptions as of that time with respect to
future events and are subject to risks and uncertainties that could cause actual performance or results to differ materially from
those expressed in or suggested by the forward-looking statements. In light of these risks and uncertainties, the future events
and circumstances discussed in this presentation may not occur and actual results could differ materially from those
anticipated or implied in the forward-looking statements. These risks and uncertainties include our ability to retain customers
and expand the Applications used by our customers, our ability to attract new customers, our future financial performance,
including trends in revenue and annual recurring revenue (“ARR”), annual contract value (“ACV”), net retention rate, costs of
revenue, gross profit or gross margin, operating expenses, customer counts, non-GAAP financial measures (such as adjusted
revenue, adjusted revenue growth rate, non-GAAP gross margin, non-GAAP operating margin, free cash flow, adjusted free cash
flow, and adjusted free cash flow margin), our ability to achieve or maintain profitability, the demand for our products or for
solutions for connected operations in general, the Russia-Ukraine conflict, geopolitical tensions involving China, the conflict in
Israel and Gaza, the emergence of pandemics and epidemics, and other macroeconomic conditions globally on our and our
customers’, partners’ and suppliers’ operations and future financial performance, possible harm caused by silicon component
shortages and other supply chain constraints, the length of our sales cycles, possible harm caused by a security breach or
other incident affecting our or our customers’ assets or data, our ability to compete successfully in competitive markets, our
ability to respond to rapid technological changes, and our ability to continue to innovate and develop new Applications. The
forward-looking statements contained in this presentation are also subject to other risks and uncertainties, including those
more fully described in our filings and reports that we may file from time to time with the Securities and Exchange
Commission, including our Annual Reports on Form 10-K and Quarterly Reports on Form 10-Q. Except as required by law, we do
not undertake any obligation to publicly update or revise any forward-looking statement, whether as a result of new
information, future developments or otherwise.
This presentation contains statistical data, estimates and forecasts that are based on publicly available information or
information and data furnished to us by third parties such as our customers, as well as other information based on our internal
sources. While we believe the information and data included in this presentation are based on reasonable assumptions, this
information involves many assumptions and limitations, and you are cautioned not to give undue weight to these estimates.
We have not independently verified the accuracy or completeness of the information and data provided by third parties, and
other publicly available information. Accordingly, we make no representations as to the accuracy or completeness of that data
nor do we undertake to update such data after the date of this presentation.

Q1 FY25
Business Highlights

To increase the safety, efficiency,
and sustainability of the operations that
power the global economy
OUR MISSION
$1,176M
Q1 FY25 ARR
37% Y/Y Growth
$19M
Q1 FY25 ADJUSTED FREE CASH FLOW
7% Adjusted FCF Margin
Figures as of Q1 FY25
Fiscal year ends on the Saturday closest to February 1
See Appendix for definitions and reconciliations, as applicable
1,964
$100K+ ARR CUSTOMERS
43% Y/Y Growth
© Samsara Inc.
Digitizing for the Future
of Connected Operations
Physical operations problems
are universal
High asset and people
intensity at scale
Legacy systems with a lack of
real-time data
Common challenges: insurance,
fuel savings, workplace accidents,
maintenance, and more
Converting pen and paper to digital
Removing data silos
Automation with robots and drones
Customers are
accelerating digitization

© Samsara Inc.
It is hard to put a number on the value of Samsara,
but it has opened up a whole new world for us.
When we are talking about services in the tens of
thousands of dollars per hour per crew, every
minute of efficiency gained is significant. As a
result of our systems with Samsara, we are now
able to operate near optimal efficiencies. Samsara
is our most utilized company-wide business
system and is responsible for millions in savings
in our bottom line.”
“Samsara has opened up a whole new world for us… Every
minute of efficiency gained is significant. Samsara is our
most utilized company-wide business system and
responsible for millions in savings in our bottom line.”
CUSTOMER INTERVIEW
Samsara Delivers
Customer Outcomes
Quote from IDC Business Value White Paper, sponsored by Samsara, The Business Value of Samsara, IDC #US52102724, and published June 2024

© Samsara Inc.
Rapid ROI and Business Impact
8x+
Return on Investment
$2M
Fleet-Related Benefits Per Organization Per Year
29%↓
Decrease in
Accidents
10%↑
Increase in
Vehicle Lifespan
20%↓
Decrease in
Idling Time
FINDINGS
Statistics from IDC Business Value White Paper, sponsored by Samsara, The Business Value of Samsara, IDC #US52102724, and published June 2024

ENVIRONMENTAL IMPACTSOCIAL IMPACT
Partnering to Build a Safer and
More Sustainable World

© Samsara Inc.
Building for the Long Term
Building a World-Class Team
Transforming the Frontline
Worker Experience
Beyond 2024

Q1 FY25
Financial Highlights
© Samsara Inc.
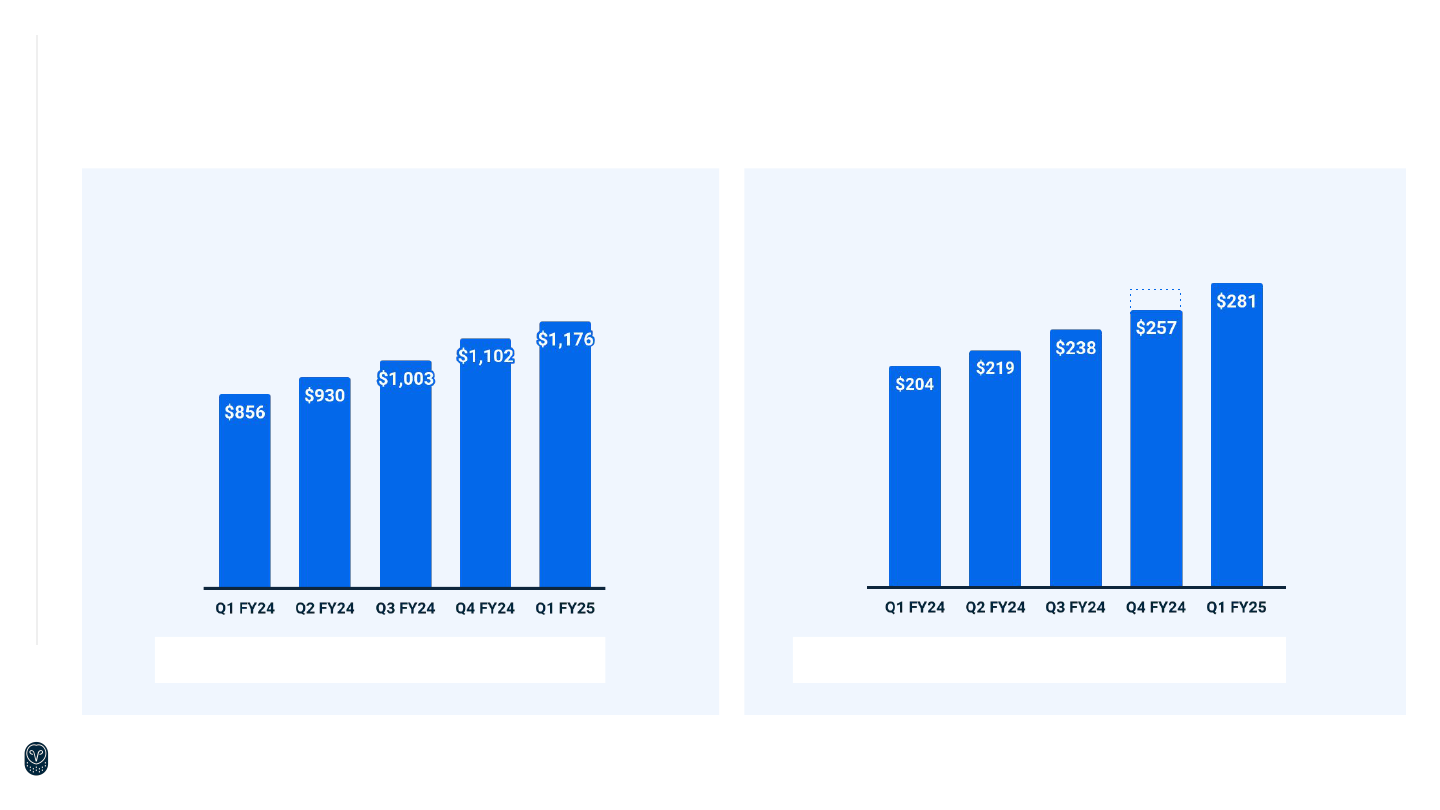
Quarterly Revenue ($M)
Y/Y
Growth
41% 40% 39% 39% 37%
Ending ARR ($M)
Y/Y
Growth
43% 43% 40% 37%¹ 37%
$20
1
$276
Rapid Growth at Scale
Fiscal year ends on the Saturday closest to February 1
See Appendix for definitions
1
Q4 FY24 was a 14-week fiscal quarter instead of a typical 13-week fiscal quarter. Adjusted revenue and adjusted revenue growth remove the impact of the additional week of revenue
recognition in Q4 FY24 to enable comparability across periods. Actual Q4 FY24 revenue was $276M, including a $20M revenue impact from the additional week.
© Samsara Inc.
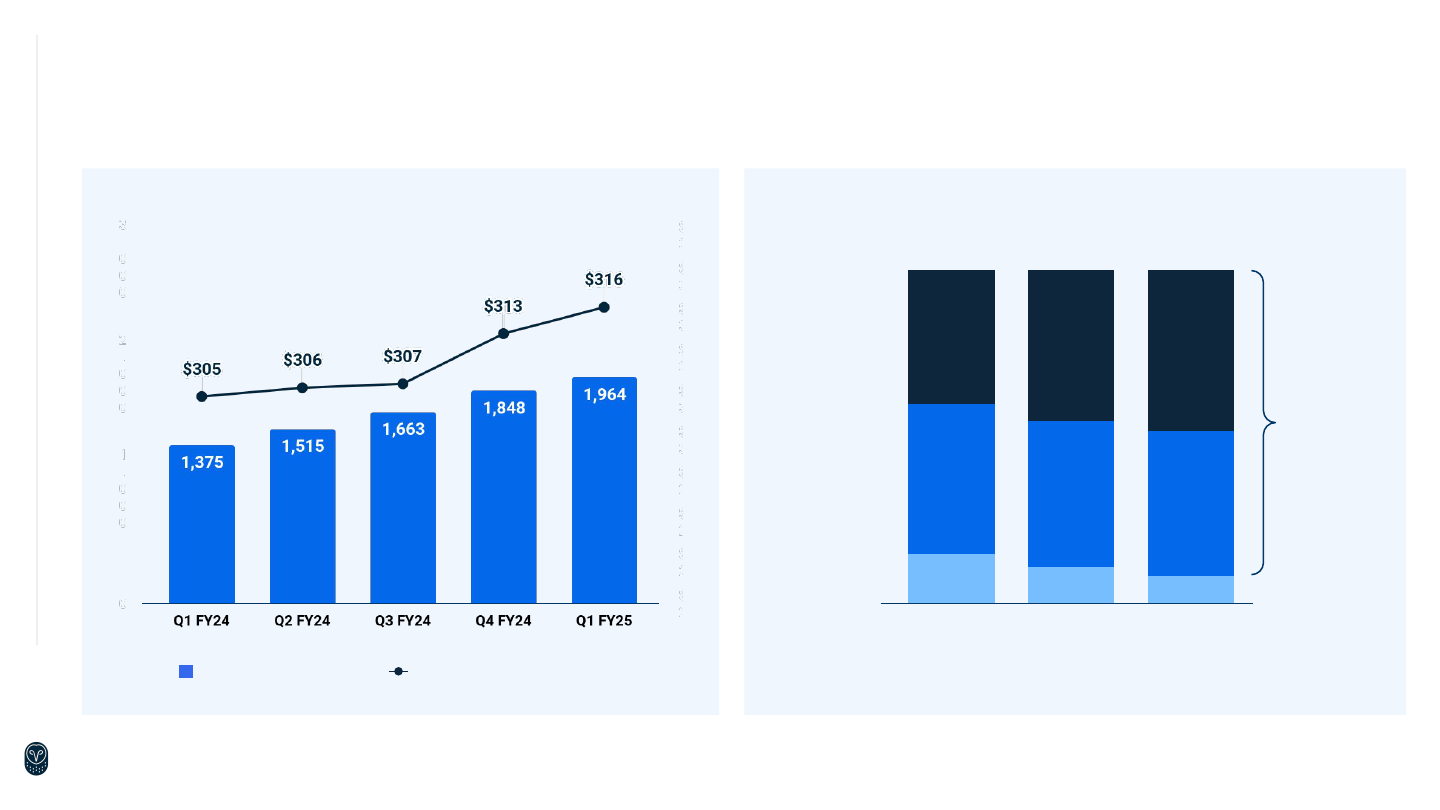
<$10K ARR
Customers
$10K–$100K
ARR Customers
$100K+ ARR
Customers
CORE
CUSTOMERS
ARR Mix
45%
42%
13%
49%
41%
10%
53%
39%
8%
Q1 FY23 Q1 FY24 Q1 FY25
$100K+ ARR customers Avg. ARR per $100K+ ARR customer ($K)
$100K+ ARR Customers
Fiscal year ends on the Saturday closest to February 1
See Appendix for definitions
Large Customer Momentum

© Samsara Inc.
VIDEO-BASED SAFETY
$450M+ ARR
30%+ y/y growth
VEHICLE TELEMATICS
$450M+ ARR
30%+ y/y growth
Multi-product Adoption at Scale
50%+
of Core Customers
($10K+ ARR)
67%+
of Large Customers
($100K+ ARR)
Multi-product customers using
Equipment Monitoring & Other
EQUIPMENT MONITORING & OTHER
$125M+ ARR
30%+ y/y growth
Figures as of Q1 FY25

© Samsara Inc.
Continued Success in New Frontiers
~$400K
Site Visibility Expansion
new smart
equipment
graphic
87%
of Q1 net new ACV from
non-transportation verticals
International Momentum End Market Diversity Emerging Products
18%
Quarterly record net new ACV mix
from international geographies in Q1
$250K+
Connected Forms Expansion
© Samsara Inc.
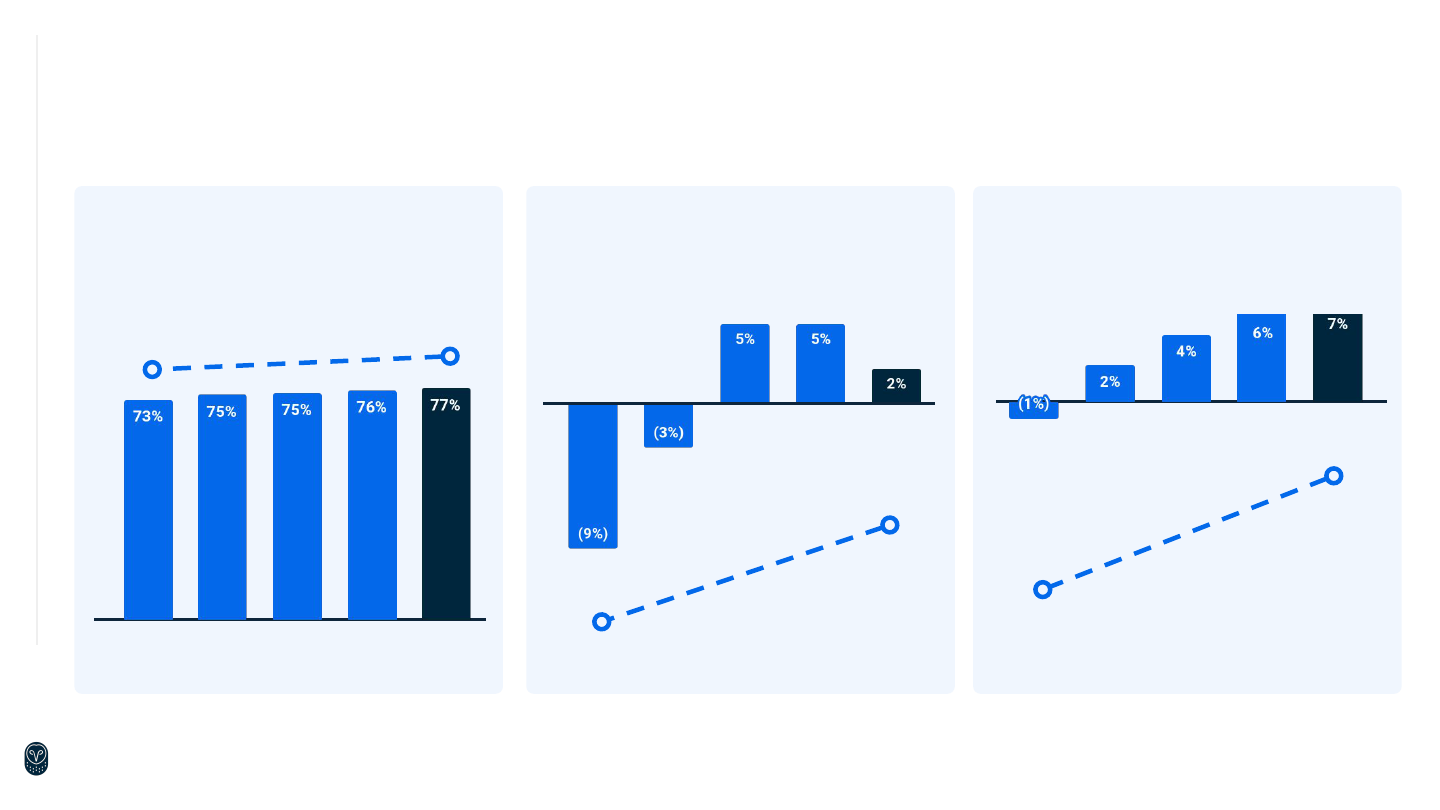
Non-GAAP Operating Margin
Non-GAAP Gross Margin
Adj. Free Cash Flow Margin
Q1 FY24
Q2 FY24
Q3 FY24
Q4 FY24
Improving Operating Efficiency
Q1 FY25
Q1 FY24
Q2 FY24
Q4 FY24Q3 FY24 Q1 FY25
RULE OF 40
45%
43%
42%
43%
1
44%
Q1 FY24
Q2 FY24
Q4 FY24Q3 FY24 Q1 FY25
+12 pp
+8 pp
+4 pp
Fiscal year ends on the Saturday closest to February 1
See Appendix for reconciliation to GAAP financial measures

© Samsara Inc.
Fiscal year ends on the Saturday closest to February 1
1
Q4 FY24 was a 14-week fiscal quarter instead of a typical 13-week fiscal quarter. Adjusted revenue and adjusted revenue growth remove the impact of the additional week of revenue
recognition in Q4 FY24 to match the comparative period
2
See Disclaimer and Statement Regarding Use of Non-GAAP Measures and Appendix for information regarding reconciliations to GAAP financial measures
Financial Guidance
FY25Q2 FY25
Total Revenue
Y/Y Revenue Growth
Y/Y Adj. Revenue Growth
1
$288 million - $290 million
31% - 32% growth
$1.205 billion - $1.213 billion
29% growth
31% - 32% growth
Non-GAAP Operating Margin %
2
(2%) 3%
Non-GAAP EPS
2
$0.00 - $0.01 $0.13 - $0.15
© Samsara Inc.
Fiscal year ends on the Saturday closest to February 1
1
Refers to previously issued financial guidance dated 03/07/24
2
Q4 FY24 was a 14-week fiscal quarter instead of a typical 13-week fiscal quarter. Adjusted revenue and adjusted revenue growth remove the impact of the additional week of revenue recognition in Q4 FY24 to enable comparability across periods
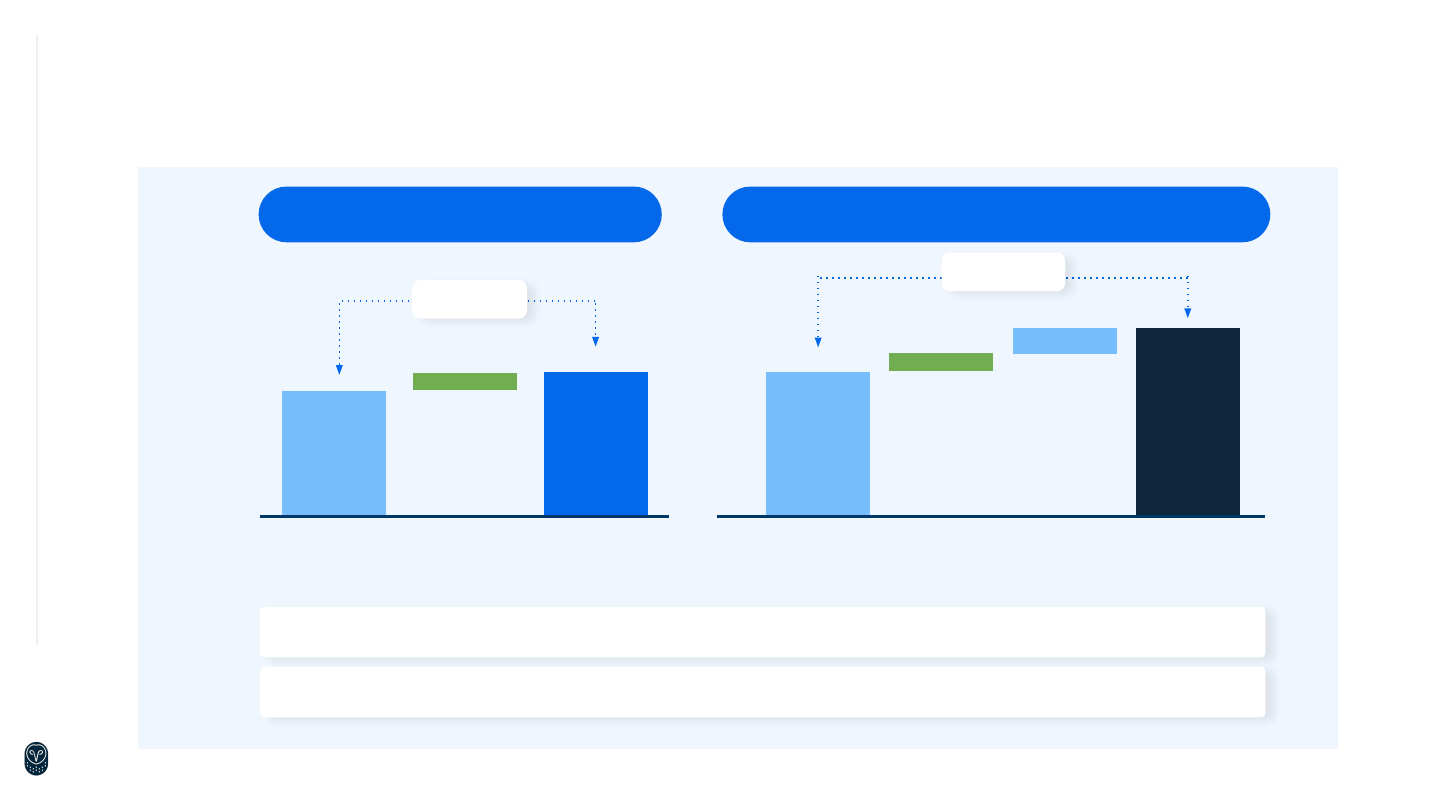
YoY
Growth
33%
37% 27% 29%
Q1 FY25
FY25
Revenue ($M)
Prev. Guidance
Midpoint
1
$272
$281
$9
Q1
Performance
Actual
Results
$1,191
$1,209
$9
$9
Prev. Guidance
Midpoint
1
Q1
Performance
Guidance
Change
Current
Guidance
Midpoint
3% Beat
2% Raise
Adj. YoY
Growth
2
30% 32%
Comparison to Previously Issued Guidance

~300
~70
US-listed
software companies
$1B+ ARR
30%+ growth
& FCF positive
US-listed software companies with:
➔ $1B+ ARR
1
➔ 30%+ revenue growth expected in CY24
2
➔ LTM free cash flow positive
3
Samsara is Operating
in Rarified Air
2
Source: CapIQ data as of June 5, 2024 for publicly listed Application Software, System Software and Internet Services and Infrastructure companies
1
For companies other than Samsara, Q1 CY24 total revenue multiplied by four used as a proxy for ARR
2
For Samsara, used adjusted revenue to remove the impact of the additional week of revenue recognition in Q4 FY24 to match the comparative period.
Excludes companies with less than 75% software revenues in CY23
3
Represents adjusted free cash flow for Samsara. LTM refers to the last four fiscal quarters

Q&A

Appendix
© Samsara Inc.
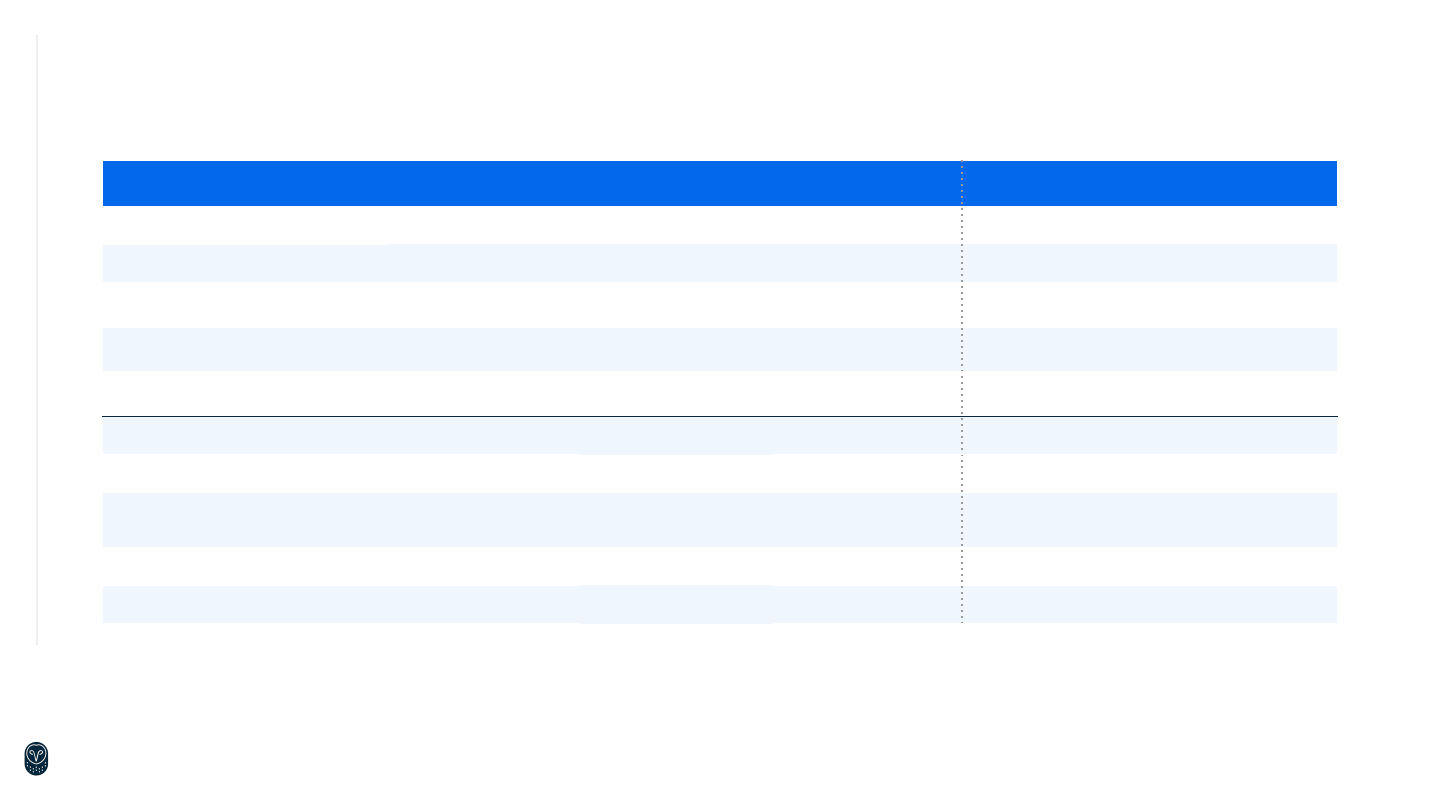
GAAP to Non-GAAP Reconciliations
Note: Figures (other than %’s) in $000’s
FY22 FY23 FY24 Q1 FY24 Q1 FY25
GAAP revenue $428,345 $652,545 $937,385 $204,320 $280,726
Less: Additional week in Q4 FY24 $0 $0 $19,734 $0 $0
Adjusted revenue $428,345 $652,545 $917,651 $204,320 $280,726
Y/Y Revenue Growth 71% 52% 44% 43% 37%
Y/Y Adjusted Revenue Growth 71% 52% 41% 43% 37%
GAAP gross profit $303,861 $469,889 $690,353 $146,763 $212,101
GAAP gross margin 71% 72% 74% 72% 76%
Add: Stock-based compensation
expense-related charges
$6,344 $9,466 $12,725 $2,915 $3,766
Non-GAAP gross profit $310,205 $479,355 $703,078 $149,678 $215,867
Non-GAAP gross margin 72% 73% 75% 73% 77%
Fiscal year ends on the Saturday closest to February 1
© Samsara Inc.
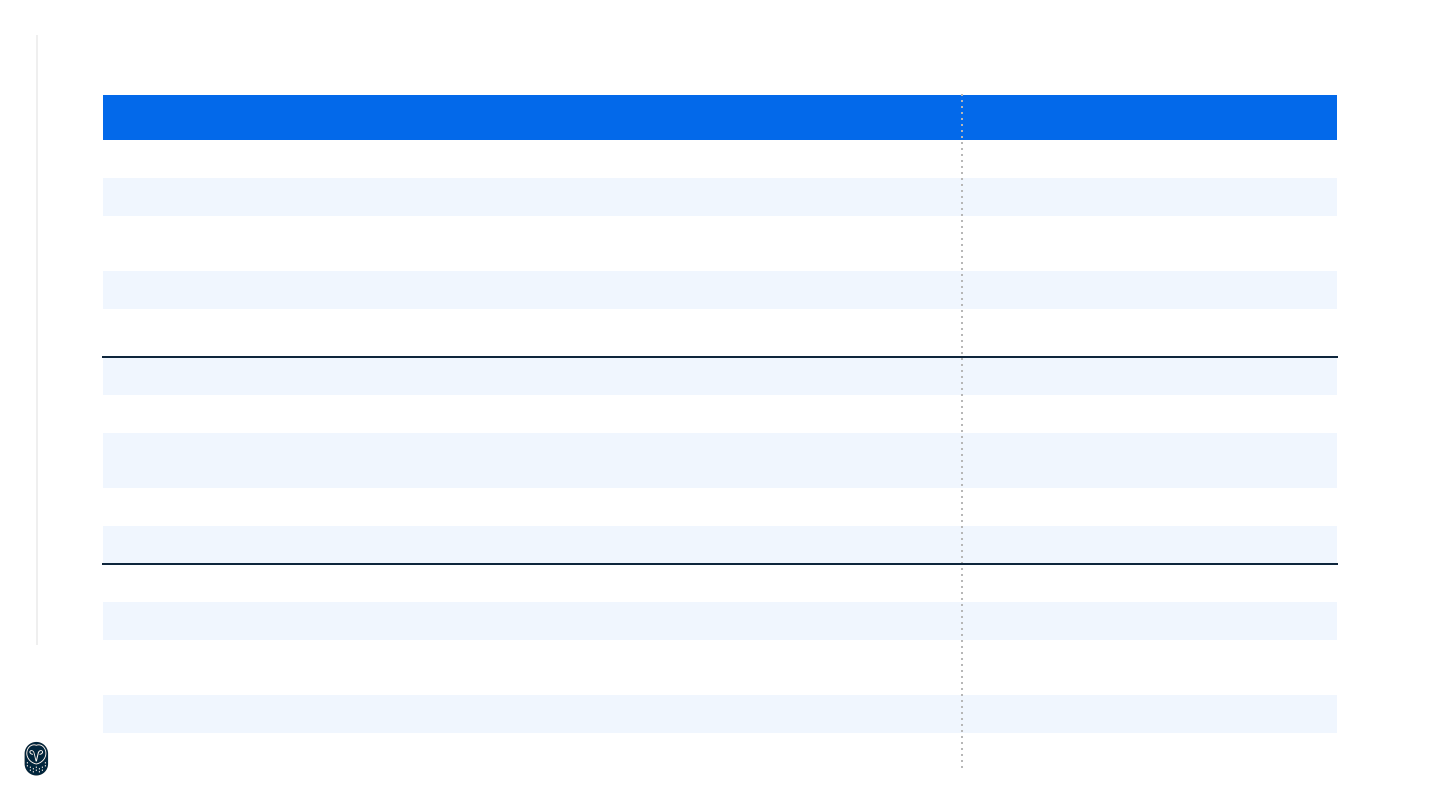
GAAP to Non-GAAP Reconciliations
Note: Figures (other than %’s) in $000’s
FY22 FY23 FY24 Q1 FY24 Q1 FY25
GAAP S&M expense $291,209 $370,098 $486,649 $118,955 $147,437
GAAP S&M margin (% of total revenue) 68% 57% 52% 58% 53%
Less: Stock-based compensation
expense-related charges
($62,548) ($54,072) ($75,203) ($16,320) ($20,682)
Non-GAAP S&M expense $228,661 $316,026 $411,446 $102,635 $126,755
Non-GAAP S&M margin (% of total revenue) 53% 48% 44% 50% 45%
GAAP R&D expense $205,125 $187,405 $258,581 $60,366 $72,973
GAAP R&D margin (% of total revenue) 48% 29% 28% 30% 26%
Less: Stock-based compensation
expense-related charges
($102,849) ($64,184) ($95,220) ($22,053) ($26,264)
Non-GAAP R&D expense $102,276 $123,221 $163,361 $38,313 $46,709
Non-GAAP R&D margin (% of total revenue) 24% 19% 17% 19% 17%
GAAP G&A expense $159,843 $170,785 $195,043 $43,266 $57,688
GAAP G&A margin (% of total revenue) 37% 26% 21% 21% 21%
Less: Stock-based compensation
expense-related charges
($66,497) ($53,702) ($68,042) ($15,505) ($21,444)
Non-GAAP G&A expense $93,346 $117,083 $127,001 $27,761 $36,244
Non-GAAP G&A margin (% of total revenue) 22% 18% 14% 14% 13%
Fiscal year ends on the Saturday closest to February 1
© Samsara Inc.
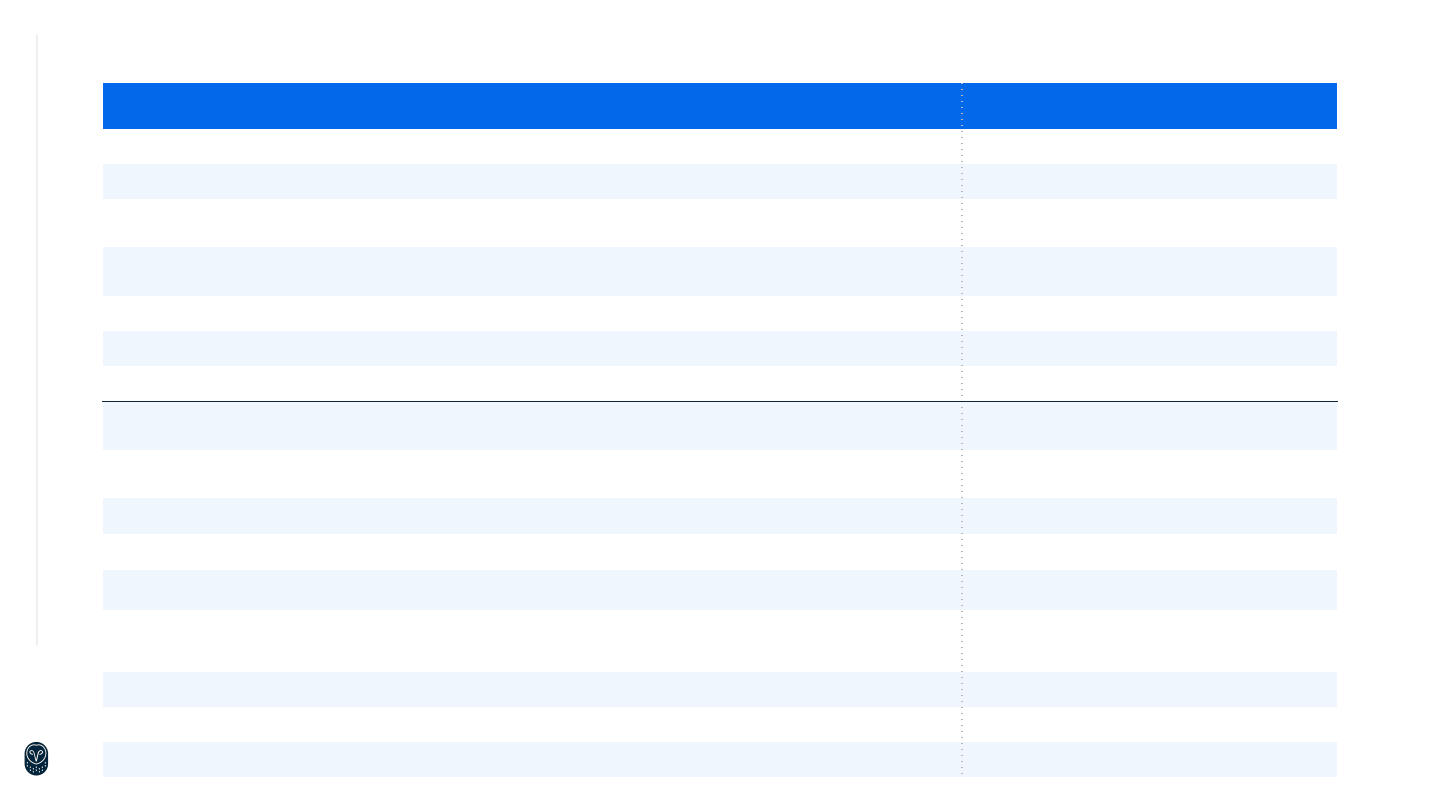
GAAP to Non-GAAP Reconciliations
Note: Figures (other than %’s) in $000’s
Fiscal year ends on the Saturday closest to February 1
FY22 FY23 FY24 Q1 FY24 Q1 FY25
GAAP operating loss ($353,848) ($259,455) ($323,347) ($75,824) ($65,997)
GAAP operating margin (83%) (40%) (34%) (37%) (24%)
Add: Stock-based compensation
expense-related charges
$238,238 $181,424 $251,190 $56,793 $72,156
Add: Lease modification, impairment,
and related charges
$1,532 $1,056 $4,762 $0 $0
Add: Legal settlement $0 $0 $68,665 $0 $0
Non-GAAP operating income (loss) ($114,078) ($76,975) $1,270 ($19,031) $6,159
Non-GAAP operating margin (27%) (12%) 0% (9%) 2%
Net cash provided by (used in) operating
activities
($171,481) ($103,021) ($11,815) $10,454 $23,670
Net cash provided by (used in) operating
activities margin
(40%) (16%) (1%) 5% 8%
Add: Purchase of property and equipment ($19,353) ($33,240) ($10,953) ($2,499) ($5,062)
Free cash flow ($190,834) ($136,261) ($22,768) $7,955 $18,608
Free cash flow margin (45%) (21%) (2%) 4% 7%
Less: Purchase of property and equipment
for build-out of corporate office facilities,
net of tenant allowances
$11,096 $26,227 ($10,179) ($10,179) $0
Less: Legal settlement $0 $0 $60,000 $0 $0
Adjusted free cash flow ($179,738) ($110,034) $27,053 ($2,224) $18,608
Adjusted free cash flow margin (42%) (17%) 3% (1%) 7%

© Samsara Inc.
Annual Contract Value (ACV)
We define ACV as the annualized value of a customer's total contract value for
Samsara products as of the measurement date.
Net New ACV (NN ACV)
Net New ACV is calculated as the incremental annual contract value, through upsells,
cross-sells or new business, that is recognized in a given reporting period and was
not present as of the beginning of the reporting period.
Annual Recurring Revenue (ARR)
We define ARR as the annualized value of subscription contracts that have
commenced revenue recognition as of the measurement date.
Net New ARR (NN ARR)
Net New ARR is calculated as the difference between the annualized value of
subscription contracts that have commenced revenue recognition as of the end of
the reporting period and the annualized value of subscription contracts that have
commenced revenue recognition as of the end of the prior reporting period.
Adjusted Revenue / Adjusted Revenue Growth Rate
Q4 FY24 was a 14-week fiscal quarter instead of a typical 13-week fiscal quarter. To
enable comparability across periods, adjusted revenue and adjusted revenue growth
rate are calculated by multiplying Q4 FY24 revenue by 13/14 to remove the impact of
an additional week of revenue in Q4 FY24.
Customer
We define a customer as an entity that has an ARR of greater than $1,000 at the end
of a reporting period.
Definitions / Methodology
Core Customer
We define a core customer as an entity that has an ARR of greater than $10,000 at
the end of a reporting period.
Large Customer
We define a large customer as an entity that has an ARR of greater than $100,000
at the end of a reporting period.
Dollar-Based Net Retention Rate
We calculate our dollar-based net retention rate as of a period end by starting with
the ARR from the specified cohort of customers as of 12 months prior to such
period-end, or the Prior Period ARR. We then calculate the ARR from these same
customers as of the current period-end, or the Current Period ARR. Current Period
ARR includes any expansion, and is net of contraction or attrition over the last 12
months, but excludes ARR from new customers in the current period, as well as
any ARR associated with paid trials. We then divide the total Current Period ARR
by the total Prior Period ARR to arrive at the point-in-time dollar-based net
retention rate. We then calculate the weighted average of the trailing 12-month
point-in-time dollar-based net retention rates to arrive at the dollar-based net
retention rate.
In calculating the dollar-based net retention rate for core customers and for
$100K+ ARR customers, we look at the cohort of customers with a Prior Period
ARR greater than $0 who have met or exceeded $10,000 ARR in the case of core
customers, or $100,000 ARR in the case of $100K+ ARR customers, during their
lifetime as a Samsara customer.