
Investor Presentation – Fourth Quarter 2023
February 2024
Financial Information for the three and twelve months ended December 31, 2023

1
Disclaimers
LIMITATIONS ON THE USE OF INFORMATION
This presentation has been prepared by Tiptree Inc. and its consolidated subsidiaries (“Tiptree", "the Company" or "we”) solely for informational purposes, and not for the purpose of updating any
information or forecast with respect to Tiptree, its subsidiaries or any of its affiliates or any other purpose. Tiptree reports a non-controlling interest in certain operating subsidiaries that are not wholly
owned. Unless otherwise noted, all information is of Tiptree on a consolidated basis before non-controlling interest. Neither Tiptree nor any of its affiliates makes any representation or warranty,
express or implied, as to the accuracy or completeness of the information contained herein and no such party shall have any liability for such information. These materials and any related oral
statements are not all-inclusive and shall not be construed as legal, tax, investment or any other advice. You should consult your own counsel, accountant or business advisors. Performance
information is historical and is not indicative of, nor does it guarantee future results. There can be no assurance that similar performance may be experienced in the future.
SPECIAL NOTE REGARDING FORWARD-LOOKING STATEMENTS
This document contains "forward-looking statements" which involve risks, uncertainties and contingencies, many of which are beyond Tiptree's control, which may cause actual results, performance,
or achievements to differ materially from anticipated results, performance, or achievements. All statements contained herein that are not clearly historical in nature are forward-looking, and the
words "anticipate," "believe," "estimate," "expect,“ “intend,” “may,” “might,” "plan," “project,” “should,” "target,“ “will,” "view," “confident,” or similar expressions are intended to identify forward-looking
statements. Such forward-looking statements include, but are not limited to, statements about Tiptree's plans, objectives, expectations and intentions. The forward-looking statements are not
guarantees of future performance and are subject to risks, uncertainties and other factors, many of which are beyond our control, are difficult to predict and could cause actual results to differ
materially from those expressed or forecast in the forward-looking statements. Our actual results could differ materially from those anticipated in these forward-looking statements as a result of
various factors, including, but not limited to those described in the section entitled “Risk Factors” in Tiptree’s Annual Report on Form 10-K, and as described in the Tiptree’s other filings with the SEC.
Readers are cautioned not to place undue reliance on these forward-looking statements, which speak only as to the date of this release. The factors described therein are not necessarily all of the
important factors that could cause actual results or developments to differ materially from those expressed in any of our forward-looking statements. Other unknown or unpredictable factors also
could affect our forward-looking statements. Consequently, our actual performance could be materially different from the results described or anticipated by our forward-looking statements. Given
these uncertainties, you should not place undue reliance on these forward-looking statements. Except as required by the federal securities laws, we undertake no obligation to update any forward-
looking statements.
MARKET AND INDUSTRY DATA
Certain market data and industry data used in this presentation were obtained from reports of governmental agencies and industry publications and surveys. We believe the data from third-party
sources to be reliable based upon our management’s knowledge of the industry, but have not independently verified such data and as such, make no guarantees as to its accuracy, completeness or
timeliness.
NOT AN OFFER OR A SOLICIATION
This document does not constitute an offer or invitation for the sale or purchase of securities or to engage in any other transaction with Tiptree, its subsidiaries or its affiliates. The information in this
document is not targeted at the residents of any particular country or jurisdiction and is not intended for distribution to, or use by, any person in any jurisdiction or country where such distribution or
use would be contrary to local law or regulation.
NON-GAAP MEASURES
In this document, we sometimes use financial measures derived from consolidated financial data but not presented in our financial statements prepared in accordance with U.S. generally accepted
accounting principles ("GAAP"). Certain of these data are considered “non-GAAP financial measures” under the SEC rules. These non-GAAP financial measures supplement our GAAP disclosures
and should not be considered an alternative to the GAAP measure. Management's reasons for using these non-GAAP financial measures and the reconciliations to their most directly comparable
GAAP financial measures are posted in the Appendix.

2
2023 Highlights
Revenue
$1.6 billion
18.0% vs. prior year
Adjusted Net Income
1
$61.9 million
16.7% vs. prior year
Book Value
per share
1,3
$11.34
5.7% vs. 12/31/22
Net Income
$14.0 million
vs. prior year net loss
of $(8.3) million
Overall
Revenues of $1.6 billion, an increase of 18% from 2022, driven by growth at Fortegra.
Excluding investment gains and losses, revenues increased 19%.
Net income of $14mm in 2023. Included is $19.1mm of tax expense related to tax deconsolidation of Fortegra,
compared to $33.1m of tax expense in 2022.
Adj. net income
1
of $61.9mm, and 15.2% adj. ROAE
1
, driven by strong performance in insurance operations.
Insurance
$2.75Bn of gross written premiums and premium equivalents (GWPPE), 21% increase from prior year, driven growth
in specialty E&S and admitted insurance lines.
Combined ratio of 90.3% driven by consistent underwriting performance and the scalability of operating platform.
Adj. net income
1,2
of $115.7mm, up 38% from prior year driven by revenue growth and consistent combined ratio.
Adj. return on average equity
1,2
of 29.2%, compared to 26.1% in 2022.
Tiptree Capital
Pre-tax loss of $6.5mm driven by unrealized investment losses on Invesque.
Mortgage pre-tax loss of $3.3mm, more than offset by gains on other investments.
($ in millions, all figures represent full year unless otherwise noted)
1 For a reconciliation of Non-GAAP metrics adjusted net income, adjusted return on average equity and book value per share to GAAP financials, see the Appendix.
2 Adjusted net income and adjusted return on average equity is presented before the impacts of non-controlling interests.
3 Annual total return defined as cumulative dividends paid of $0.20 per share plus change in book value per share as of December 31, 2023.

Financial Results
Q4'22 Q4'23 FY’22 FY’23
$89.1
Total Revenues
$369.5
$446.4
$1,397.8
$1,649.0
Net income (loss)
$0.9
$6.9
$(8.3)
$14.0
Diluted EPS
$0.02
$0.15
$(0.23)
$0.33
Adjusted net income
1
$9.7
$13.9
$53.0
$61.9
Adjusted ROAE
1
9.9%
13.6%
13.6%
15.2%
Total shares outstanding
36.4
36.8
Book Value per share
1
$10.92
$11.34
3
1 For a reconciliation of Non-GAAP metrics adjusted net income, adjusted return on average equity (annualized) and book value per share to GAAP financials, see the Appendix.
2 Adjusted net income for Fortegra is presented before the impacts of non-controlling interests.
($ in millions, except per share information)
$20.4
$23.9
$32.6
$4.6
$(0.8)
$(0.4)
$(8.1)
$(8.6)
$(11.7)
$16.9
$14.6
$20.5
Q4'21 Q4'22 Q4'23
Corporate
Fortegra
2
Tiptree
Capital
Key Highlights – Q4’23
Adjusted Net Income by business
Revenues up 24%, excluding investment gains/losses
• Growth in earned premiums, service fees and investment income
• Improvement in investment portfolio book yield to 3.3%, from 2.7% prior year
Net income of $6.9mm
• Growth in insurance operations while maintaining consistent combined ratio
• Unrealized investment gains partially offset by sale of vessels in 2022
• Impact of Fortegra tax deconsolidation of $9mm in Q4‘23 and Q4‘22
Adj. net income
1
of $13.9mm, increased by 43% versus prior year
• Continued revenue growth and consistent combined ratio at Fortegra
Adj. ROAE
1
of 13.6%, improvement of 3.7% versus prior year
$66.8
$83.8
$115.7
$28.2
$9.0
$(31.1)
$(29.4)
$(29.9)
$63.9
$63.4
$85.7
2021 2022 2023
$16.2 $53.0 $61.9$61.6$9.7 $13.9
Adjusted
Net Income
(after NCI)

Specialty Insurance Performance Highlights
Q4’23
5
Fortegra – Financial Performance Highlights
Record revenues of $433mm, up 25%
• Product & distribution expansion to drive continued growth,
while maintaining underwriting discipline
• Continued investment in growth initiatives
✓ Specialty E&S and admitted lines
✓ Capital-light warranty lines
✓ European expansion
Produced stable, growing results from underwriting and fees
• Combined ratio consistent at 89.8%
• Record underwriting & fee margin of $98mm, up 28%
• 2023 Adj ROAE of 29.2%, driven by insurance and services
Maintain a high-quality balance sheet, including a conservative
and liquid investment portfolio
Underwriting and
Fee Margin
1
Underwriting and
Fee Revenues
1
Combined
Ratio
1
2
3
Summary Financials
Insurance products
Q4’23 Highlights & Outlook
($ in millions)
Expense
Ratio
Loss Ratio
Services
Insurance
1 See the appendix for a reconciliation of Non-GAAP measures including Adjusted Net Income (before non-controlling interests), Adjusted return on average equity (annualized), underwriting and fee revenues and underwriting and fee margin. .
Note: Tiptree’s ownership of Fortegra was 79.5% as of December 31, 2023 (before conversion of Fortegra preferred stock and impacts of warrants and unvested employee stock awards).
Q
4’
22
Q4’23
FY’22 FY’23
Premiums
& equivalents
$526.6
$724.1
$2,263.1
$2,747.9
Net written premiums
$245.2
$384.3
$1,089.4
$1,320.0
Revenue
$345.4
$433.2
$1,248.8
$1,593.1
Pre
-tax income (loss)
$29.1
$44.2
$68.2
$129.8
Adjusted net income
1
$23.9
$32.6
$83.8
$115.7
Adjusted ROAE
1
29.3%
30.9%
26.1%
29.2%
Combined ratio
89.8%
89.8%
90.4%
90.3%
Services
Insurance
245
305
78
95
$324
$400
Q4'22 Q4'23
49
70
27
28
$76
$98
Q4'22 Q4'23
37.8%
39.6%
38.7%
36.0%
13.3%
14.2%
89.8%
89.8%
Q4'22 Q4'23
Acquisition
ratio
Investment Portfolio
Cash & Equivalents
31%
Government &
Agency
33%
Corporate Bonds
19%
Muni & ABS
6%
Equities
2%
Other Alternatives
9%
Cash & Equivalents
34%
Government &
Agency
38%
AA
6%
A
13%
BBB
7%
$1,191mm
6
Asset Allocation
Liquid and Highly-Rated Fixed Income Portfolio
($ in millions)
1,057
1,191
97
136
$1,154
$1,327
2022 2023
Other investments
Fixed Income & Cash
$1,327mm
◼ 2.5 year duration
◼ AA, S&P rating
3.3%2.7%
Book yield
Q4’22
Q4’23
FY’22
FY’23
Net investment income
– P&L
$2.1
$7.1
$12.2
$26.7
Cash and cash equivalent interest income
$1.8
$3.2
$2.5
$11.0
Net realized and unrealized gains (losses)
– P&L
$2.8
$6.4
$(20.3)
$(4.2)
Unrealized gains (losses) on AFS Securities
–
OCI
$1.3
$23.0
$(55.2)
$19.0
Return Metrics (Pre-tax, before NCI)
Fortegra – A Highly Profitable and Growing Specialty Insurer
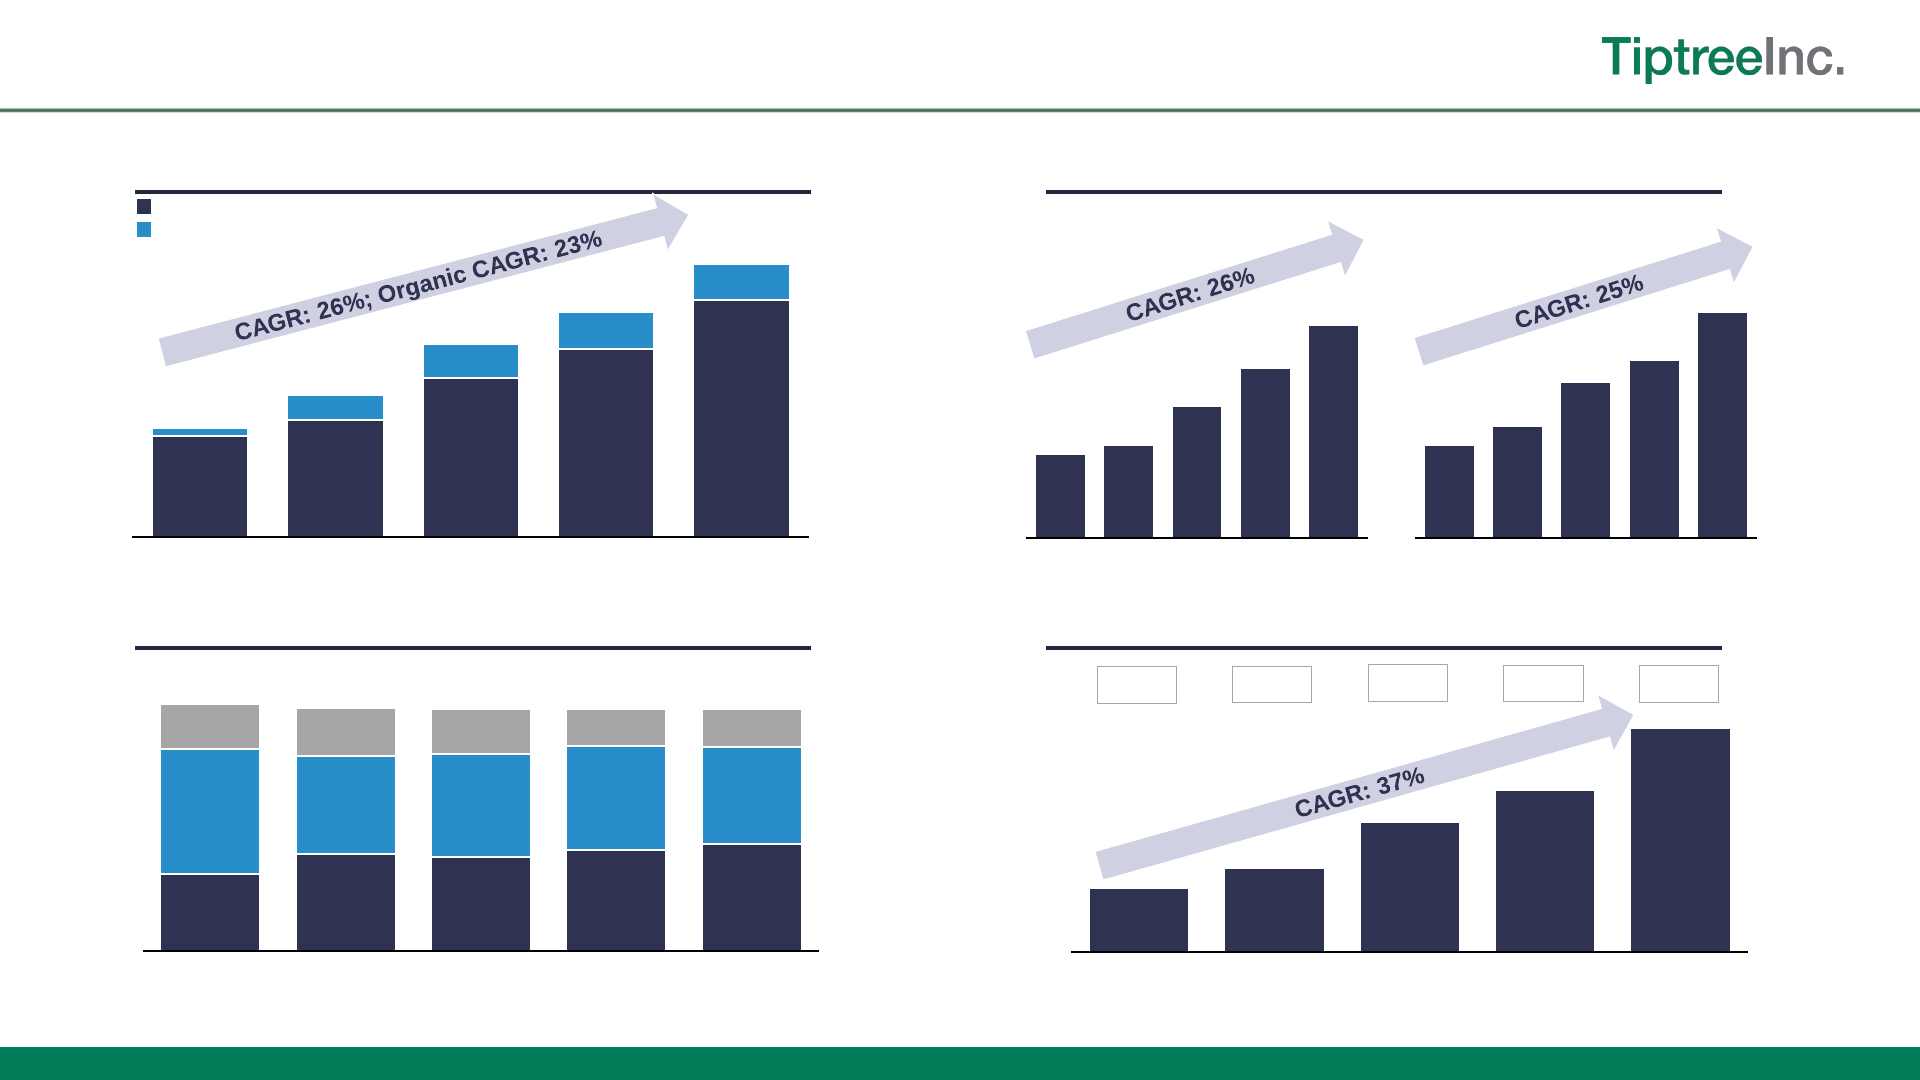
$32.8
$43.4
$66.8
$83.8
$115.7
2019 2020 2021 2022 2023
7
($ in millions)
Gross Written Premiums & Equivalents
1
Underwriting & Fee Revenues and Margin
2
Adjusted Net Income
2
1,015
1171
1,601
1,889
2,386
75
258
335
374
362
$1,090
$1,430
$1,936
$2,263
$2,748
2019 2020 2021 2022 2023
Combined Ratio
Adj.
ROAE%
2
Adj. Net
Income
Loss
Ratio
Expense
Ratio
Insurance
Services
1 Gross written premiums and premium equivalents represent total gross written premiums from insurance policies and warranty service contracts issued during a reporting period.
2 See the appendix for a reconciliation of Non-GAAP measures including Adjusted Net Income (before non-controlling interests), Adjusted return on average equity (annualized), underwriting and fee revenues and underwriting and fee margin.
12%
U/W & Fee Revenues
26%
U/W & Fee Margin
29%
22%
15%
$145
$176
$244
$279
$355
2019 2020 2021 2022 2023
$594
$654
$932
$1,200
$1,500
2019 2020 2021 2022 2023
28.7%
36.2%
35.1%
37.7%
40.1%
47.0%
36.9%
38.7%
39.0%
36.2%
16.6%
17.9% 16.5%
13.7%
14.0%
92.3%
91.0%
90.3%
90.4%
90.3%
2019 2020 2021 2022 2023
Acquisition
Ratio

Performance Highlights
Q4’23
57.6
7.1
54.7
52.3
13.0
41.3
4.2
77.4
$129.6
$178.1
2022 2023
Financial drivers
Pre-tax income (loss)
Q4’22 Q4’23 FY’22 FY’23
Mortgage
$(2.5)
$(2.4)
$0.9
$(3.3)
Senior living (Invesque)
(3.1)
(2.2)
(16.0)
(9.3)
Maritime transportation
13.3
(2.8)
49.8
(4.5)
Other
0.8
5.3
(2.4)
10.6
Total
$8.5
$(2.1)
$32.3
$(6.5)
9
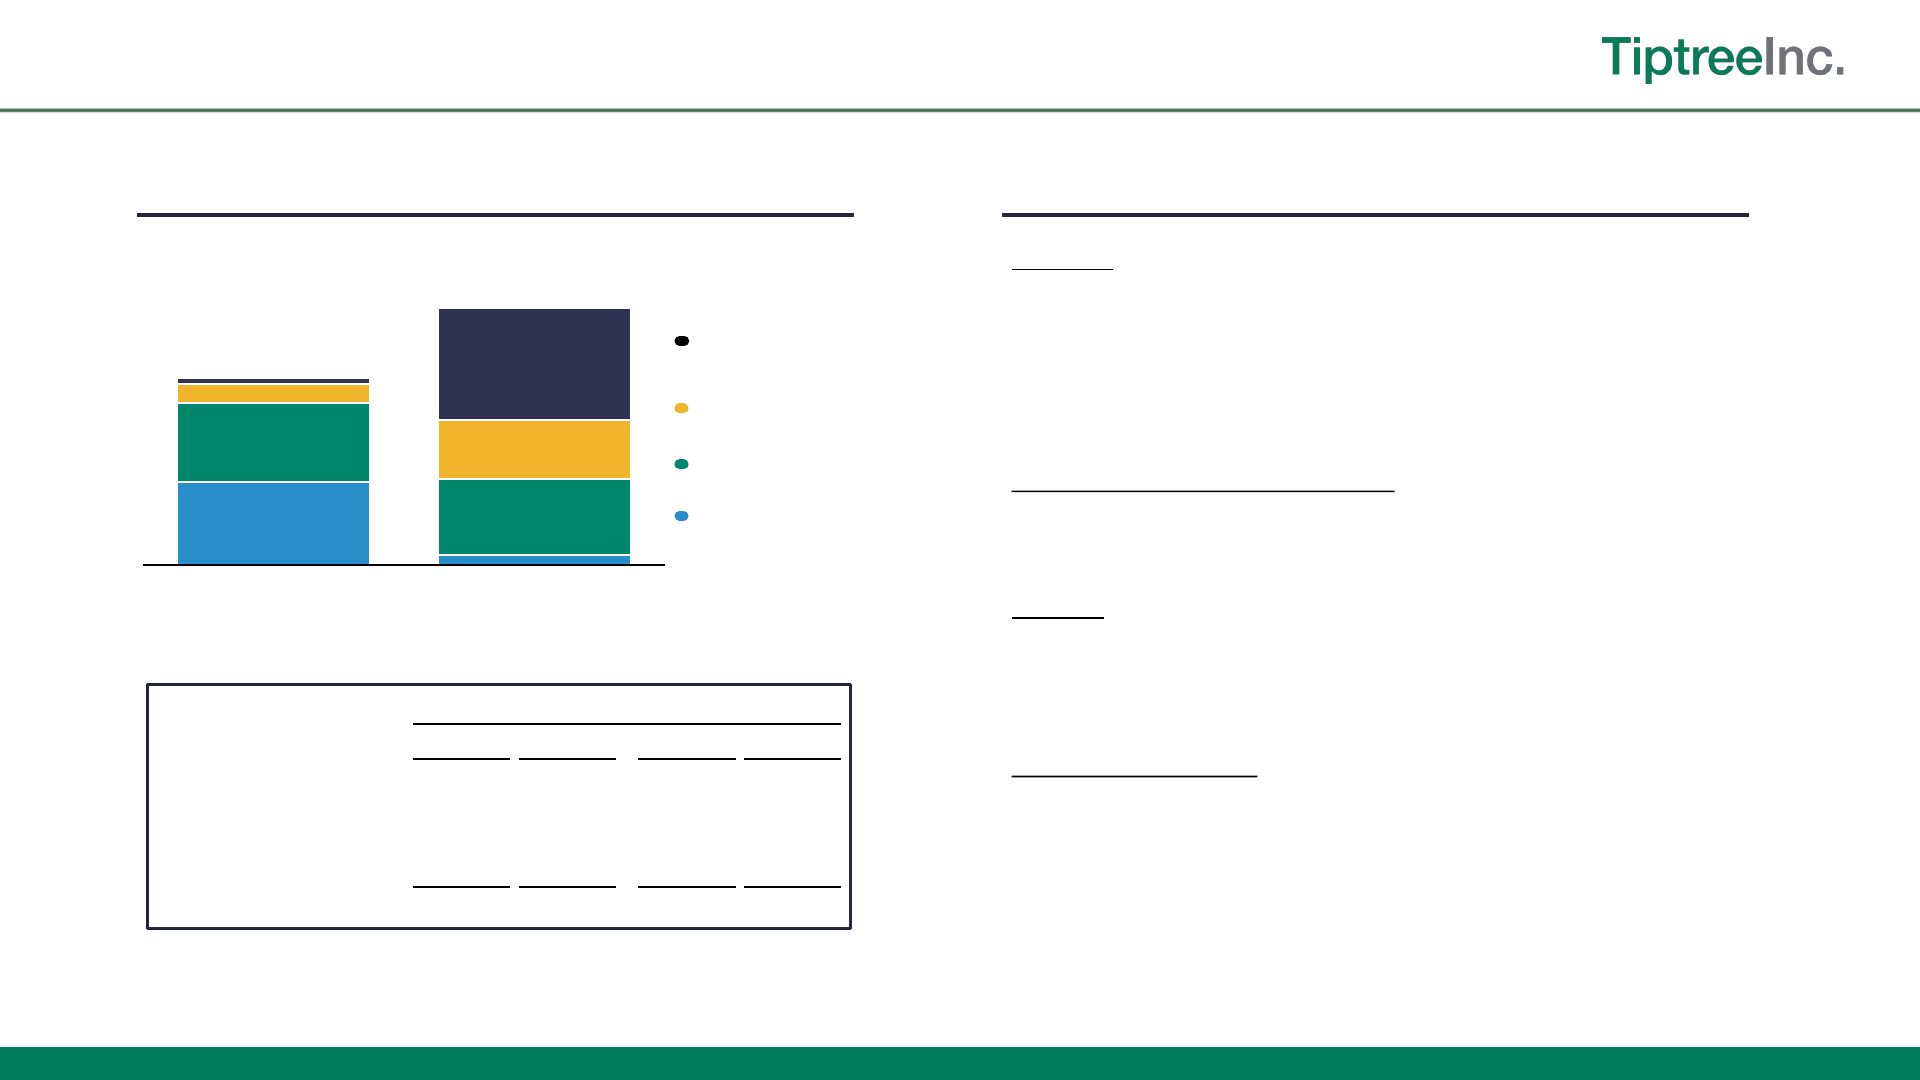
Tiptree Capital – Financial Performance Highlights
Mortgage:
• Mortgage origination volumes of $877mm, down 23% from PY
• Pre-tax contributions below PY from volume decline and negative FV
adjustment on MSR asset; gain on sale margins consistent at 4.7%
• MSR asset of $41mm
Cash & U.S Government Securities:
• Invested in U.S. Government and money market funds
Equities:
• 2023 unrealized loss of $3.5mm, compared to PY loss of $9.3m –
both periods driven by losses on Invesque
Maritime transportation:
• 2022 included one-time gains from sale of five vessels
Capital Allocation 2023 Highlights
($ in millions)
Mortgage
Maritime transportation
and other
Equity Securities
Cash and U.S.
Government Securities

01
Summary
&
Outlook

11
❑ Maintain trajectory of consistent top-line growth
and sustained underwriting profitability over the
long-term in our insurance business
❑ Continue to look for opportunities to allocate
capital for long-term value creation
❑ Remain disciplined and patient as we navigate
today’s economic, political and financial
environment
Summary & Outlook
11
($ in millions)
✓ Strong operating performance from our
businesses
– Fortegra continues to deliver record
financial and operating performance
– Increasing yields on investment
portfolio
2023 Highlights Looking Ahead

Appendix
Non-GAAP Reconciliations
• Insurance underwriting and fee revenue
• Insurance underwriting and fee margin
• Book Value per share
• Adjusted net income

Non-GAAP Reconciliations
13
Adjusted Net Income
We define adjusted net income as income before taxes, less provision (benefit) for income taxes, and excluding the after-tax impact of various expenses that we consider to be unique and non-recurring in nature,
including merger and acquisition related expenses, stock-based compensation, net realized and unrealized gains (losses) and intangibles amortization associated with purchase accounting, all of which is reduced for non-
controlling interests. The calculation of adjusted net income excludes net realized and unrealized gains (losses) that relate to investments or assets rather than business operations. Adjusted net income should not be
viewed as a substitute for income before taxes calculated in accordance with GAAP, and other companies may define adjusted net income differently. Adjusted net income (before NCI) is presented before the impacts of
non-controlling interests.
We present adjustments for amortization associated with acquired intangible assets. The intangible assets were recorded as part of purchase accounting in connection with Tiptree’s acquisition of Fortegra Financial in
2014, Defend in 2019, and Smart AutoCare and Sky Auto in 2020, ITC in 2022 and Premia in 2023. The intangible assets acquired contribute to overall revenue generation, and the respective purchase accounting
adjustments will continue to occur in future periods until such intangible assets are fully amortized in accordance with the respective amortization periods required by GAAP.
We define adjusted return on average equity as adjusted net income expressed on an annualized basis as a percentage of average beginning and ending stockholder’s equity during the period. We use adjusted return on
average equity as an internal performance measure in the management of our operations because we believe it gives our management and other users of our financial information useful insight into our results of
operations and our underlying business performance. Adjusted return on average equity should not be viewed as a substitute for return on average equity calculated in accordance with GAAP, and other companies may
define adjusted return on average equity differently.
Book value per share
Management believes the use of book value per share provides supplemental information useful to investors as it is frequently used by the financial community to analyze company growth on a relative per share basis.
Insurance – Underwriting and Fee Revenues
We generally manage our exposure to the underwriting risk we assume using both reinsurance (e.g., quota share and excess of loss) and retrospective commission agreements with our partners (e.g., commissions paid
are adjusted based on the actual underlying losses incurred), which mitigate our risk. Period-over-period comparisons of revenues and expenses are often impacted by the Producer Owned Reinsurance Company
(PORCs) and distribution partners’ choice as to whether to retain risk, specifically service and administration fees and ceding commissions, both components of revenue, and policy and contract benefits and commissions
paid to our partners and reinsurers. Generally, when losses are incurred, the risk which is retained by our partners and reinsurers is reflected in a reduction in commissions paid. In order to better explain to investors the
underwriting performance of the Company’s programs and the respective retentions between the Company and its agents and reinsurance partners, we use non-GAAP metrics of underwriting and fee revenues and
underwriting and fee margin.
We define underwriting and fee revenues as total revenues excluding net investment income, net realized gains (losses) and net unrealized gains (losses), ceding fees, ceding commissions and cash and cash equivalent
interest income as reported in other income. Underwriting and fee revenues represents revenues generated by our underwriting and fee-based operations and allows us to evaluate our underwriting performance without
regard to investment income. We use this metric as we believe it gives our management and other users of our financial information useful insight into our underlying business performance. Underwriting and fee revenues
should not be viewed as a substitute for total revenues calculated in accordance with GAAP, and other companies may define underwriting and fee revenues differently.
Insurance - Underwriting and Fee Margin
We define underwriting and fee margin as income before taxes, excluding net investment income, net realized gains (losses), net unrealized gains (losses), cash and cash equivalent interest income, employee
compensation and benefits, other expenses, interest expense and depreciation and amortization. Underwriting and fee margin represents the underwriting performance of our underwriting and fee-based programs. As
such, underwriting and fee margin excludes general administrative expenses, interest expense, depreciation and amortization and other corporate expenses as those expenses support the vertically integrated business
model and not any individual component of our business mix. We use this metric as we believe it gives our management and other users of our financial information useful insight into the specific performance of our
underlying underwriting and fee programs. Underwriting and fee income should not be viewed as a substitute for income before taxes calculated in accordance with GAAP, and other companies may define underwriting
and fee margin differently.

14
Non-GAAP Reconciliations – Underwriting & Fee Revenues & Margin
($ in thousands, except per share information)
2023 2022 2023 2022 2021 2020 2019
Total Revenues 433,170$ 345,408$ 1,593,070$ 1,248,796$ 984,130$ 691,061$ 635,085$
Less: Net investment income (7,061) (2,055) (26,674) (12,219) (17,896) (9,916) (8,667)
Less: Net realized and unrealized gains (losses) (6,395) (2,804) 4,207 20,347 2,006 11,944 (6,896)
Less: Ceding fees (12,015) (11,134) (44,628) (40,154) (24,183) (17,834) (14,331)
Less: Ceding commissions (4,154) (3,994) (14,915) (13,880) (11,784) (21,101) (9,608)
Less: Cash and cash equivalent interest income (3,210) (1,768) (11,037) (2,505) (55) (211) (1,123)
Underwriting and fee revenues - Non GAAP 400,335$ 323,653$ 1,500,023$ 1,200,385$ 932,218$ 653,943$ 594,460$
2023 2022 2023 2022 2021 2020 2019
Income (loss) before income taxes 44,232$ 29,093$ 129,816$ 68,150$ 69,857$ 26,948$ 37,030$
Less: Net investment income (7,061) (2,055) (26,674) (12,219) (17,896) (9,916) (8,667)
Less: Net realized and unrealized gains (losses) (6,395) (2,804) 4,207 20,347 2,006 11,944 (6,896)
Less: Money market interest income (3,210) (1,768) (11,037) (2,505) (55) (211) (1,123)
Plus: Depreciation and amortization 5,470 4,854 21,425 18,551 17,223 10,835 9,105
Plus: Interest expense 6,915 4,888 25,836 20,054 17,576 15,487 14,766
Plus: Employee compensation and benefits 31,049 23,759 114,341 87,918 76,552 65,089 49,789
Plus: Other expenses
26,945 20,311 96,825 78,832 79,227 55,594 50,657
Underwriting and fee margin 97,945$ 76,278$ 354,739$ 279,128$ 244,490$ 175,770$ 144,661$
2023 2022
Total stockholders’ equity 576,565$ 533,573$
Less: Non-controlling interests (159,699) (136,208)
Total stockholders’ equity, net of non-controlling interests 416,866$ 397,365$
Total common shares outstanding 36,756 36,385
Book value per share 11.34$ 10.92$
Three Months Ended December 31,
Year Ended December 31,
Year Ended December 31,
As of December 31,
Three Months Ended December 31,

15
Non-GAAP Reconciliations – Adjusted Net Income
The footnotes below correspond to the tables above, under
“—Adjusted Net Income - Non-GAAP and “—Adjusted
Return on Average Equity - Non-GAAP” (annualized).
Adjusted net income is presented before the impacts of
non-controlling interests. Tiptree’s subsidiary ownership
percentage as of December 31, 2023 was Fortegra 79.5%,
Tiptree Marine 100%, Reliance (Mortgage) 100%.
(1) Net realized and unrealized gains (losses) added back
in Adjusted net income excludes net realized and
unrealized gains (losses) from the mortgage segment,
those relating to our held-for-sale mortgage originator
(Luxury), and unrealized gains (losses) on mortgage
servicing rights.
(2) Specifically associated with acquisition purchase
accounting. See Note (9) Goodwill and Intangible Assets,
net.
(3) Included in other expenses were expenses related to
banker and legal fees associated with the acquisitions of
Premia and ITC.
(4) Non-cash fair-value adjustments represent a change in
fair value of the Fortegra Additional Warrant liability which
are added-back to adjusted net income. For the 2022
periods, maritime transportation depreciation and
amortization was deducted as a reduction in the value of
the vessel.
(5) For the three and twelve months ended December 31,
2023, included in the adjustment is an add-back of $8.9
million and $19.1 million, respectively, related to deferred
tax expense from the WP Transaction. For the three and
twelve months ended December 31, 2022, included in the
adjustment is an add-back of $9.0 million and $33.1 million,
respectively, related to deferred tax expense from the WP
Transaction.
(6) Tax on adjustments represents the tax applied to the
total non-GAAP adjustments and includes adjustments for
non-recurring or discrete tax impacts.
(7) Total adjusted return on average equity, after non-
controlling interests was 13.6% and 9.9% for the three
months ended December 31, 2023 and 2022, respectively,
based on $13.9 million and $9.7 million of Adjusted net
income over $406.5 million and $392.3 million of average
Tiptree Inc. stockholders’ equity, and 15.2% and 13.6% for
the years ended December 31, 2023 and 2022,
respectively, based on $61.9 million and $53.0 million of
Adjusted net income over $407.1 million and $390.2 million
of average Tiptree Inc. stockholders’ equity.
($ in thousands)
Insurance Mortgage Other Corporate Total Insurance Mortgage Other Corporate Total
Income (loss) before taxes 44,232$ (2,391)$ 333$ (12,109)$ 30,065$ 29,093$ (2,476)$ 10,935$ (12,521)$ 25,031$
Less: Income tax (benefit) expense (5,288) 606 (266) (8,989) (13,937) (10,152) 511 (2,076) (7,196) (18,913)
Less: Net realized and unrealized gains (losses)
(1)
(6,395) 2,794 (596) - (4,197) (2,804) 973 (10,495) - (12,326)
Plus: Intangibles amortization
(2)
4,252 - - - 4,252 4,083 - - - 4,083
Plus: Stock-based compensation expense 780 - - 1,219 1,999 47 - (98) 1,656 1,605
Plus: Non-recurring expenses
(3)
348 - - - 348 1,813 - 140 - 1,953
Plus: Non-cash fair value adjustments
(4)
842 - - - 842 (939) - 1 - (938)
Plus: Impact of tax deconsolidation of Fortegra
(5)
- - - 8,891 8,891 - - - 9,029 9,029
Less: Tax on adjustments
(6)
(6,167) (702) (185) (671) (7,725) 2,798 (150) 1,948 448 5,044
Adjusted net income (before NCI) 32,604$ 307$ (714)$ (11,659)$ 20,538$ 23,939$ (1,142)$ 355$ (8,584)$ 14,568$
Less: Impact of non-controlling interests (6,684) - - - (6,684) (4,884) - - - (4,884)
Adjusted net income 25,920$ 307$ (714)$ (11,659)$ 13,854$ 19,055$ (1,142)$ 355$ (8,584)$ 9,684$
Average stockholders’ equity 422,327$ 53,188$ 128,827$ (44,272)$ 560,070$ 326,431$ 55,726$ 70,628$ 73,789$ 526,574$
Adjusted return on average equity
(7)
30.9% 2.3% (2.2)% NM% 14.7% 29.3% (8.2)% 2.0% NM% 11.1%
($ in thousands)
Insurance Mortgage Other Corporate Total Insurance Mortgage Other Corporate Total
Income (loss) before taxes 129,816$ (3,285)$ (3,264)$ (40,214)$ 83,053$ 68,150$ 874$ 31,403$ (46,416)$ 54,011$
Less: Income tax (benefit) expense (28,224) 837 153 (15,822) (43,056) (21,251) (363) (5,545) (23,291) (50,450)
Less: Net realized and unrealized gains (losses)
(1)
4,207 1,861 5,289 - 11,357 20,347 (7,003) (18,788) - (5,444)
Plus: Intangibles amortization
(2)
16,919 - - - 16,919 16,229 - - - 16,229
Plus: Stock-based compensation expense 2,018 - - 6,251 8,269 2,423 - - 7,093 9,516
Plus: Non-recurring expenses
(3)
2,824 - - - 2,824 3,374 - (729) 2,108 4,753
Plus: Non-cash fair value adjustments
(4)
(1,769) - - - (1,769) (939) - 3,555 - 2,616
Plus: Impact of tax deconsolidation of Fortegra
(5)
- - - 19,101 19,101 1,560 - - 31,573 33,133
Less: Tax on adjustments
(6)
(10,086) (495) (1,255) 797 (11,039) (6,061) 1,834 3,731 (467) (963)
Adjusted net income (before NCI) 115,705$ (1,082)$ 923$ (29,887)$ 85,659$ 83,832$ (4,658)$ 13,627$ (29,400)$ 63,401$
Less: Impact of non-controlling interests (23,742) - - - (23,742) (10,367) - - - (10,367)
Adjusted net income 91,963$ (1,082)$ 923$ (29,887)$ 61,917$ 73,465$ (4,658)$ 13,627$ (29,400)$ 53,034$
Average stockholders’ equity 395,661$ 53,520$ 100,325$ 5,564$ 555,070$ 321,320$ 57,575$ 98,373$ (10,390)$ 466,878$
Adjusted return on average equity
(7)
29.2% (2.0)% 0.9% NM% 15.4% 26.1% (8.1)% 13.9% NM% 13.6%
Year Ended December 31, 2022
Tiptree Capital
Tiptree Capital
Three Months Ended December 31, 2022
Tiptree Capital
Three Months Ended December 31, 2023
Tiptree Capital
Year Ended December 31, 2023

TiptreeInc.
